Financial Resource Management Report: Analysis and Evaluation

Verified

Added on  2023/06/10

|6
|1199
|64
Report
AI Summary
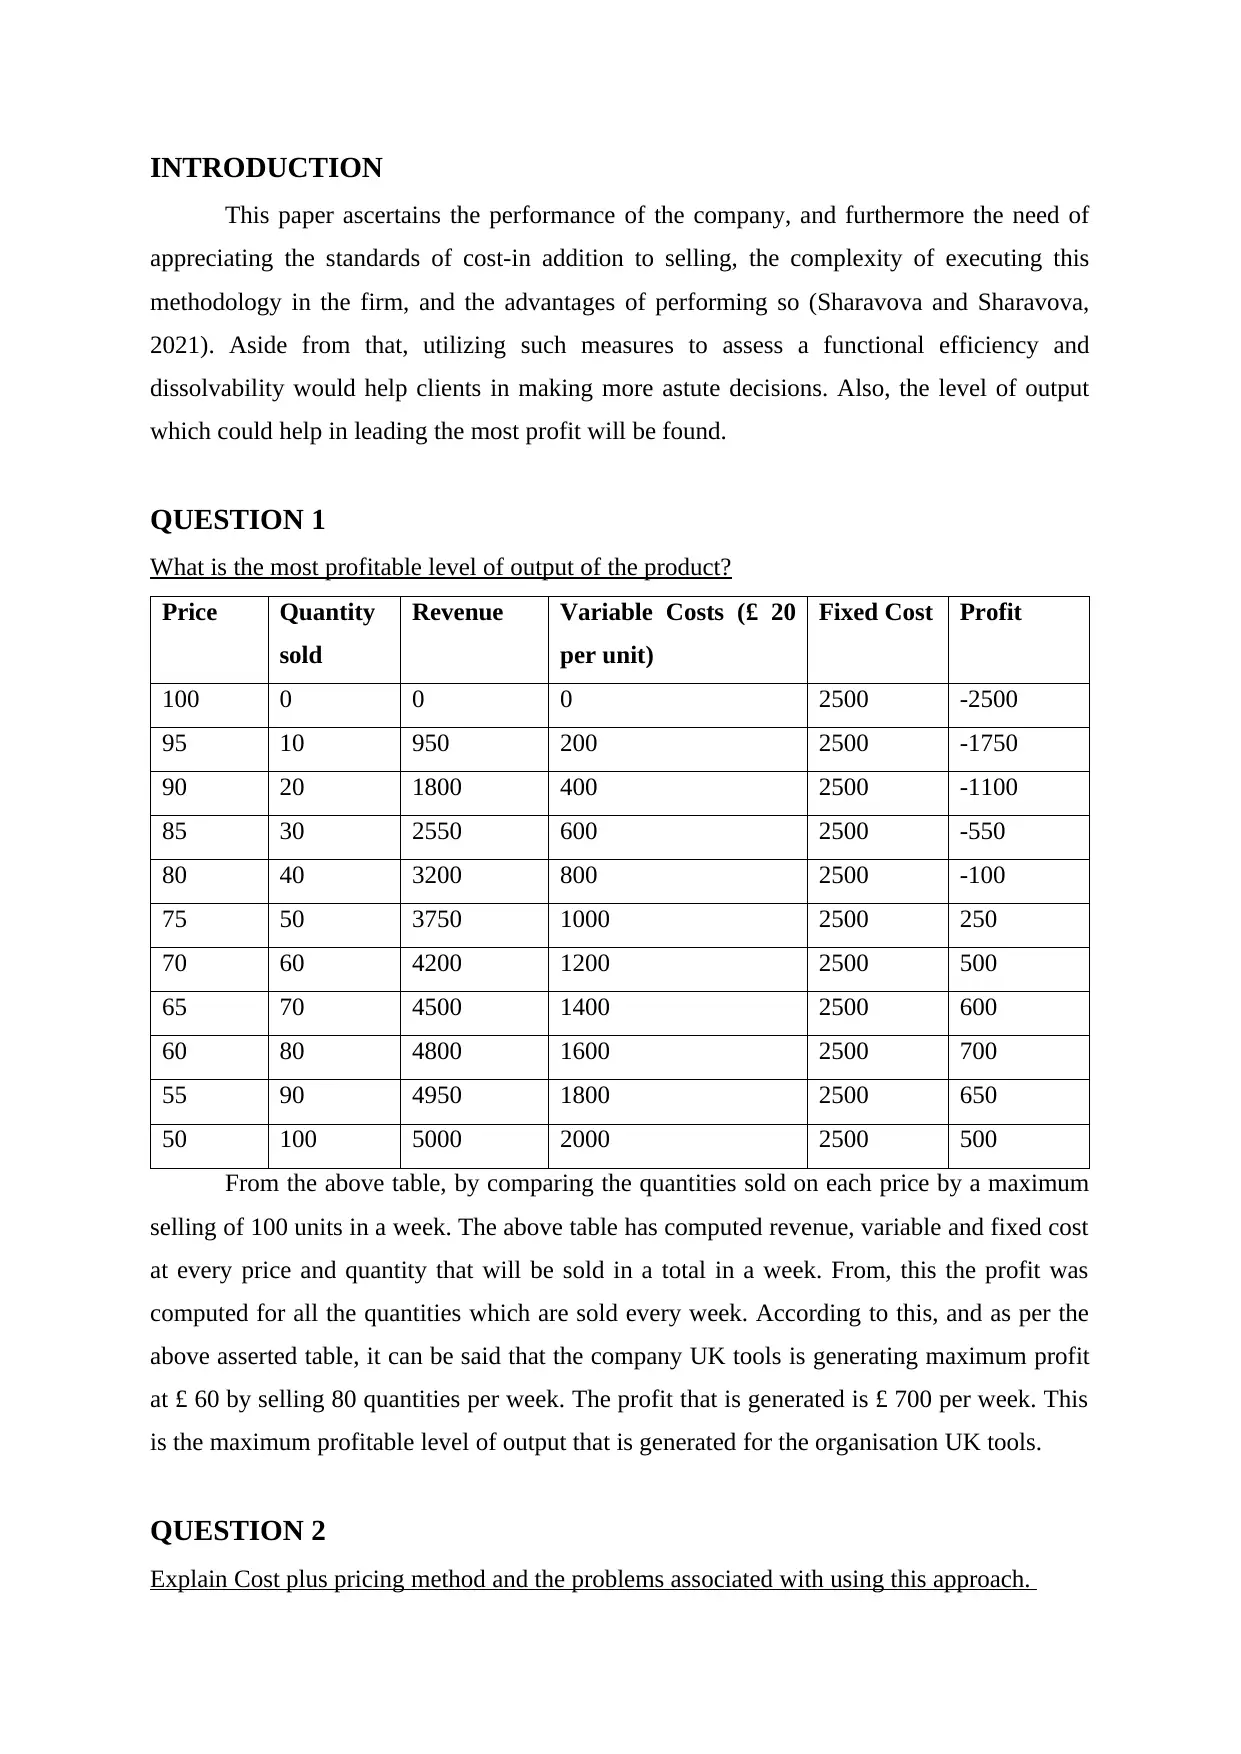
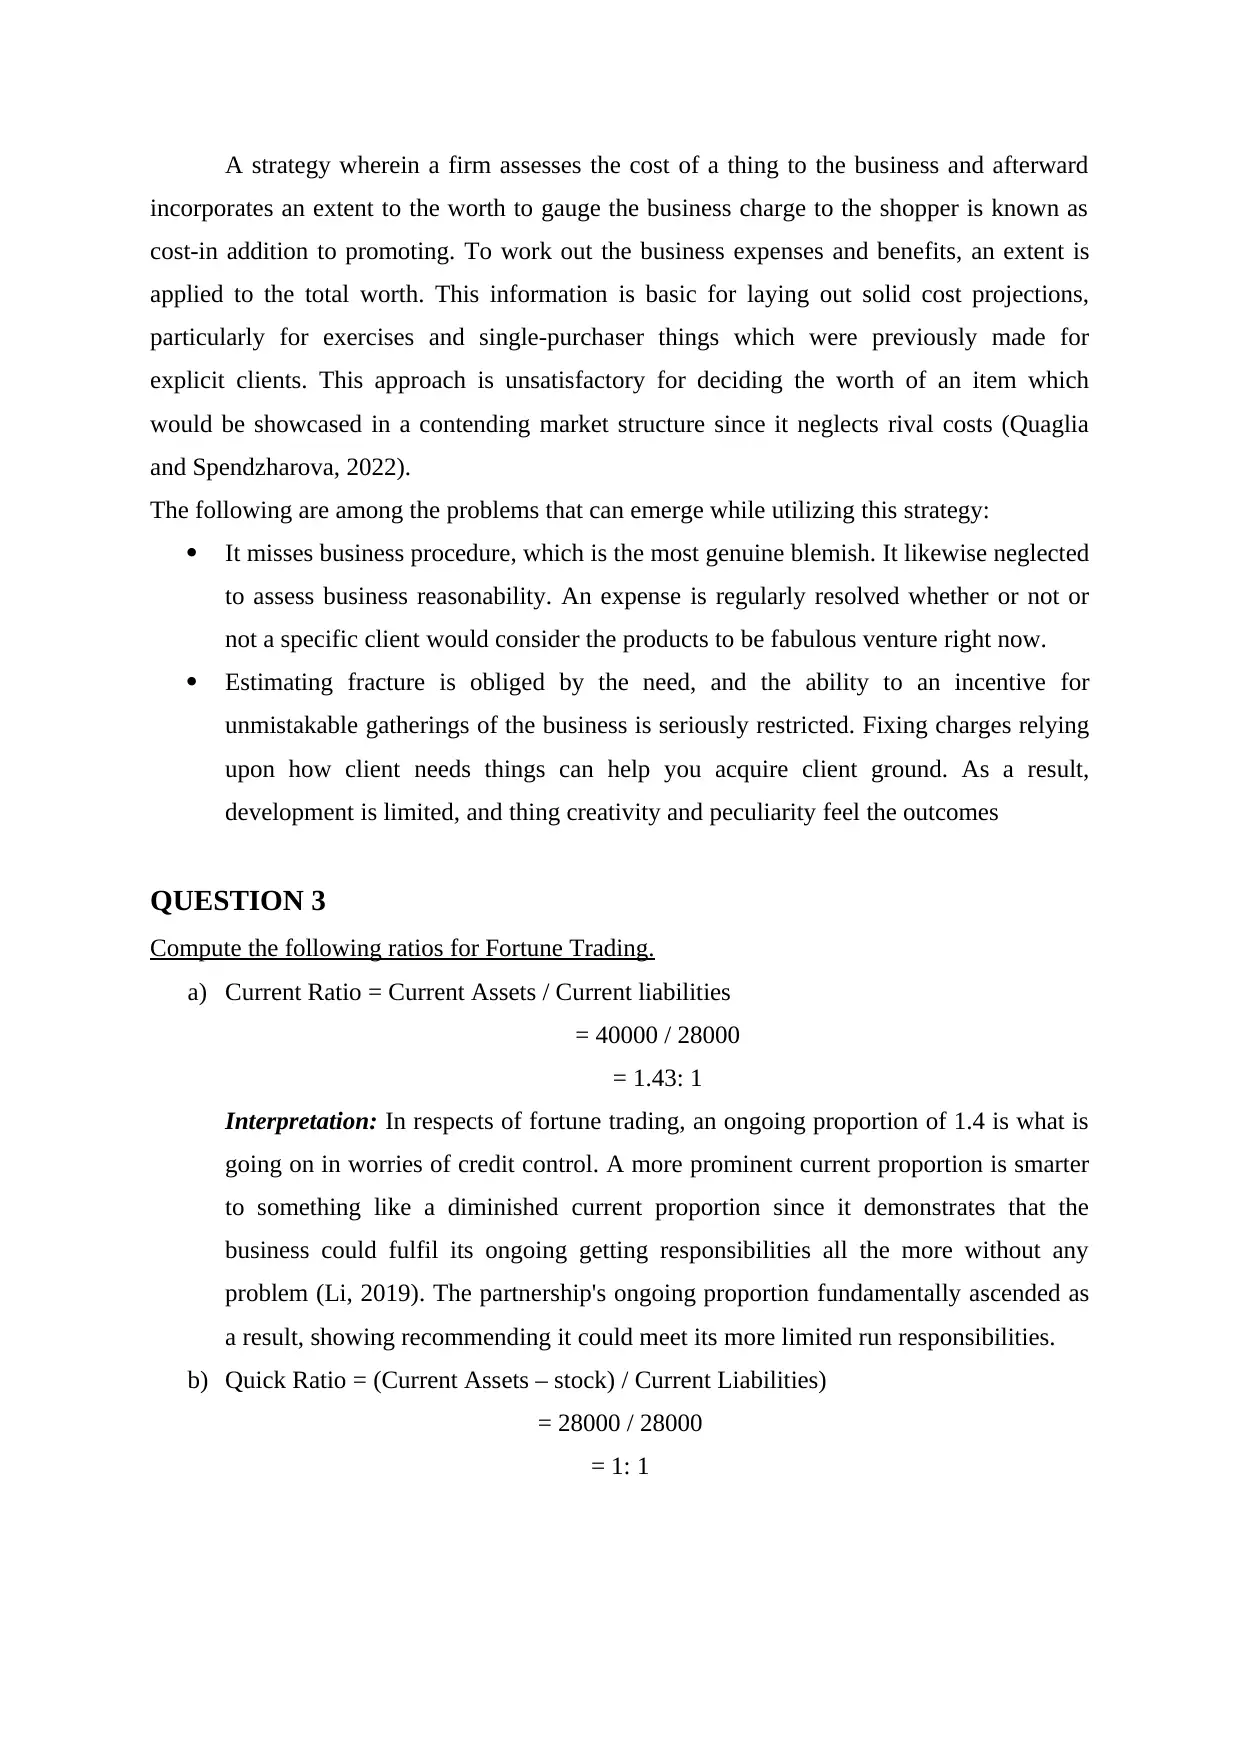
This report provides an in-depth analysis of financial resource management, focusing on profitability, cost-plus pricing, and key financial ratios. It begins by determining the most profitable level of output for a product, using a table to illustrate the relationship between price, quantity, revenue, variable costs, fixed costs, and profit. The report then explains the cost-plus pricing method, detailing its application and associated problems, particularly its limitations in competitive markets. Finally, it computes and interprets various financial ratios for a company, including the current ratio, quick ratio, debt-equity ratio, and proprietary ratio, offering insights into the company's financial health and performance. The conclusion emphasizes the importance of effective resource management for organizational success.
tabler-icon-diamond-filled.svg

Contribute Materials

Your contribution can guide someone’s learning journey. Share your documents today.
Document Page
Managing Financial
Resources
tabler-icon-diamond-filled.svg

Secure Best Marks with AI Grader

Need help grading? Try our AI Grader for instant feedback on your assignments.
Document Page
Contents
INTRODUCTION......................................................................................................................3
QUESTION 1.............................................................................................................................3
What is the most profitable level of output of the product?...................................................3
QUESTION 2.............................................................................................................................4
Explain Cost plus pricing method and the problems associated with using this approach....4
QUESTION 3.............................................................................................................................4
Compute the following ratios for Fortune Trading................................................................4
CONCLUSION..........................................................................................................................5
REFERENCES...........................................................................................................................6
Document Page
INTRODUCTION
This paper ascertains the performance of the company, and furthermore the need of
appreciating the standards of cost-in addition to selling, the complexity of executing this
methodology in the firm, and the advantages of performing so (Sharavova and Sharavova,
2021). Aside from that, utilizing such measures to assess a functional efficiency and
dissolvability would help clients in making more astute decisions. Also, the level of output
which could help in leading the most profit will be found.
QUESTION 1
What is the most profitable level of output of the product?
Price Quantity
sold
Revenue Variable Costs (£ 20
per unit)
Fixed Cost Profit
100 0 0 0 2500 -2500
95 10 950 200 2500 -1750
90 20 1800 400 2500 -1100
85 30 2550 600 2500 -550
80 40 3200 800 2500 -100
75 50 3750 1000 2500 250
70 60 4200 1200 2500 500
65 70 4500 1400 2500 600
60 80 4800 1600 2500 700
55 90 4950 1800 2500 650
50 100 5000 2000 2500 500
From the above table, by comparing the quantities sold on each price by a maximum
selling of 100 units in a week. The above table has computed revenue, variable and fixed cost
at every price and quantity that will be sold in a total in a week. From, this the profit was
computed for all the quantities which are sold every week. According to this, and as per the
above asserted table, it can be said that the company UK tools is generating maximum profit
at £ 60 by selling 80 quantities per week. The profit that is generated is £ 700 per week. This
is the maximum profitable level of output that is generated for the organisation UK tools.
QUESTION 2
Explain Cost plus pricing method and the problems associated with using this approach.
Document Page
A strategy wherein a firm assesses the cost of a thing to the business and afterward
incorporates an extent to the worth to gauge the business charge to the shopper is known as
cost-in addition to promoting. To work out the business expenses and benefits, an extent is
applied to the total worth. This information is basic for laying out solid cost projections,
particularly for exercises and single-purchaser things which were previously made for
explicit clients. This approach is unsatisfactory for deciding the worth of an item which
would be showcased in a contending market structure since it neglects rival costs (Quaglia
and Spendzharova, 2022).
The following are among the problems that can emerge while utilizing this strategy:
It misses business procedure, which is the most genuine blemish. It likewise neglected
to assess business reasonability. An expense is regularly resolved whether or not or
not a specific client would consider the products to be fabulous venture right now.
Estimating fracture is obliged by the need, and the ability to an incentive for
unmistakable gatherings of the business is seriously restricted. Fixing charges relying
upon how client needs things can help you acquire client ground. As a result,
development is limited, and thing creativity and peculiarity feel the outcomes
QUESTION 3
Compute the following ratios for Fortune Trading.
a) Current Ratio = Current Assets / Current liabilities
= 40000 / 28000
= 1.43: 1
Interpretation: In respects of fortune trading, an ongoing proportion of 1.4 is what is
going on in worries of credit control. A more prominent current proportion is smarter
to something like a diminished current proportion since it demonstrates that the
business could fulfil its ongoing getting responsibilities all the more without any
problem (Li, 2019). The partnership's ongoing proportion fundamentally ascended as
a result, showing recommending it could meet its more limited run responsibilities.
b) Quick Ratio = (Current Assets – stock) / Current Liabilities)
= 28000 / 28000
= 1: 1
tabler-icon-diamond-filled.svg

Secure Best Marks with AI Grader

Need help grading? Try our AI Grader for instant feedback on your assignments.
Document Page
Interpretation: The extent in Fortune Trading is 1 that is a positive marker for the
organization. This infers the partnership will not need to exchange longer run assets to settle
down its current commitments (Rachlin, 2019).
c) Debt – equity ratio = Debt / equity
= 32000 / 40000
= 0.8 Times
Interpretation: The extent for Fortune Trading is 1 that is certainly not a decent
marker for the business. It demonstrates that the partnership is reimbursing its
commitment with its own assets and is a higher instability contributing. At the point
when an organization's extent is under 1, the organization is far lesser unsound when
contrasted with when it is multiple.
d) Proprietary Ratio = Shareholders fund / Total Assets
= 48000 / 120000 * 100
= 40 %
Interpretation: Fortune Trading has an obligation to-value edge of 0.5 that isn't ideal
given the company's dependence on acquiring for its exercises. As an outcome, a
more prominent rate implies the arrangement is more steady and moneylenders are
enough upheld (Fragouli, 2022).
CONCLUSION
As per the abovementioned study, an organization's comprehensive assets should be
managed effectively in a sequence for it to succeed in its operations. The firm is debating cost
plus marketing, its benefits, and the challenges it produces in the marketplace. In addition, the
topic of computing ratios such as the current ratio, quick ratio, proprietary ratio, and debt
equity ratio has been explored.
Document Page
REFERENCES
Books and Journals
Fragouli, E., 2022. MANAGING LOCAL RESOURCES & CHALLENGES FOR
INTERNATIONAL COMPANIES. International Journal of Information, Business
and Management, 14(1), pp.103-127.
Li, Y. ed., 2019. Managing Financial Risks Amid China's Economic Slowdown. Springer.
Quaglia, L. and Spendzharova, A., 2022. Regime complexity and managing financial data
streams: The orchestration of trade reporting for derivatives. Regulation &
Governance, 16(2), pp.588-602.
Rachlin, R., 2019. Return on investment manual: Tools and applications for managing
financial results. Routledge.
Sharavova, O.I. and Sharavova, M.M., 2021, September. Features of Evaluating and
Managing the Resources of Mobile Virtual Network Operators of Digital
Ecosystems. In 2021 International Conference on Quality Management, Transport
and Information Security, Information Technologies (IT&QM&IS) (pp. 900-902).
IEEE.
chevron_up_icon
1 out of 6
circle_padding
hide_on_mobile
zoom_out_icon
logo.png

Your All-in-One AI-Powered Toolkit for Academic Success.

Available 24*7 on WhatsApp / Email

[object Object]