Financial Resource Management and Decision Report - BTEC HND
VerifiedAdded on 2020/02/24
|19
|4913
|36
Report
AI Summary
This report, prepared for a Pearson BTEC Level 5 HND Diploma in Business, delves into the intricacies of financial resource management and decision-making. It begins by exploring various sources of finance, both short-term and long-term, and emphasizes the importance of financial planning. The report evaluates the costs associated with different financial sources and their impact on financial statements, also addressing the information needs of stakeholders. Part 2 focuses on capital appraisal techniques, including net present value (NPV) and payback periods, and provides a recommendation for Aston Ltd. The final section examines financial statements, including their formats and the calculation and interpretation of financial ratios. The report utilizes tables and figures to illustrate key concepts and concludes with a discussion of the implications of the analysis. The report covers topics such as the cost of capital, debt vs. equity financing, and the role of financial information in decision-making. It provides a comprehensive overview of financial management principles and their application in a business context.

Pearson BTEC Level 5
HND Diploma in Business
Managing financial resources and
decisions
HND Diploma in Business
Managing financial resources and
decisions
Paraphrase This Document
Need a fresh take? Get an instant paraphrase of this document with our AI Paraphraser
TABLE OF CONTENTS
Introduction................................................................................................................................3
Part 1..........................................................................................................................................3
A. Potential sources of finance available to business and importance of financial planning 3
B. Evaluation of short term and long term sources of finance...............................................4
C. Analysis of cost associated with different financial sources and its impact on financial
statements...............................................................................................................................5
D. Information needs of stakeholders....................................................................................6
Part 2..........................................................................................................................................6
A. Net value and net present value.........................................................................................6
B. Undiscounted Payback period and the Discounted Payback period.................................8
C. Recommendation to Aston Ltd..........................................................................................9
Part 3........................................................................................................................................10
A. The purpose of the two main financial statements..........................................................10
B. Different formats of financial statements........................................................................11
C. Calculation and interpretation of financial and liquidity ratios.......................................11
Liquidity ratios.....................................................................................................................12
Conclusion................................................................................................................................13
References................................................................................................................................14
LIST OF TABLES
Table 1: Statement showing calculation of financial ratios.....................................................13
Table 2: Profitability ratios of Tesco.......................................................................................14
Table 3: Liquidity ratios of Tesco............................................................................................15
Table 4: Gearing ratios of Tesco..............................................................................................16
LIST OF FIGURES
Figure 1: Profitability ratios of Tesco......................................................................................15
Figure 2: Liquidity ratios of Tesco...........................................................................................16
Figure 3: Gearing ratios of Tesco.............................................................................................17
⊘ This is a preview!⊘
Do you want full access?
Subscribe today to unlock all pages.
Trusted by 1+ million students worldwide
INTRODUCTION
Management of financial resources is the primary objective of business. Due to this
factor; it is essential to ensure funds are collected from viable sources and allocated in an
optimum manner to ensure maximum returns and profitability (Minsky, 2015). Thus present
study deals with the financial aspects of companies of listed in Hong Kong in order to assist
managerial authorities in making better decisions. For this aspect, various tools will be
applied in present study such as ratio analysis and methods of capital appraisal by considering
practical cases for a better understanding of subject matter.
PART 1
A. Potential sources of finance available to business and importance of financial planning
Sources of finance can be categorised into two primary categories from which businesses can
generate funds for their operational activities:
(i) Long-term finance -
The issue of share - Companies, can issue new shares to either existing
shareholder or to new shareholders in order to raise funds. For this financial
source; the company will be required to pay a dividend as per profitability of
business (Lee, Sameen and Cowling, 2015). Further; the principal amount is
not required to be repaid because shareholders are owners of the company
with the controlling authority.
Loan stock – It is used when companies require long-term capital fund but
also they want to hold their controlling power. For this company is required to
pay interest charges.
Bank lending – It is a most common form of lending money. Companies
borrow money from banks on long-term basis as per their requirement. For
this financial resources; assets are providing to the bank or financial
institution as security (Gitman, Juchau and Flanagan, 2015). To avail funding
from this financial sources, business is required to pay interest charges along
with the repayment of principal amounts as per provisions of their contractual
agreement.
(ii) Short term finance –
Cash credit – Banks allows the organization to withdraw funds up to the
specified limit. With this facility, a business can avail cash for short-term
Paraphrase This Document
Need a fresh take? Get an instant paraphrase of this document with our AI Paraphraser
requirements of business such as payment to creditors or purchase of raw
material to prevent liquidity crisis (Bodie, 2013). For this source, interest is
charged by bank
Overdraft – In this financial source; banks give facility to an account holder
to withdraw more amount from his account in excess of their balance. With
this facility, urgent payments can be made by business (Arcand, Berkes and
Panizza, 2015). Limit for excessive withdrawal is determined on the basis of
credibility of business and bank charges are deducted from the account
balance for this facility.
Trade credit: Business can purchase from suppliers on credit basis to manage
their working capital requirement and to prevent charges of interest of short-
term bank credits. In this financial source also limit of credit, the purchase is
determined on the basis of business (Manova, Wei and Zhang, 2015).
However, credit purchase is costly in comparison to cash purchases as cash
discounts cannot be availed, so comparison of discount and interest is essential
to select the suitable source.
Financial planning is important because it ensures the availability of funds whenever
firms required and also taken care of the strategies to utilize funds efficiently and effectively.
Further; organization arrange funds from various sources and for the different term, so
financial planning helps to ensure that funds are arranged in an appropriate capital structure.
In accordance with the viewpoint of Grinblatt and Titman (2016), business environment is
full of opportunities and shocks, so financial planning helps to evaluate various investment
proposals and make provision to face uncertain situations. Effective financial management
also assists in the satisfying working capital requirement of the company for their smooth
flow of operation. The organization has a various department of operation, so it is
necessary for every department to work in coordination. Financial planning helps the
organization in coordinating and analyses their present financial status for making policies.
B. Evaluation of short term and long term sources of finance
The organization needs funds to meet its daily working capital requirement and
various expansion projects (Tricker and Tricker, 2015). Some long-term finances are an
issue of a share, issue of the debenture, public deposits, retained earnings, a term loan from a
financial institution.
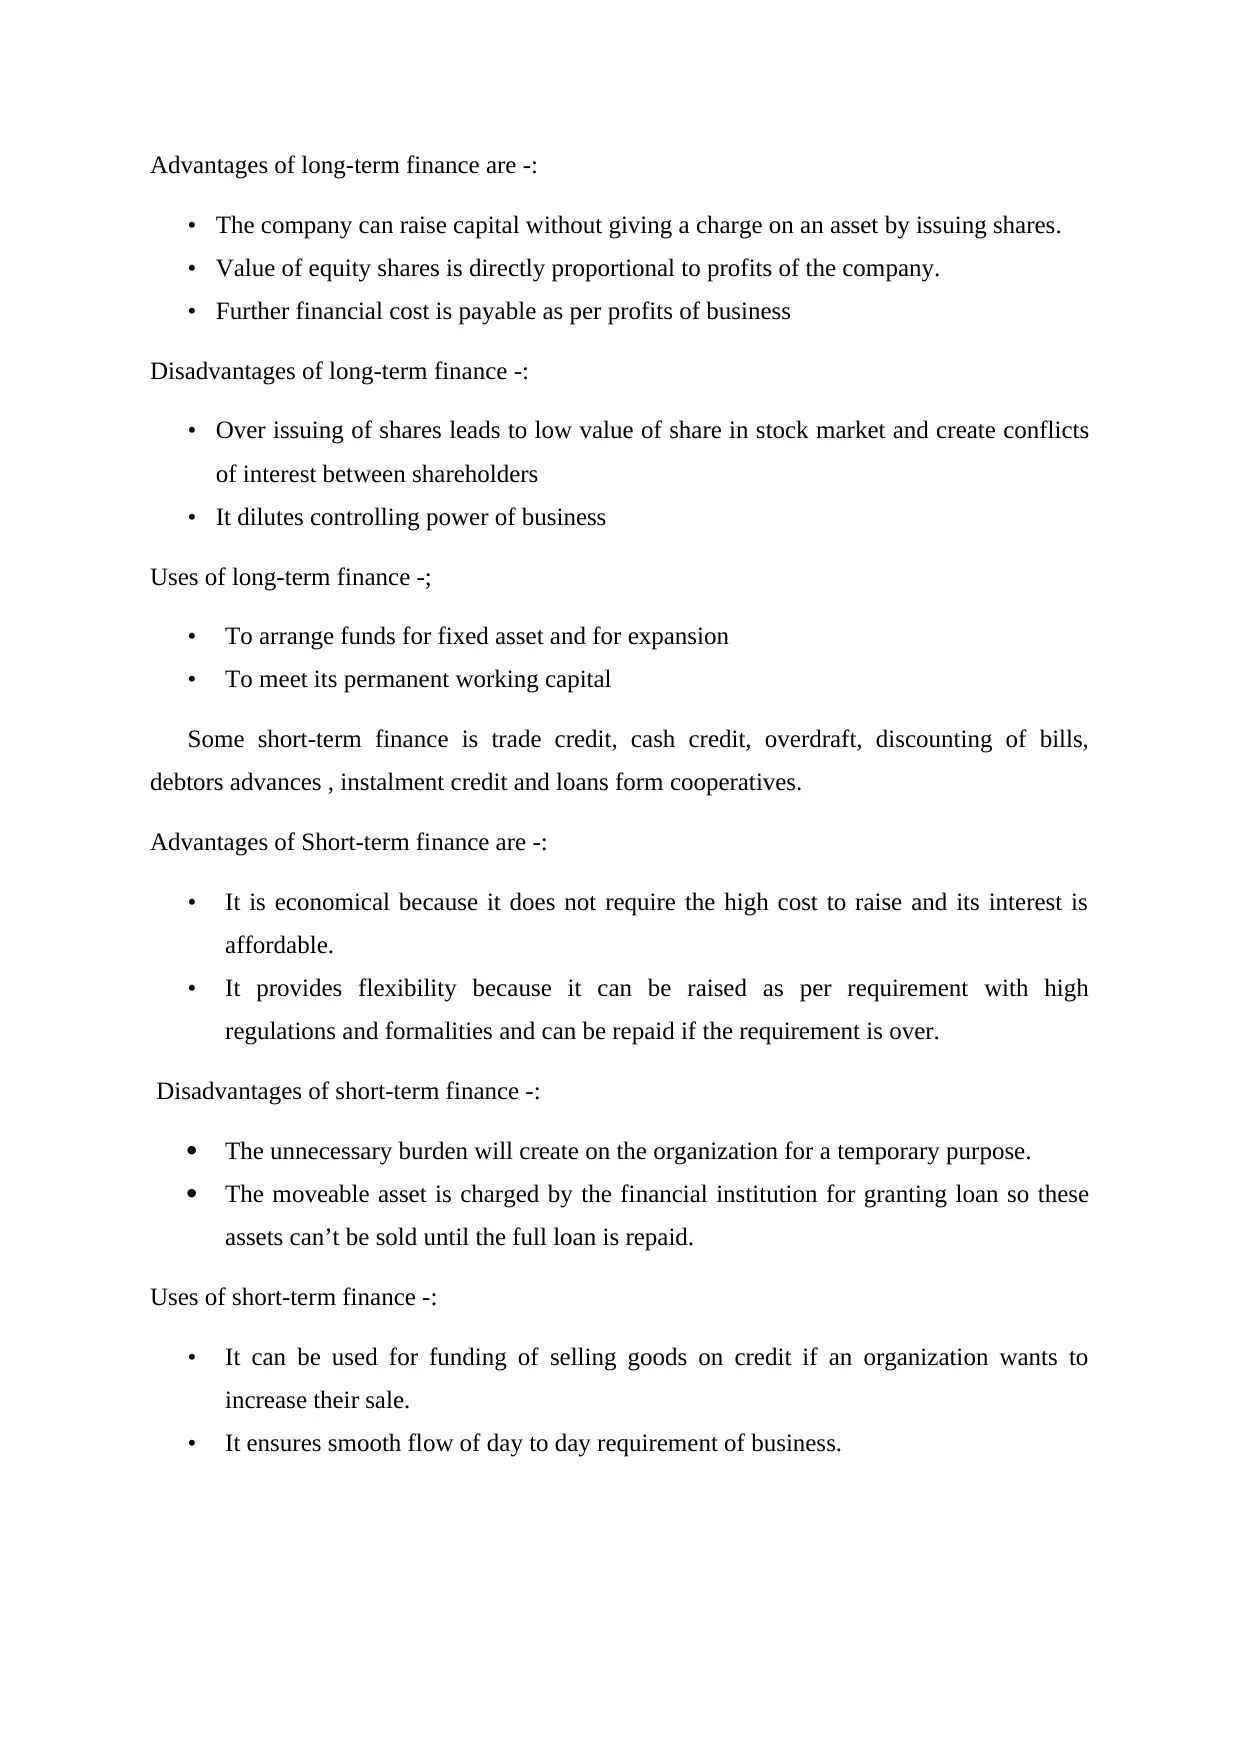
Advantages of long-term finance are -:
• The company can raise capital without giving a charge on an asset by issuing shares.
• Value of equity shares is directly proportional to profits of the company.
• Further financial cost is payable as per profits of business
Disadvantages of long-term finance -:
• Over issuing of shares leads to low value of share in stock market and create conflicts
of interest between shareholders
• It dilutes controlling power of business
Uses of long-term finance -;
• To arrange funds for fixed asset and for expansion
• To meet its permanent working capital
Some short-term finance is trade credit, cash credit, overdraft, discounting of bills,
debtors advances , instalment credit and loans form cooperatives.
Advantages of Short-term finance are -:
• It is economical because it does not require the high cost to raise and its interest is
affordable.
• It provides flexibility because it can be raised as per requirement with high
regulations and formalities and can be repaid if the requirement is over.
Disadvantages of short-term finance -:
The unnecessary burden will create on the organization for a temporary purpose.
The moveable asset is charged by the financial institution for granting loan so these
assets can’t be sold until the full loan is repaid.
Uses of short-term finance -:
• It can be used for funding of selling goods on credit if an organization wants to
increase their sale.
• It ensures smooth flow of day to day requirement of business.
⊘ This is a preview!⊘
Do you want full access?
Subscribe today to unlock all pages.
Trusted by 1+ million students worldwide
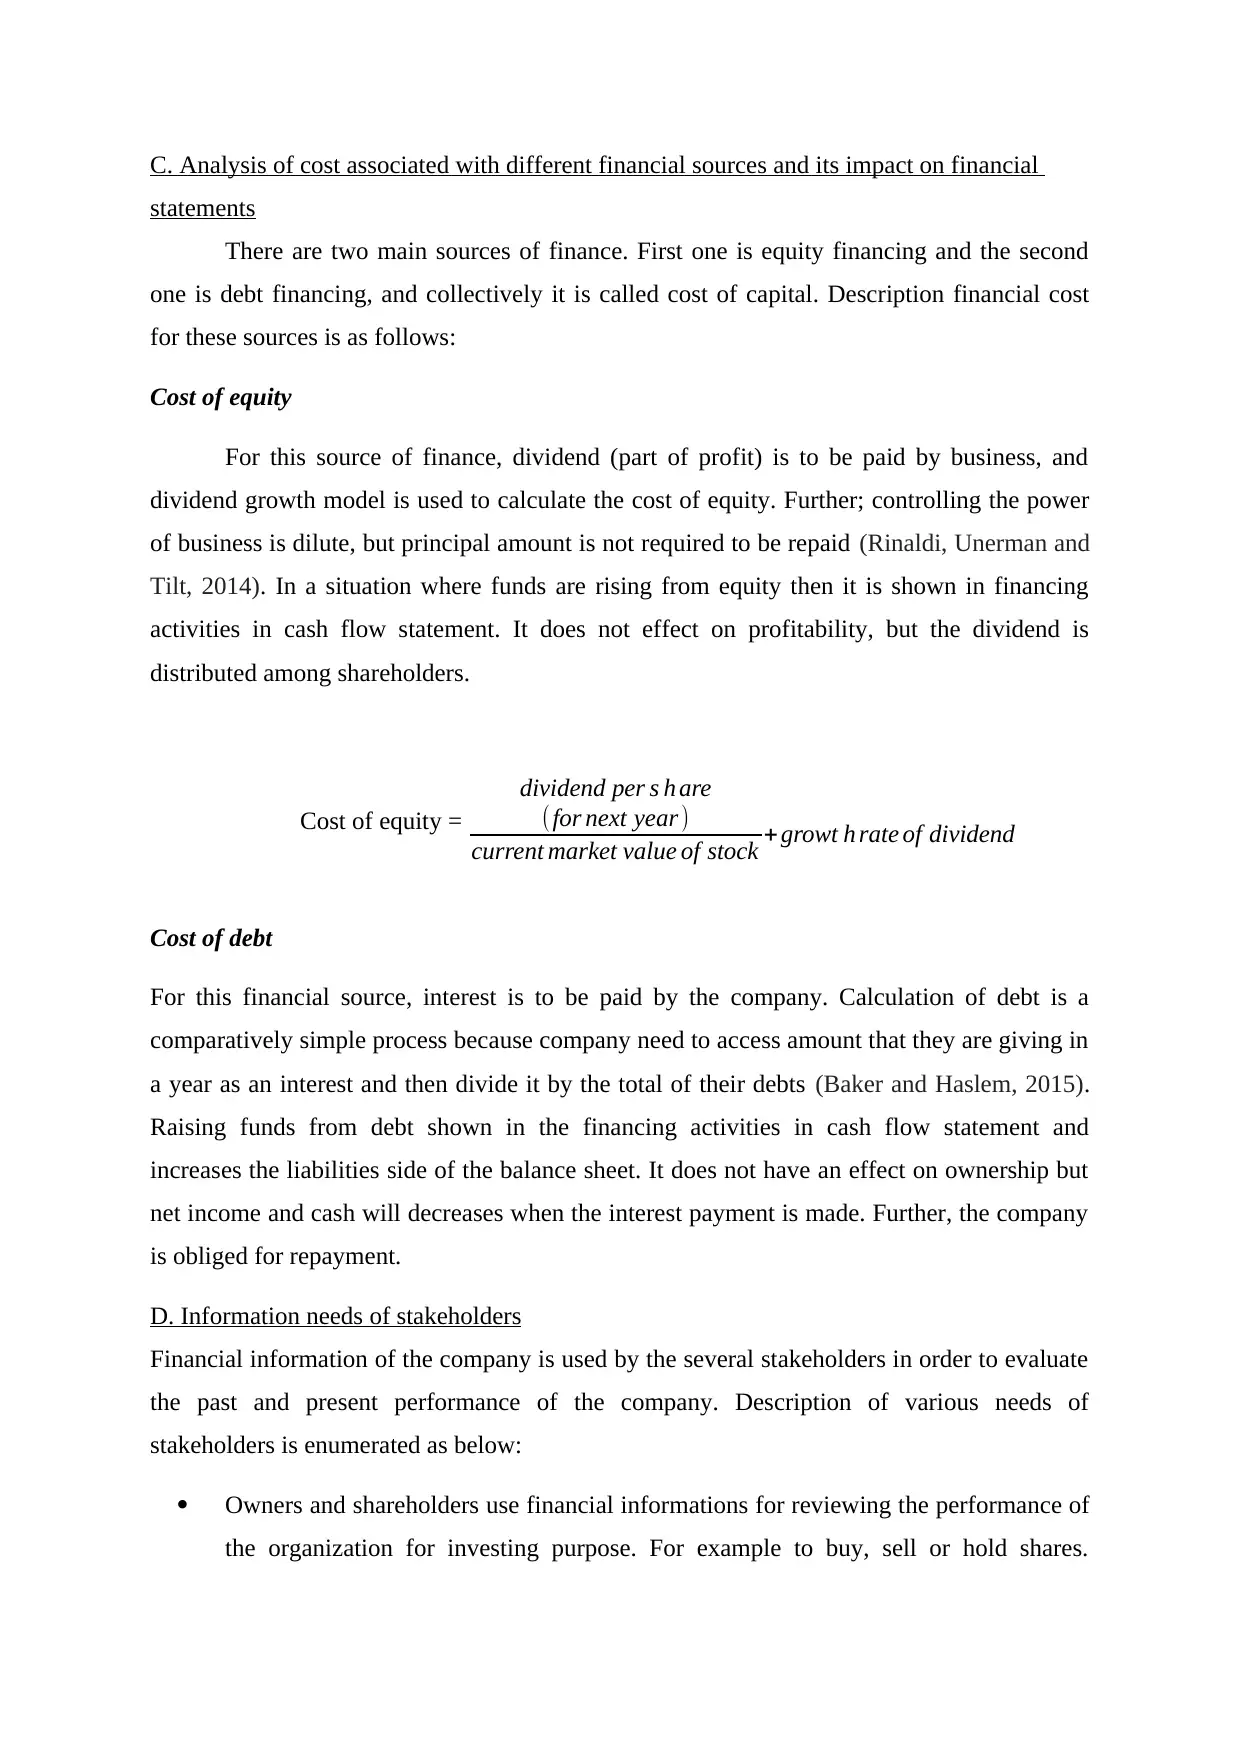
C. Analysis of cost associated with different financial sources and its impact on financial
statements
There are two main sources of finance. First one is equity financing and the second
one is debt financing, and collectively it is called cost of capital. Description financial cost
for these sources is as follows:
Cost of equity
For this source of finance, dividend (part of profit) is to be paid by business, and
dividend growth model is used to calculate the cost of equity. Further; controlling the power
of business is dilute, but principal amount is not required to be repaid (Rinaldi, Unerman and
Tilt, 2014). In a situation where funds are rising from equity then it is shown in financing
activities in cash flow statement. It does not effect on profitability, but the dividend is
distributed among shareholders.
Cost of equity =
dividend per s h are
(for next year )
current market value of stock + growt h rate of dividend
Cost of debt
For this financial source, interest is to be paid by the company. Calculation of debt is a
comparatively simple process because company need to access amount that they are giving in
a year as an interest and then divide it by the total of their debts (Baker and Haslem, 2015).
Raising funds from debt shown in the financing activities in cash flow statement and
increases the liabilities side of the balance sheet. It does not have an effect on ownership but
net income and cash will decreases when the interest payment is made. Further, the company
is obliged for repayment.
D. Information needs of stakeholders
Financial information of the company is used by the several stakeholders in order to evaluate
the past and present performance of the company. Description of various needs of
stakeholders is enumerated as below:
Owners and shareholders use financial informations for reviewing the performance of
the organization for investing purpose. For example to buy, sell or hold shares.
Paraphrase This Document
Need a fresh take? Get an instant paraphrase of this document with our AI Paraphraser
Investors compare more than 1 years of financial statement to know the growth rate of
the organization (Epstein, Buhovac and Yuthas, 2015). It helps them to take a
decision so it is the duty of companies to publish a financial statement in the annual
report for the shareholders.
The government uses financial statement for tax payable purpose and also for
evaluating the performance of the economy. It is compulsory for public listed
companies to file a financial statement to the appropriate authority. For example,
public listed companies in Hong Kong are mandatory to file their financial statement
to the Securities and Futures Commission (SFC).
Financial institution needs a financial statement to know to solvency and ability to
pay the interest amount as they become due (Gitman, Juchau and Flanagan, 2015).
Financial institution analyses various ratios like debt-equity ratio , market to book
ratio , enterprise value etc. for evaluating short-term and long-term credibility of the
company.
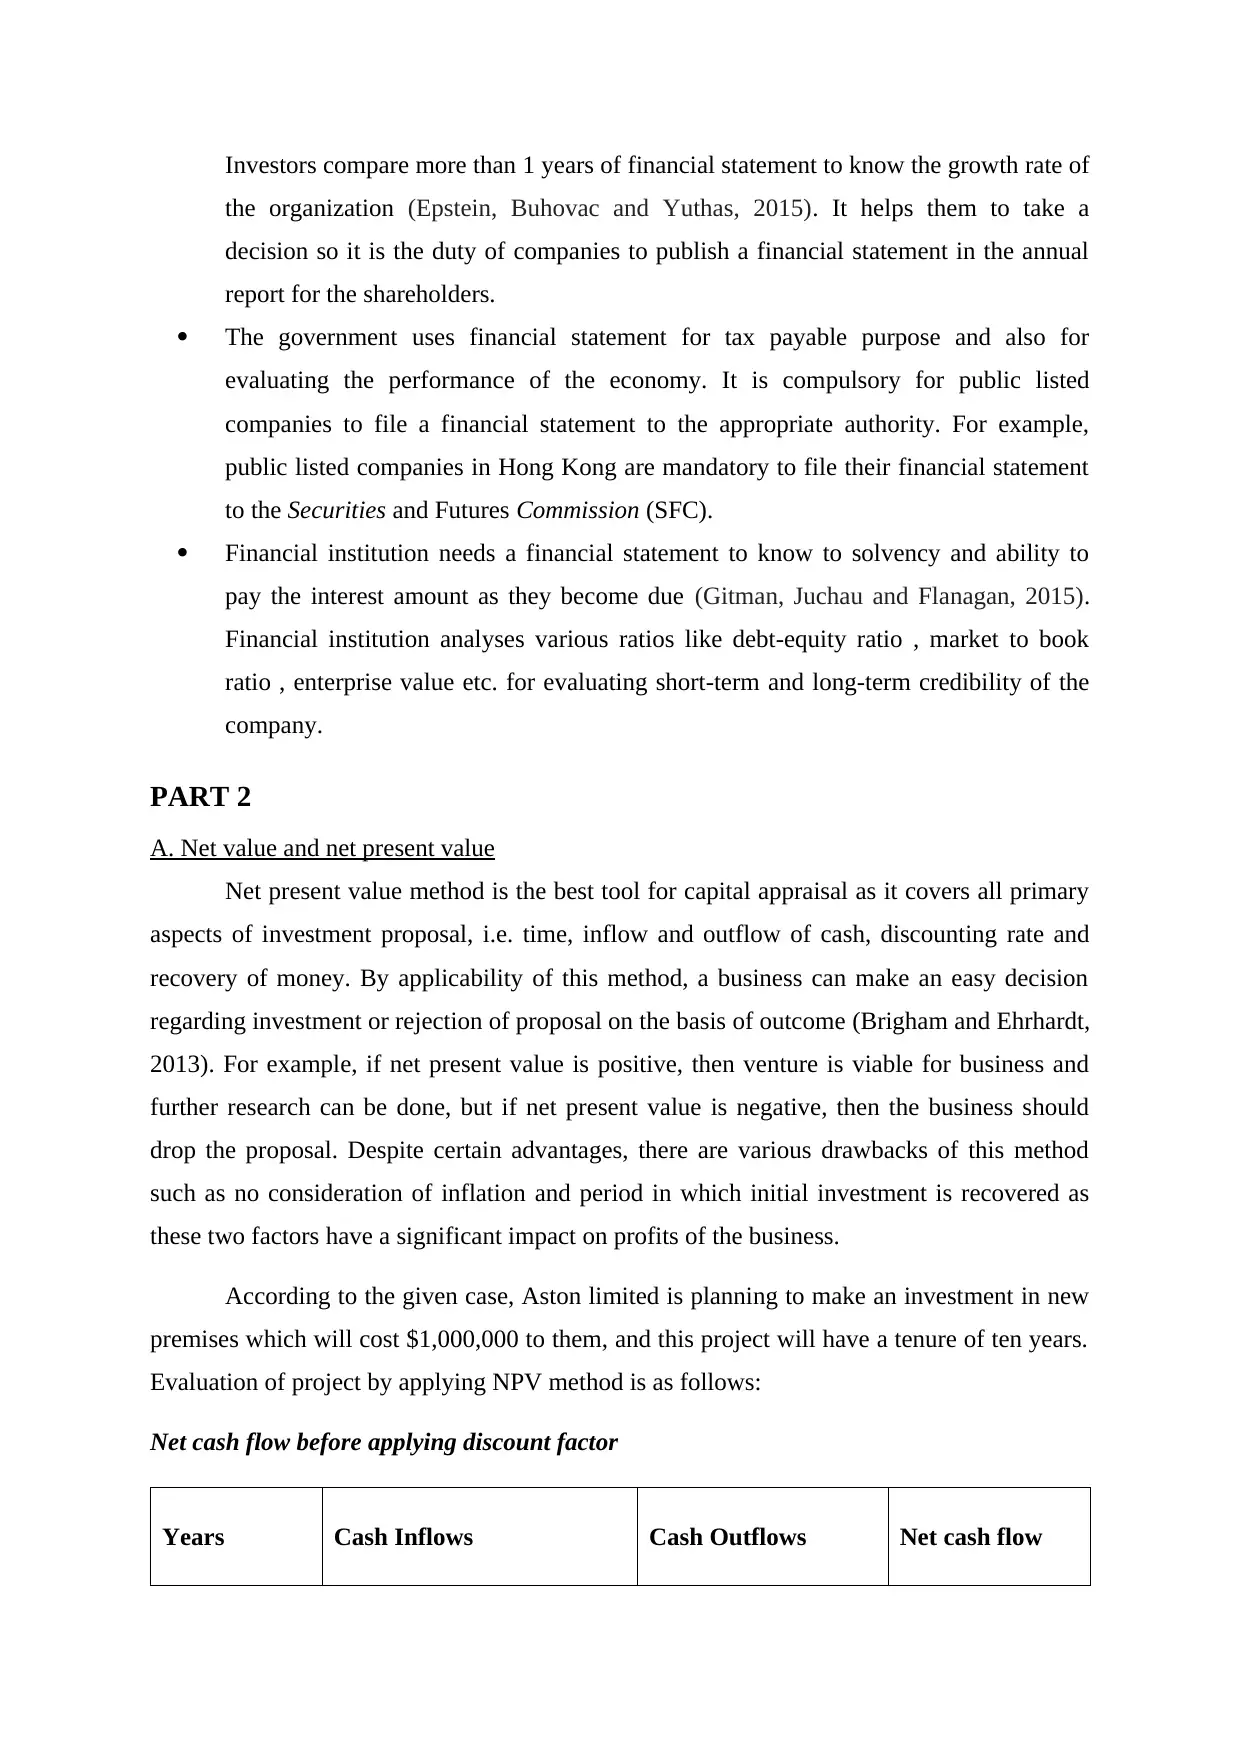
PART 2
A. Net value and net present value
Net present value method is the best tool for capital appraisal as it covers all primary
aspects of investment proposal, i.e. time, inflow and outflow of cash, discounting rate and
recovery of money. By applicability of this method, a business can make an easy decision
regarding investment or rejection of proposal on the basis of outcome (Brigham and Ehrhardt,
2013). For example, if net present value is positive, then venture is viable for business and
further research can be done, but if net present value is negative, then the business should
drop the proposal. Despite certain advantages, there are various drawbacks of this method
such as no consideration of inflation and period in which initial investment is recovered as
these two factors have a significant impact on profits of the business.
According to the given case, Aston limited is planning to make an investment in new
premises which will cost $1,000,000 to them, and this project will have a tenure of ten years.
Evaluation of project by applying NPV method is as follows:
Net cash flow before applying discount factor
Years Cash Inflows Cash Outflows Net cash flow
the organization (Epstein, Buhovac and Yuthas, 2015). It helps them to take a
decision so it is the duty of companies to publish a financial statement in the annual
report for the shareholders.
The government uses financial statement for tax payable purpose and also for
evaluating the performance of the economy. It is compulsory for public listed
companies to file a financial statement to the appropriate authority. For example,
public listed companies in Hong Kong are mandatory to file their financial statement
to the Securities and Futures Commission (SFC).
Financial institution needs a financial statement to know to solvency and ability to
pay the interest amount as they become due (Gitman, Juchau and Flanagan, 2015).
Financial institution analyses various ratios like debt-equity ratio , market to book
ratio , enterprise value etc. for evaluating short-term and long-term credibility of the
company.
PART 2
A. Net value and net present value
Net present value method is the best tool for capital appraisal as it covers all primary
aspects of investment proposal, i.e. time, inflow and outflow of cash, discounting rate and
recovery of money. By applicability of this method, a business can make an easy decision
regarding investment or rejection of proposal on the basis of outcome (Brigham and Ehrhardt,
2013). For example, if net present value is positive, then venture is viable for business and
further research can be done, but if net present value is negative, then the business should
drop the proposal. Despite certain advantages, there are various drawbacks of this method
such as no consideration of inflation and period in which initial investment is recovered as
these two factors have a significant impact on profits of the business.
According to the given case, Aston limited is planning to make an investment in new
premises which will cost $1,000,000 to them, and this project will have a tenure of ten years.
Evaluation of project by applying NPV method is as follows:
Net cash flow before applying discount factor
Years Cash Inflows Cash Outflows Net cash flow
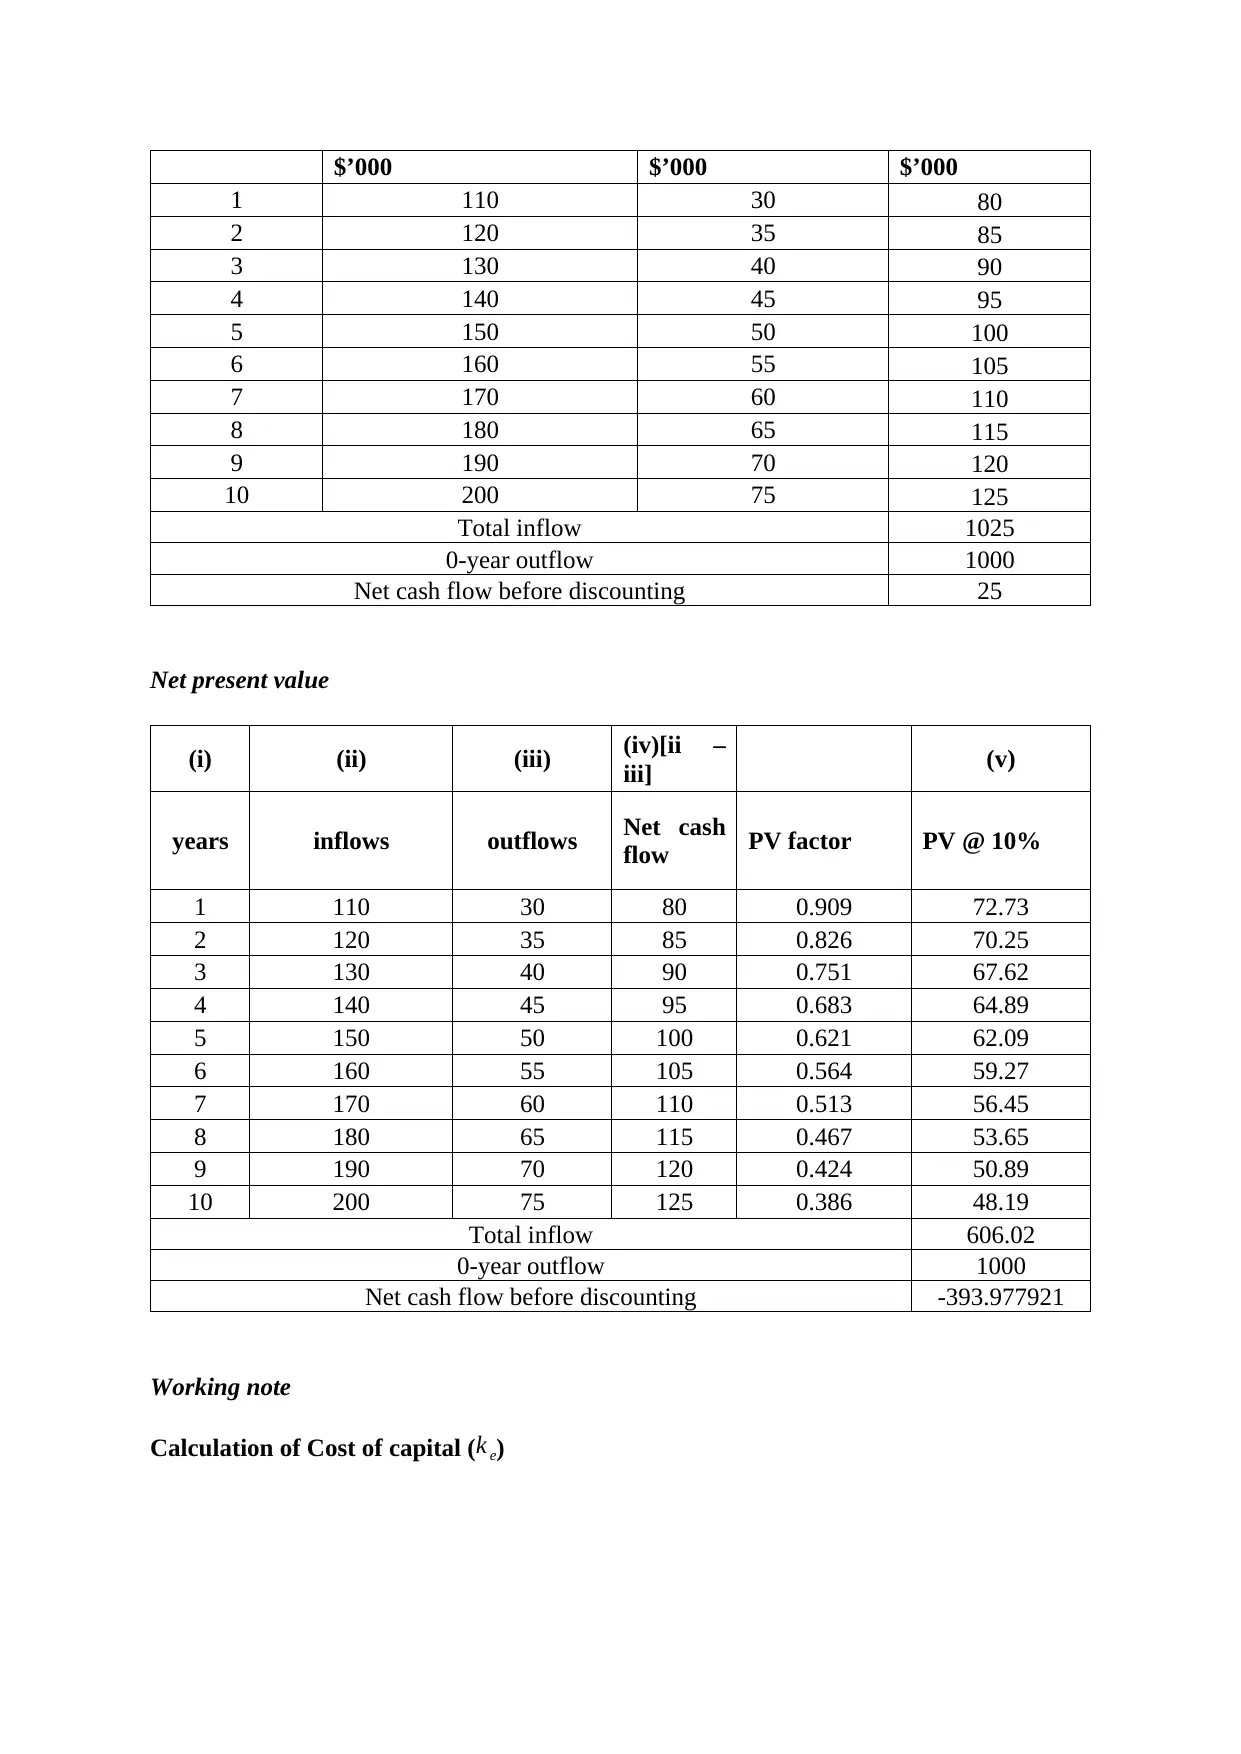
$’000 $’000 $’000
1 110 30 80
2 120 35 85
3 130 40 90
4 140 45 95
5 150 50 100
6 160 55 105
7 170 60 110
8 180 65 115
9 190 70 120
10 200 75 125
Total inflow 1025
0-year outflow 1000
Net cash flow before discounting 25
Net present value
(i) (ii) (iii) (iv)[ii –
iii] (v)
years inflows outflows Net cash
flow PV factor PV @ 10%
1 110 30 80 0.909 72.73
2 120 35 85 0.826 70.25
3 130 40 90 0.751 67.62
4 140 45 95 0.683 64.89
5 150 50 100 0.621 62.09
6 160 55 105 0.564 59.27
7 170 60 110 0.513 56.45
8 180 65 115 0.467 53.65
9 190 70 120 0.424 50.89
10 200 75 125 0.386 48.19
Total inflow 606.02
0-year outflow 1000
Net cash flow before discounting -393.977921
Working note
Calculation of Cost of capital ( k e)
⊘ This is a preview!⊘
Do you want full access?
Subscribe today to unlock all pages.
Trusted by 1+ million students worldwide

= 8∗5
10 + 12∗5
10
= 10%
As per provided information project would be funded by $500,000 equity having the
cost of 8%, and $500,000 of debt having the cost of 12% thus the net cost of capital is
computed by making use of weighted average cost of capital.
B. Undiscounted Payback period and the Discounted Payback period
In this method of capital appraisal, the decision of investment is made by considering
time period in which initial investment will be recovered (Agarwal and et al., 2015). In this
approach, if the project provides initial investment prior to completion of tenure then it is said
to be profitable however post payback period must be sufficient as desired profit standards of
business.
Calculation of undiscounted payback period
Years Cash Flow Cumulative cash flow
0 (1000) (1000)
1 80 (920)
2 85 (835)
3 90 (745)
4 95 (650)
5 100 (550)
6 105 (445)
7 110 (335)
8 115 (220)
9 120 (100)
10 125 25
Payback period = 9+ 100
125
= 9.8 years
Paraphrase This Document
Need a fresh take? Get an instant paraphrase of this document with our AI Paraphraser
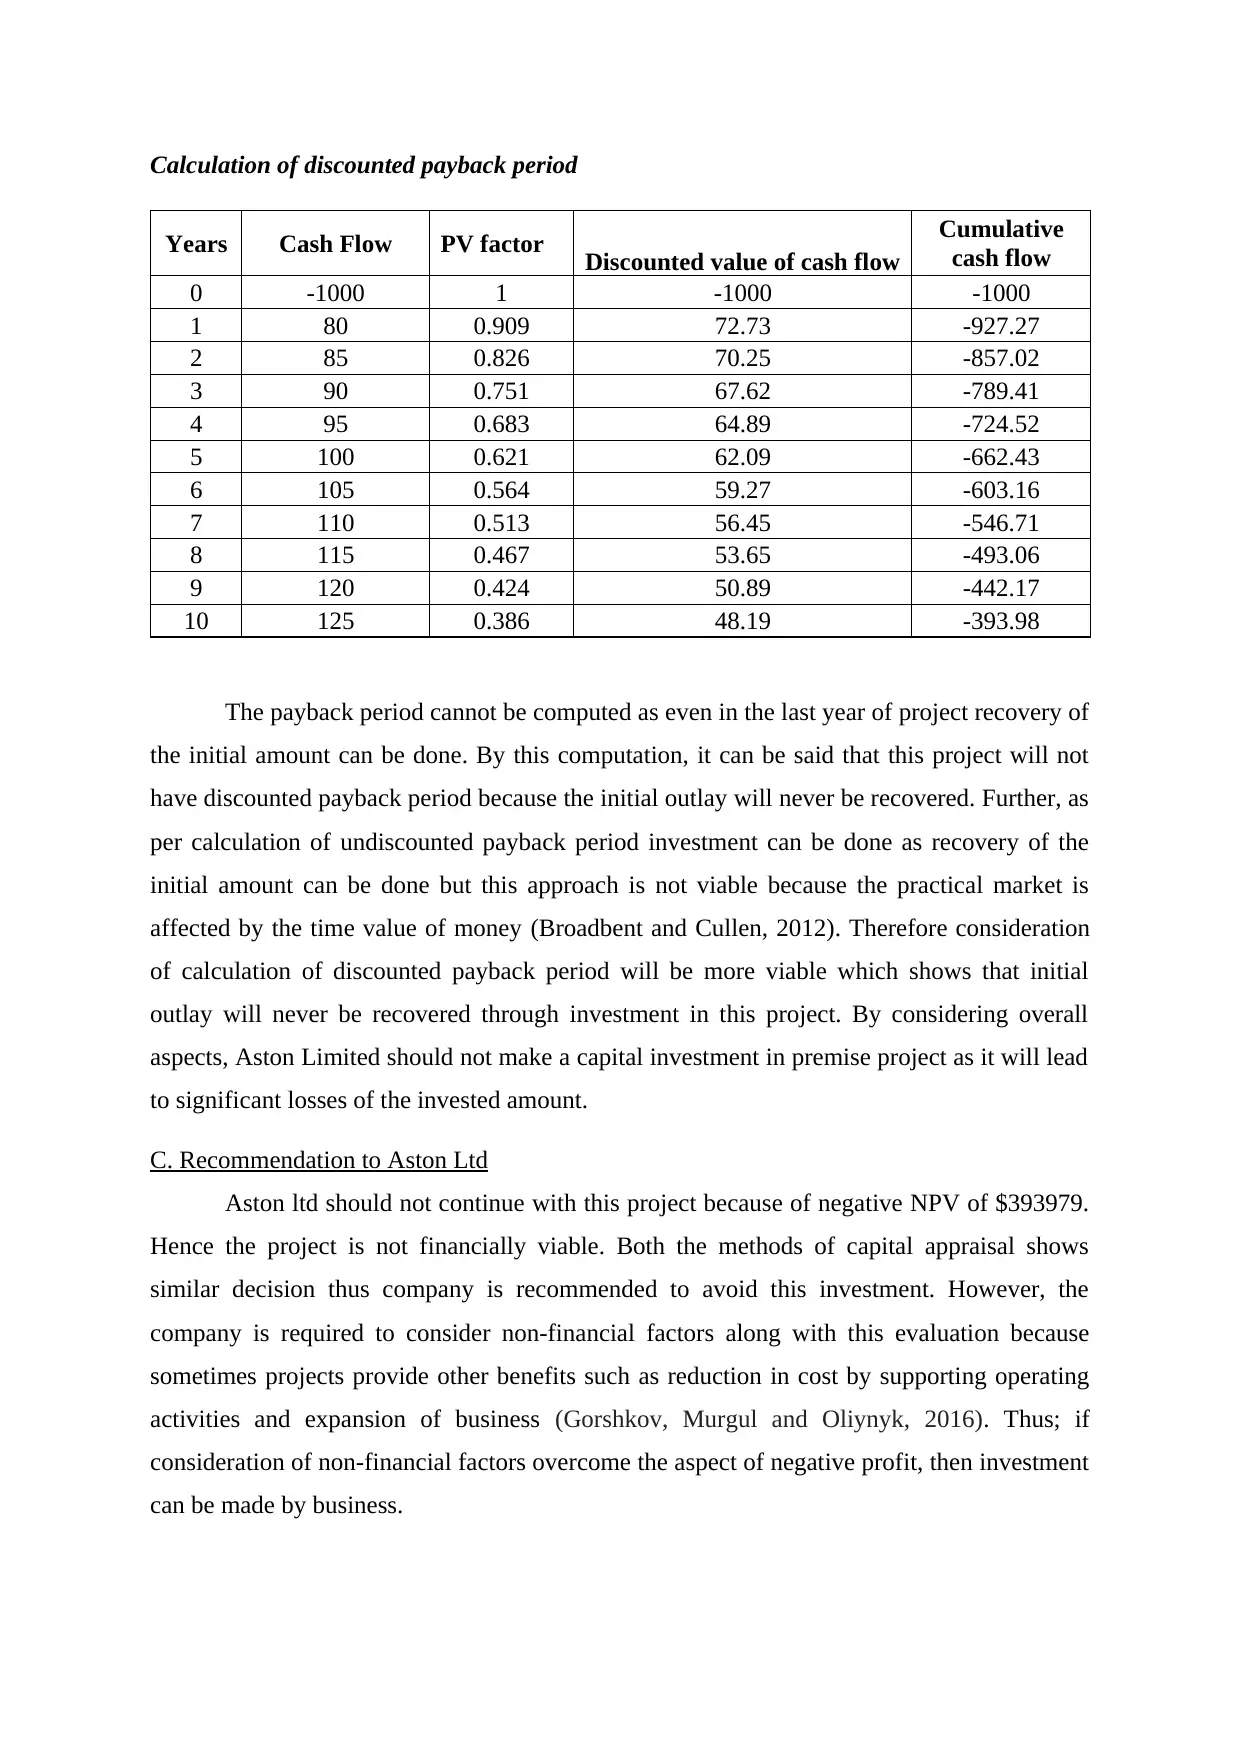
Calculation of discounted payback period
Years Cash Flow PV factor Discounted value of cash flow
Cumulative
cash flow
0 -1000 1 -1000 -1000
1 80 0.909 72.73 -927.27
2 85 0.826 70.25 -857.02
3 90 0.751 67.62 -789.41
4 95 0.683 64.89 -724.52
5 100 0.621 62.09 -662.43
6 105 0.564 59.27 -603.16
7 110 0.513 56.45 -546.71
8 115 0.467 53.65 -493.06
9 120 0.424 50.89 -442.17
10 125 0.386 48.19 -393.98
The payback period cannot be computed as even in the last year of project recovery of
the initial amount can be done. By this computation, it can be said that this project will not
have discounted payback period because the initial outlay will never be recovered. Further, as
per calculation of undiscounted payback period investment can be done as recovery of the
initial amount can be done but this approach is not viable because the practical market is
affected by the time value of money (Broadbent and Cullen, 2012). Therefore consideration
of calculation of discounted payback period will be more viable which shows that initial
outlay will never be recovered through investment in this project. By considering overall
aspects, Aston Limited should not make a capital investment in premise project as it will lead
to significant losses of the invested amount.
C. Recommendation to Aston Ltd
Aston ltd should not continue with this project because of negative NPV of $393979.
Hence the project is not financially viable. Both the methods of capital appraisal shows
similar decision thus company is recommended to avoid this investment. However, the
company is required to consider non-financial factors along with this evaluation because
sometimes projects provide other benefits such as reduction in cost by supporting operating
activities and expansion of business (Gorshkov, Murgul and Oliynyk, 2016). Thus; if
consideration of non-financial factors overcome the aspect of negative profit, then investment
can be made by business.
PART 3
A. The purpose of the two main financial statements
The major aim of financial statement is to offer data and information regarding
operational results, company’s financial position and its cash flows of an organization. Users
use this of financial statements in order to make better decisions about the resource allocation
(Dani, Ismail and Kamarudin, 2013). At the best level, there is the existence of different
purpose linked with each financial statement and is mentioned as below:
Purpose of income statement
Income statement major purpose is to reveal the user how much income and loss
Tesco incurred during an accounting period. This information is more reliable yet valuable if
income statement from various consecutive periods is mixed all together, so the trends from
different revenue and expense can be noticed.
The income statement is inclusive of various subtotals which assist in identifying how
loss and profits were incurred. The gross income is attained by reducing trading expenses
from sales and the costs of products being sold together, further it provides a gauge on the
capability of a firm on price setting points acceptable by customers and to retain the product
and services that it offers (Healy and Palepu, 2012). Another key factor is the operating profit
subtotal, that is (gross profit-operating expenses) like selling and managerial expenses. The
total shows the firm’s capability in generating profits before the impact of financing activities
are factored into the figure of final profit.
The aim of income statement might vary to some extent; it all depends on the user.
From the point of investor, that only wasn’t profit stability that will prove the reliability of
business. The interest of lender is to earn adequate amount of profit to pay out for interest
expenditures and a return of the allowed amount of loan.
Purpose of balance sheet
The balance sheet can also be known as the statement of financial position. It is
among the main statements of finance as it records an enterprise’s assets and liabilities and
their variation in the subtotal. The amounts have been reported on the balance sheet are the
amounts on the last date of the financial year.
⊘ This is a preview!⊘
Do you want full access?
Subscribe today to unlock all pages.
Trusted by 1+ million students worldwide
1 out of 19
Related Documents


Your All-in-One AI-Powered Toolkit for Academic Success.
+13062052269
info@desklib.com
Available 24*7 on WhatsApp / Email
![[object Object]](/_next/static/media/star-bottom.7253800d.svg)
Unlock your academic potential
Copyright © 2020–2026 A2Z Services. All Rights Reserved. Developed and managed by ZUCOL.