Report on Financial Resource Management: Cost, Volume, and Cash Flow

Verified

Added on  2020/12/30

|11
|2159
|380
Report
AI Summary
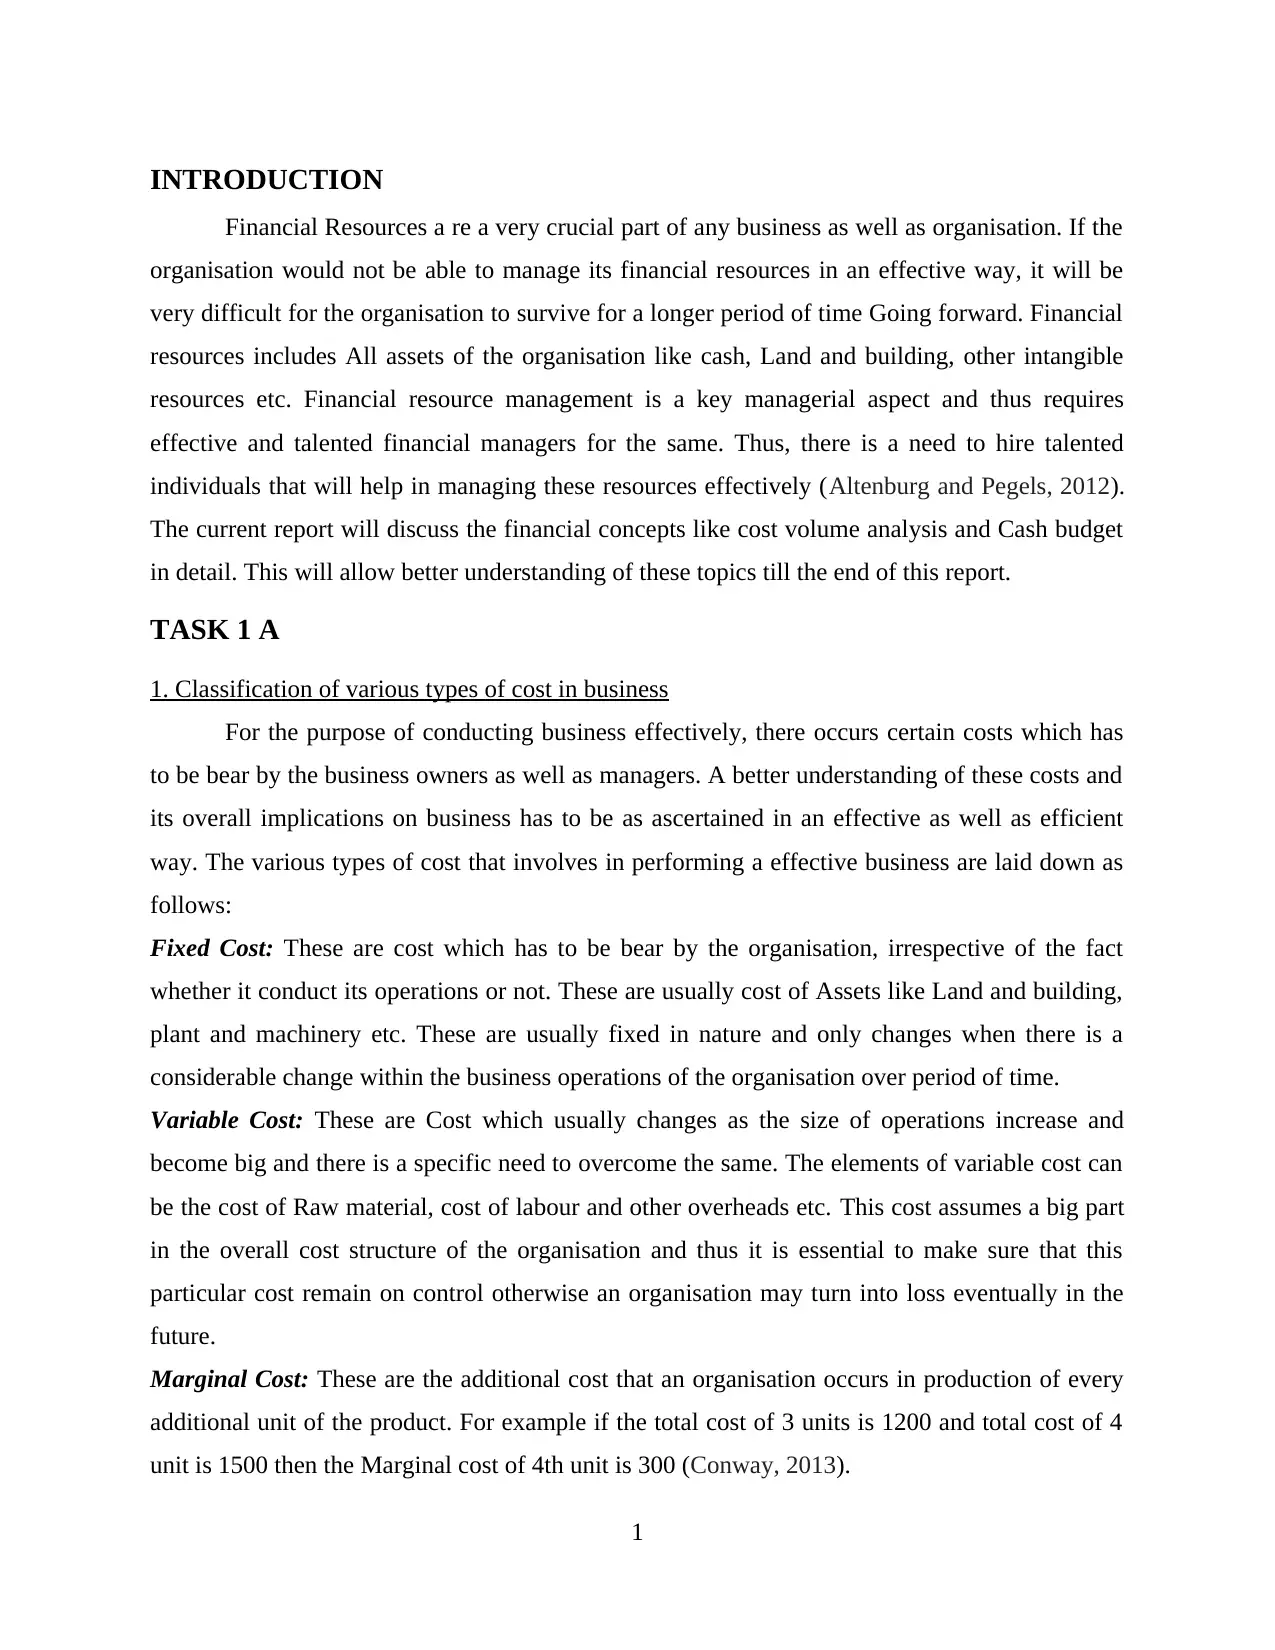
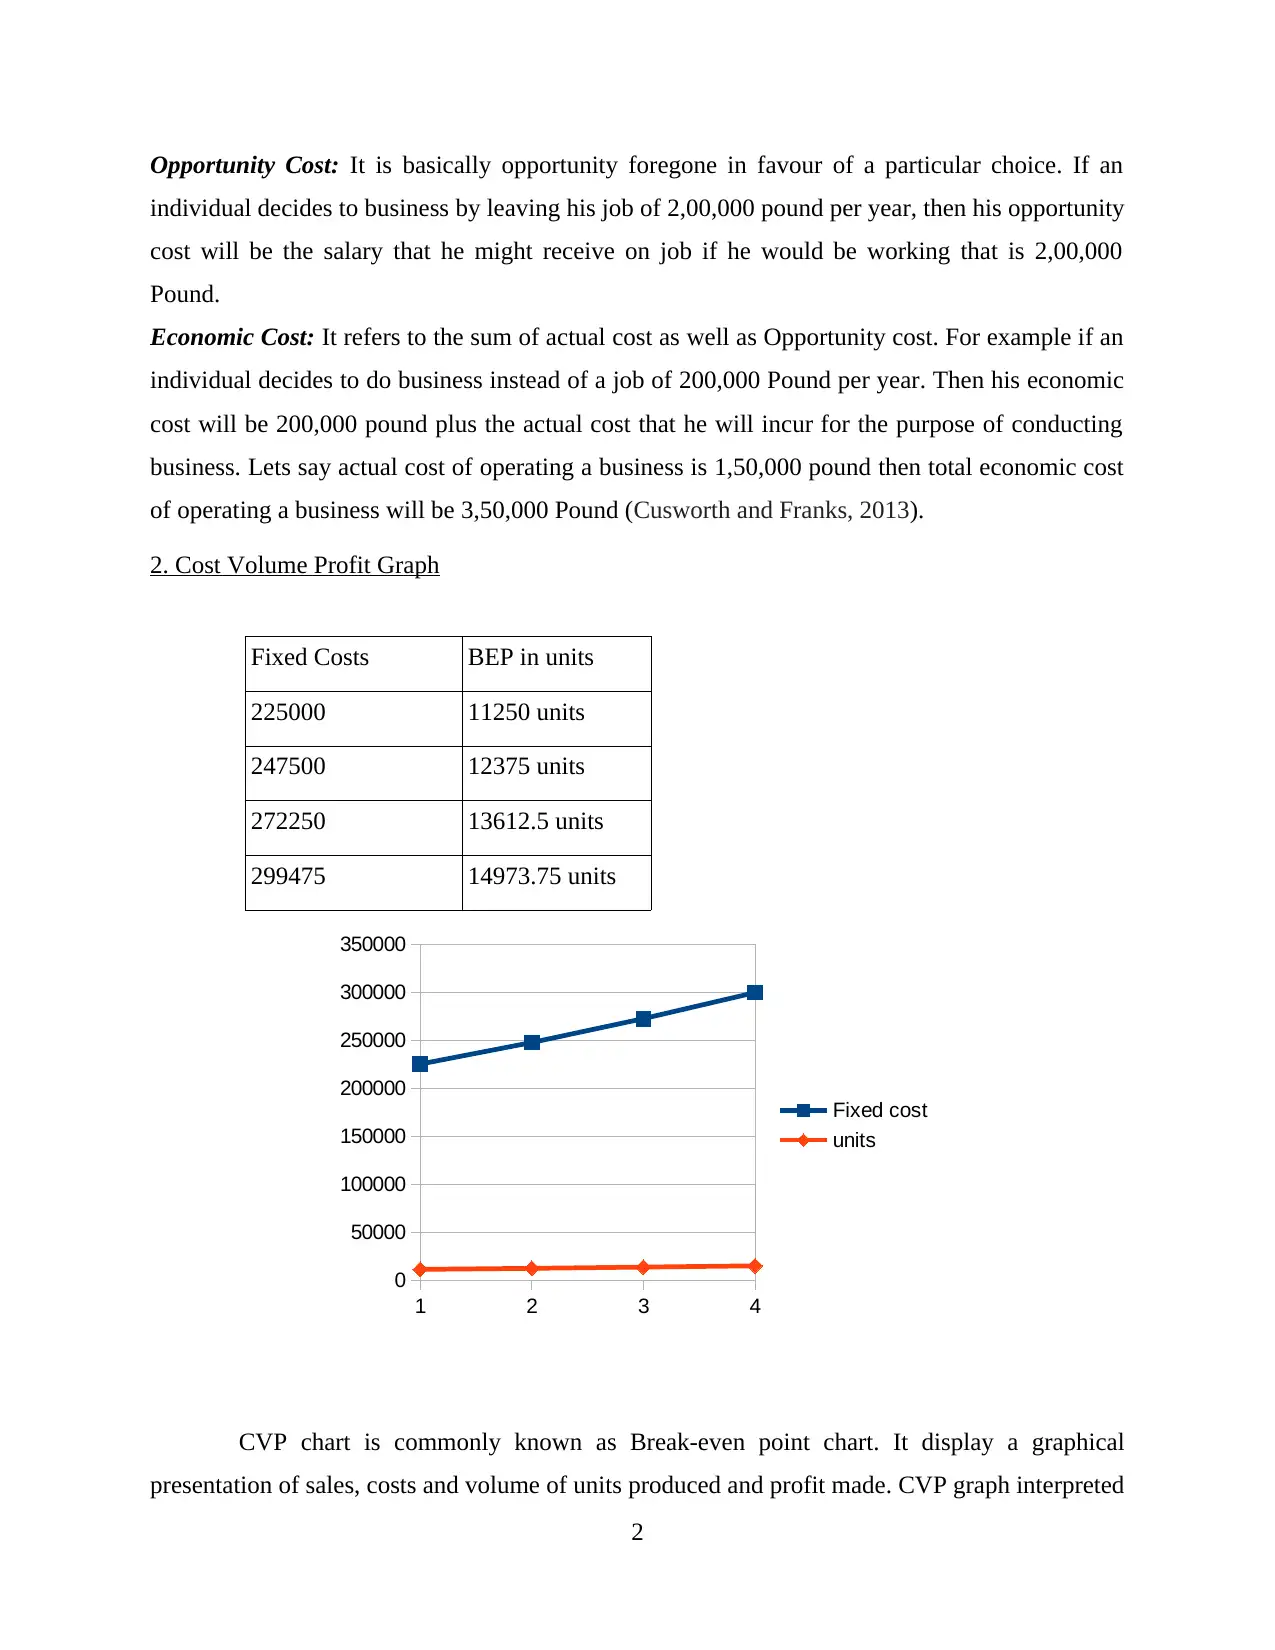
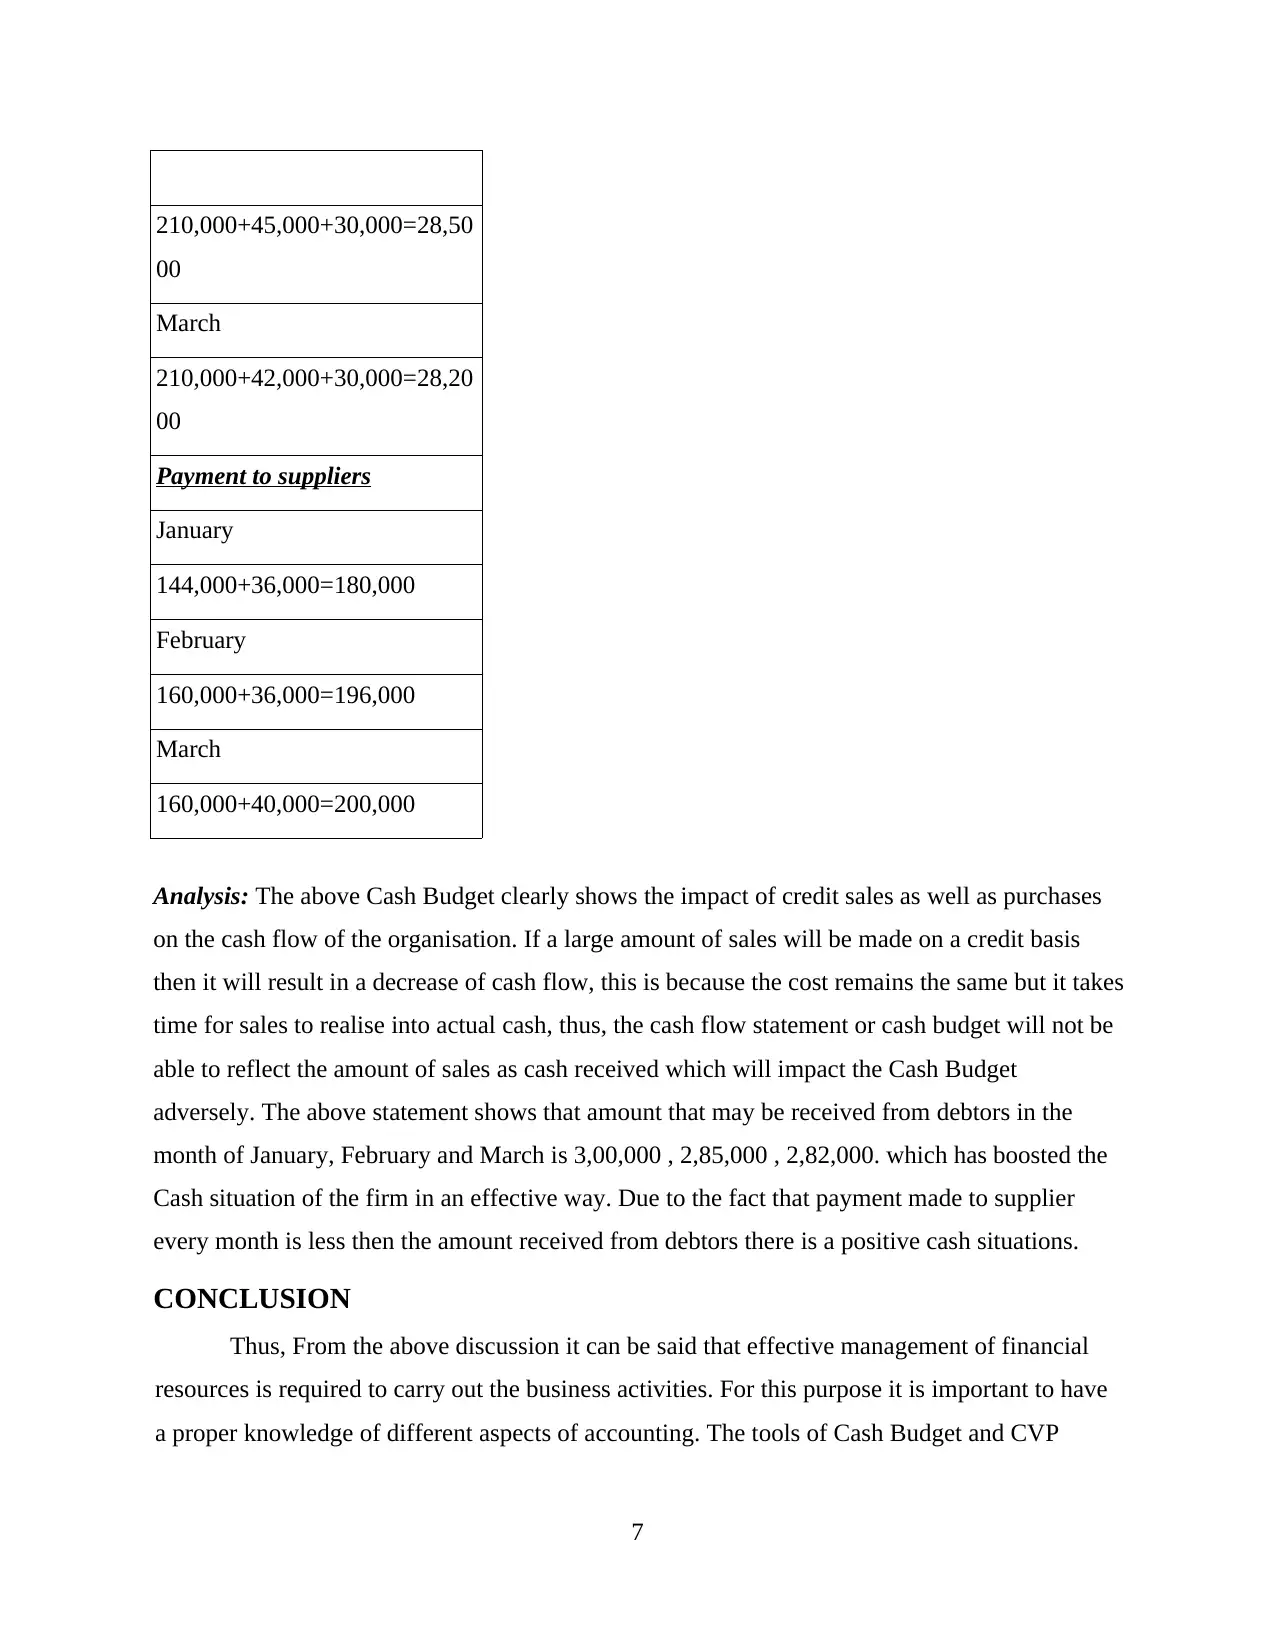
This report provides a comprehensive analysis of financial resource management, focusing on key concepts such as cost classification, cost-volume-profit (CVP) analysis, and cash budgeting. It begins by categorizing various types of costs in business, including fixed, variable, marginal, opportunity, and economic costs. The report then delves into CVP analysis, explaining the components of a CVP graph and calculating the break-even point in units and pound sterling. It also includes calculations for net operating income and explores the impact of changes in variable costs on the break-even point. Furthermore, the report examines cash budgeting, defining the concept and its importance, and illustrating its application through a detailed cash budget example. The analysis includes the impact of credit sales and purchases on cash flow, providing a practical understanding of financial management principles. The report concludes by emphasizing the importance of effective financial resource management for business sustainability and growth.
Document Page
Managing Financial
Resources
tabler-icon-diamond-filled.svg

Paraphrase This Document

Need a fresh take? Get an instant paraphrase of this document with our AI Paraphraser
Document Page
Table of Contents
INTRODUCTION...........................................................................................................................1
TASK 1 A........................................................................................................................................1
1. Classification of various types of cost in business..................................................................1
2. Cost Volume Profit Graph......................................................................................................2
TASK 1B.........................................................................................................................................3
1. Calculation of BEP in units as well as in pound sterling........................................................3
2.CVP graph showing Break-even point on the chart.................................................................4
3.Calculation of Net Operating Income......................................................................................4
4.Calculation of revised BEP .....................................................................................................4
5. Revised Net Operating Income or Loss..................................................................................5
6. Break-even point of company.................................................................................................5
TASK 2 ........................................................................................................................................5
Cash budget.................................................................................................................................5
CONCLUSION................................................................................................................................7
REFERENCES................................................................................................................................8
Document Page
Document Page
INTRODUCTION
Financial Resources a re a very crucial part of any business as well as organisation. If the
organisation would not be able to manage its financial resources in an effective way, it will be
very difficult for the organisation to survive for a longer period of time Going forward. Financial
resources includes All assets of the organisation like cash, Land and building, other intangible
resources etc. Financial resource management is a key managerial aspect and thus requires
effective and talented financial managers for the same. Thus, there is a need to hire talented
individuals that will help in managing these resources effectively (Altenburg and Pegels, 2012).
The current report will discuss the financial concepts like cost volume analysis and Cash budget
in detail. This will allow better understanding of these topics till the end of this report.
TASK 1 A
1. Classification of various types of cost in business
For the purpose of conducting business effectively, there occurs certain costs which has
to be bear by the business owners as well as managers. A better understanding of these costs and
its overall implications on business has to be as ascertained in an effective as well as efficient
way. The various types of cost that involves in performing a effective business are laid down as
follows:
Fixed Cost: These are cost which has to be bear by the organisation, irrespective of the fact
whether it conduct its operations or not. These are usually cost of Assets like Land and building,
plant and machinery etc. These are usually fixed in nature and only changes when there is a
considerable change within the business operations of the organisation over period of time.
Variable Cost: These are Cost which usually changes as the size of operations increase and
become big and there is a specific need to overcome the same. The elements of variable cost can
be the cost of Raw material, cost of labour and other overheads etc. This cost assumes a big part
in the overall cost structure of the organisation and thus it is essential to make sure that this
particular cost remain on control otherwise an organisation may turn into loss eventually in the
future.
Marginal Cost: These are the additional cost that an organisation occurs in production of every
additional unit of the product. For example if the total cost of 3 units is 1200 and total cost of 4
unit is 1500 then the Marginal cost of 4th unit is 300 (Conway, 2013).
1
tabler-icon-diamond-filled.svg

Paraphrase This Document

Need a fresh take? Get an instant paraphrase of this document with our AI Paraphraser
Document Page
Opportunity Cost: It is basically opportunity foregone in favour of a particular choice. If an
individual decides to business by leaving his job of 2,00,000 pound per year, then his opportunity
cost will be the salary that he might receive on job if he would be working that is 2,00,000
Pound.
Economic Cost: It refers to the sum of actual cost as well as Opportunity cost. For example if an
individual decides to do business instead of a job of 200,000 Pound per year. Then his economic
cost will be 200,000 pound plus the actual cost that he will incur for the purpose of conducting
business. Lets say actual cost of operating a business is 1,50,000 pound then total economic cost
of operating a business will be 3,50,000 Pound (Cusworth and Franks, 2013).
2. Cost Volume Profit Graph
Fixed Costs BEP in units
225000 11250 units
247500 12375 units
272250 13612.5 units
299475 14973.75 units
CVP chart is commonly known as Break-even point chart. It display a graphical
presentation of sales, costs and volume of units produced and profit made. CVP graph interpreted
2
1 2 3 4
0
50000
100000
150000
200000
250000
300000
350000
Fixed cost
units
Document Page
the relationship between cost-volume-profit by using total sales, variable costs and fixed costs.
Total cost and total revenue plays a crucial role in interpretation of Cost-volume Profit analysis
(Cowling and Mailer, 2013). When company's total cost is equals to total revenue that would
mean that business is at a position of no profit or loss and if total cost is more than total revenue
it shows business is experiencing loss and if company's total revenue is more than its total cost,
at this break-even point business is achieving adequate Profit to survive and grow the business.
The main components of CVP analysis are:
Selling price per unit
Variable cost per unit
Fixed cost
Level of output
TASK 1B
1. Calculation of BEP in units as well as in pound sterling
BEP in units= Fixed cost / contribution per unit
where, fixed cost= Rent+ marketing + salaries
= 160000+300000+140000
= £600000
and Contribution per unit= Selling price per blouse- variable expenses per blouse
= 80 – 50
= 30 per unit
Therefore, BEP in units = £600000 / 30
= 20000 units
BEP in pound = Fixed cost * S. P per unit / Contribution per unit
= 600000 * 80 /30
= £ 1600000
3
Document Page
2.CVP graph showing Break-even point on the chart
Analysis: The Break even point reflects the units that an organisation needs to sell in order to
cover up all of its cost, thus at break even point there is no profit or loss situation for the
company.
3.Calculation of Net Operating Income
Calculation of Net Operating Income / Loss
Sales ( 18500 *80) £1480000
less: Variable cost ( 18500 * 50) £925000
Contribution £555000
Less : Fixed cost £600000
Net operating Loss - £45000
4.Calculation of revised BEP
BEP in units= Fixed cost / contribution per unit
where, fixed cost= Rent+ marketing + salaries = £600000
Revised Contribution per unit= Selling price per blouse- revised variable expenses per blouse
= 80 – (50+6)
= 80- 56
= 24 per unit
4
19500 20000 20500 21000 21500 22000 22500 23000 23500 24000 24500
540000
560000
580000
600000
620000
640000
660000
680000
700000
720000
740000
600000
660000
680000
700000
720000
CVP Chart
Profit and BEV in units
tabler-icon-diamond-filled.svg

Paraphrase This Document

Need a fresh take? Get an instant paraphrase of this document with our AI Paraphraser
Document Page
BEP in units = 600000 / 24
= 25000 unit
5. Revised Net Operating Income or Loss
Calculation of Net Operating Income / Loss
Sales ( 23500*80) £1880000
less: Variable cost ( 23500 * 56) £1316000
Contribution £564000
Less : Fixed cost £600000
Net operating Loss £ -36000
6. Break-even point of company
BEP in units= Fixed cost / contribution per unit
where, fixed cost= Rent+ marketing + salaries
= 160000+300000+214000
= £674000
and Contribution per unit= Selling price per blouse- variable expenses per blouse
= 80 – 36
= 44 per unit
Therefore, BEP in units = £674000 / 44
= 15318.18 units
TASK 2
Cash budget
Definition: cash budget is basically a statement of the actual cash that the company may have to
pay or receive in the future and what will be the balance left thereafter for the purpose of other
activities of the business including growth. It is the responsibility of the finance manager to make
sure that effective budget is prepared that will lead to proper management of finances
(Simonovic, 2012).
Credit Sales: These are sales made to individual customers on credit basis. Usually the credit
sales is made for a specific credit period ranging from 3 to 6 moths within which the debtor has
5
Document Page
to make the payments. It is basically a sale made to customers on the terms that price will be paid
later on (Renz, 2016).
Credit Purchase: This is the purchases made by the Organisation from the suppliers on credit
basis. There is no need to pay the cash at the time of making the purchase rather a credit period is
extended to company that will allow it to pay cash after a specific period of time.
Impact: Credit Purchase will increase the payables of company, hence will reduce the profits.
Credit sales will increase the sales as well as profits of the organisation.
CASH BUDGET
Particulars January February March
Opening Amount 25,000 98,000 44,000
Receipts
Cash Receipts 75,000 80,000 90,000
Received from debtors 300,000 285,000 282,000
Total A 400,000 463,000 416,000
Payments
Payment to suppliers 180,000 196,000 200,000
Miscellaneous expenses 122,000 123,000 123,000
Purchase of Commercial
Vehicle 100,000
Total B 302,000 419,000 323,000
Net Closing balance of cash
(A-B) 98,000 44,000 93,000
Working notes
Received from debtors
January
225,000+45,000+30,000=300,0
00
February
6
Document Page
210,000+45,000+30,000=28,50
00
March
210,000+42,000+30,000=28,20
00
Payment to suppliers
January
144,000+36,000=180,000
February
160,000+36,000=196,000
March
160,000+40,000=200,000
Analysis: The above Cash Budget clearly shows the impact of credit sales as well as purchases
on the cash flow of the organisation. If a large amount of sales will be made on a credit basis
then it will result in a decrease of cash flow, this is because the cost remains the same but it takes
time for sales to realise into actual cash, thus, the cash flow statement or cash budget will not be
able to reflect the amount of sales as cash received which will impact the Cash Budget
adversely. The above statement shows that amount that may be received from debtors in the
month of January, February and March is 3,00,000 , 2,85,000 , 2,82,000. which has boosted the
Cash situation of the firm in an effective way. Due to the fact that payment made to supplier
every month is less then the amount received from debtors there is a positive cash situations.
CONCLUSION
Thus, From the above discussion it can be said that effective management of financial
resources is required to carry out the business activities. For this purpose it is important to have
a proper knowledge of different aspects of accounting. The tools of Cash Budget and CVP
7
tabler-icon-diamond-filled.svg

Paraphrase This Document

Need a fresh take? Get an instant paraphrase of this document with our AI Paraphraser
Document Page
Analysis is used to effectively disseminate the information regarding the current situations of
the business and where it is heading in the future. This will allow a better understanding of the
data in an effective way.
REFERENCES
Books and Journal:
Altenburg, T. and Pegels, A., 2012. Sustainability-oriented innovation systems–managing the
green transformation. Innovation and development. 2(1). pp.5-22.
Conway, J. B., 2013. A course in functional analysis (Vol. 96). Springer Science & Business
Media.
Cowling, A. and Mailer, C., 2013. Managing human resources. Routledge.
8
chevron_up_icon
1 out of 11
circle_padding
hide_on_mobile
zoom_out_icon
[object Object]