Financial Resource Management Report - Analysis and Ratios
VerifiedAdded on 2020/10/22
|12
|3100
|444
Report
AI Summary
This report evaluates the financial performance of two companies, Debrun and McGill, using ratio analysis. It calculates and interprets various financial ratios such as gross profit margin, return on capital employed, return on equity, inventory turnover, and accounts receivable/payable collection periods. The analysis compares the performance of the two companies, offering recommendations to Dipapa regarding investment decisions and the acceptance or rejection of a job quotation. The report also includes a job cost card preparation for Job No. 21, calculating direct material, direct labor, direct expenses, and overhead costs to determine the total production cost and ultimately, the price of the job. The conclusion summarizes the key findings and recommendations based on the financial analysis.

MANAGING FINANCIAL
RESOURCES
RESOURCES
Paraphrase This Document
Need a fresh take? Get an instant paraphrase of this document with our AI Paraphraser
TABLE OF CONTENTS
INTRODUCTION...........................................................................................................................1
a. Computing the following ratios...............................................................................................1
b. Recommendation.....................................................................................................................5
TASK 2............................................................................................................................................6
a) preparation of Job cost card for Job No. 21.............................................................................6
Interpretation:...................................................................................................................................7
b) Advising finance manger of on acceptance or rejection of quote sent by the consumer for
above job......................................................................................................................................7
CONCLUSION................................................................................................................................8
REFERENCES................................................................................................................................9
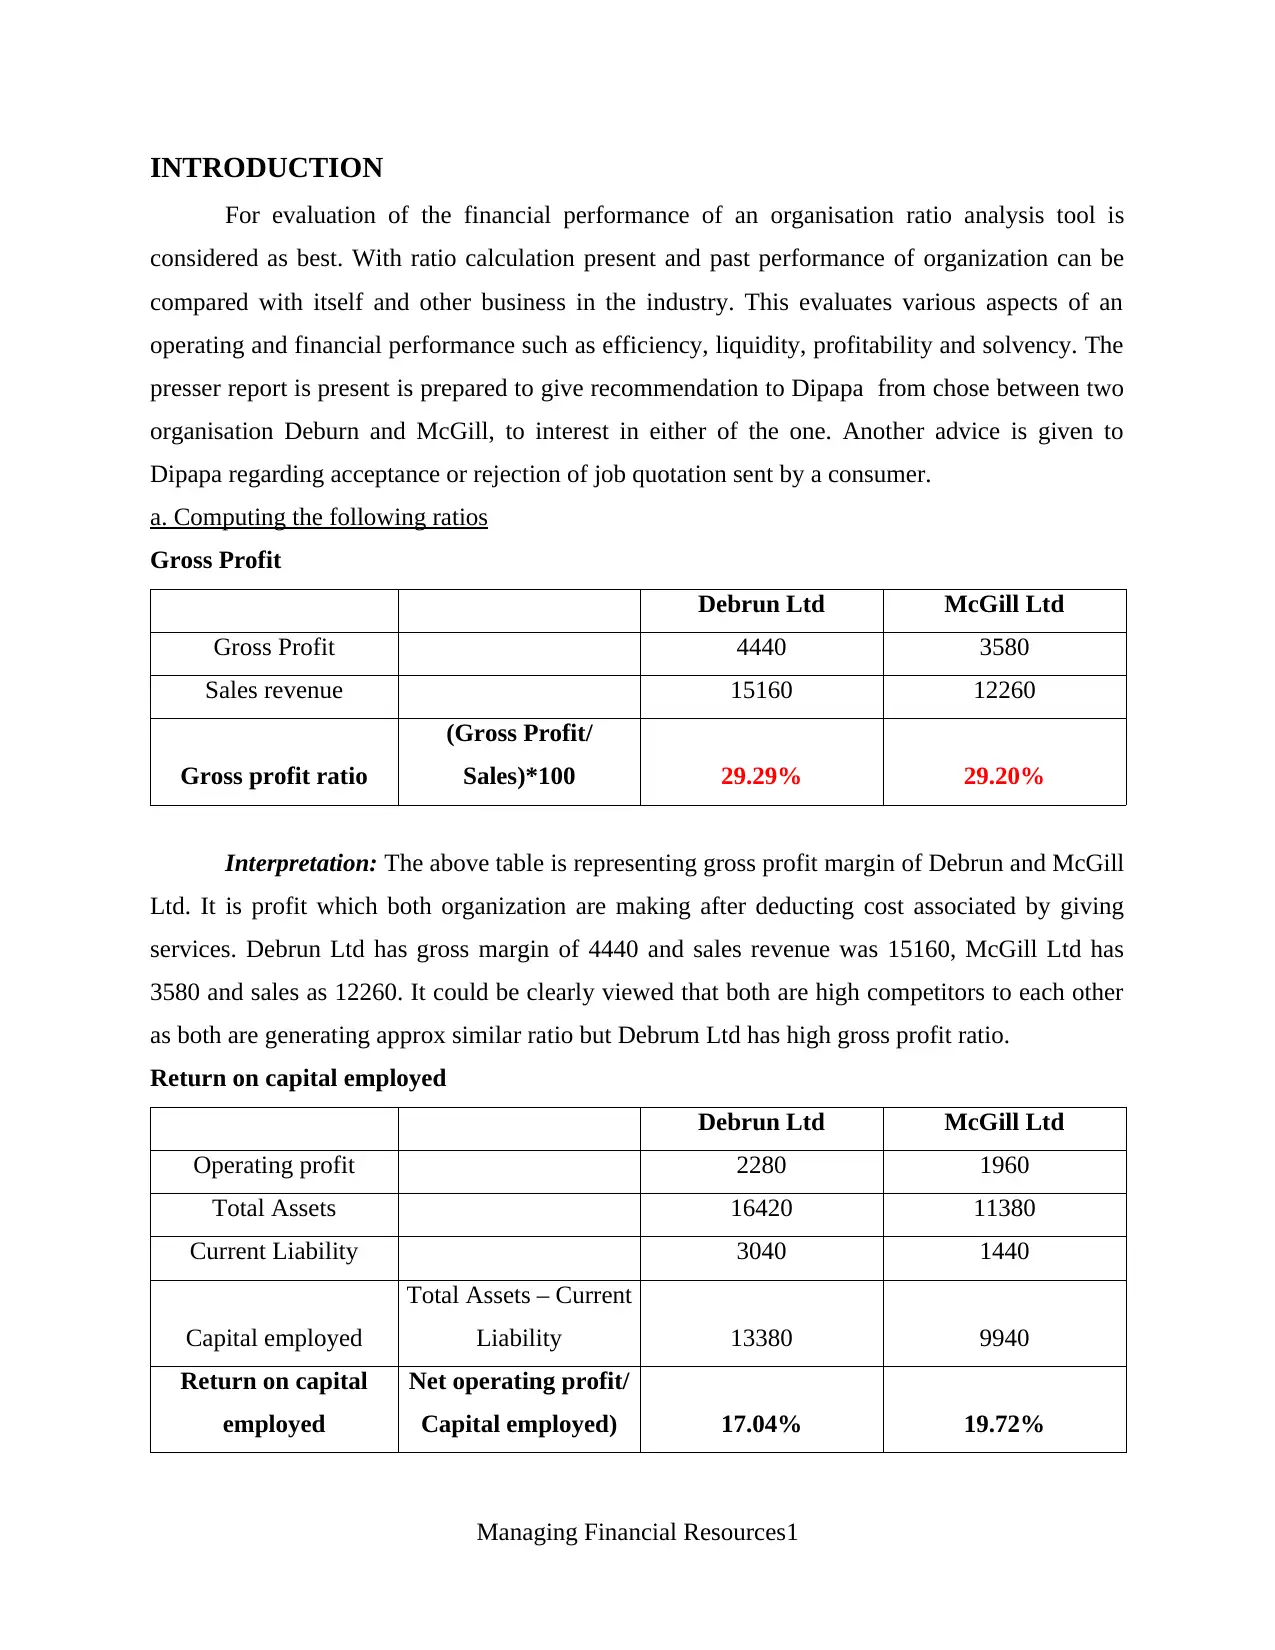
INTRODUCTION
For evaluation of the financial performance of an organisation ratio analysis tool is
considered as best. With ratio calculation present and past performance of organization can be
compared with itself and other business in the industry. This evaluates various aspects of an
operating and financial performance such as efficiency, liquidity, profitability and solvency. The
presser report is present is prepared to give recommendation to Dipapa from chose between two
organisation Deburn and McGill, to interest in either of the one. Another advice is given to
Dipapa regarding acceptance or rejection of job quotation sent by a consumer.
a. Computing the following ratios
Gross Profit
Debrun Ltd McGill Ltd
Gross Profit 4440 3580
Sales revenue 15160 12260
Gross profit ratio
(Gross Profit/
Sales)*100 29.29% 29.20%
Interpretation: The above table is representing gross profit margin of Debrun and McGill
Ltd. It is profit which both organization are making after deducting cost associated by giving
services. Debrun Ltd has gross margin of 4440 and sales revenue was 15160, McGill Ltd has
3580 and sales as 12260. It could be clearly viewed that both are high competitors to each other
as both are generating approx similar ratio but Debrum Ltd has high gross profit ratio.
Return on capital employed
Debrun Ltd McGill Ltd
Operating profit 2280 1960
Total Assets 16420 11380
Current Liability 3040 1440
Capital employed
Total Assets – Current
Liability 13380 9940
Return on capital
employed
Net operating profit/
Capital employed) 17.04% 19.72%
Managing Financial Resources1
⊘ This is a preview!⊘
Do you want full access?
Subscribe today to unlock all pages.
Trusted by 1+ million students worldwide
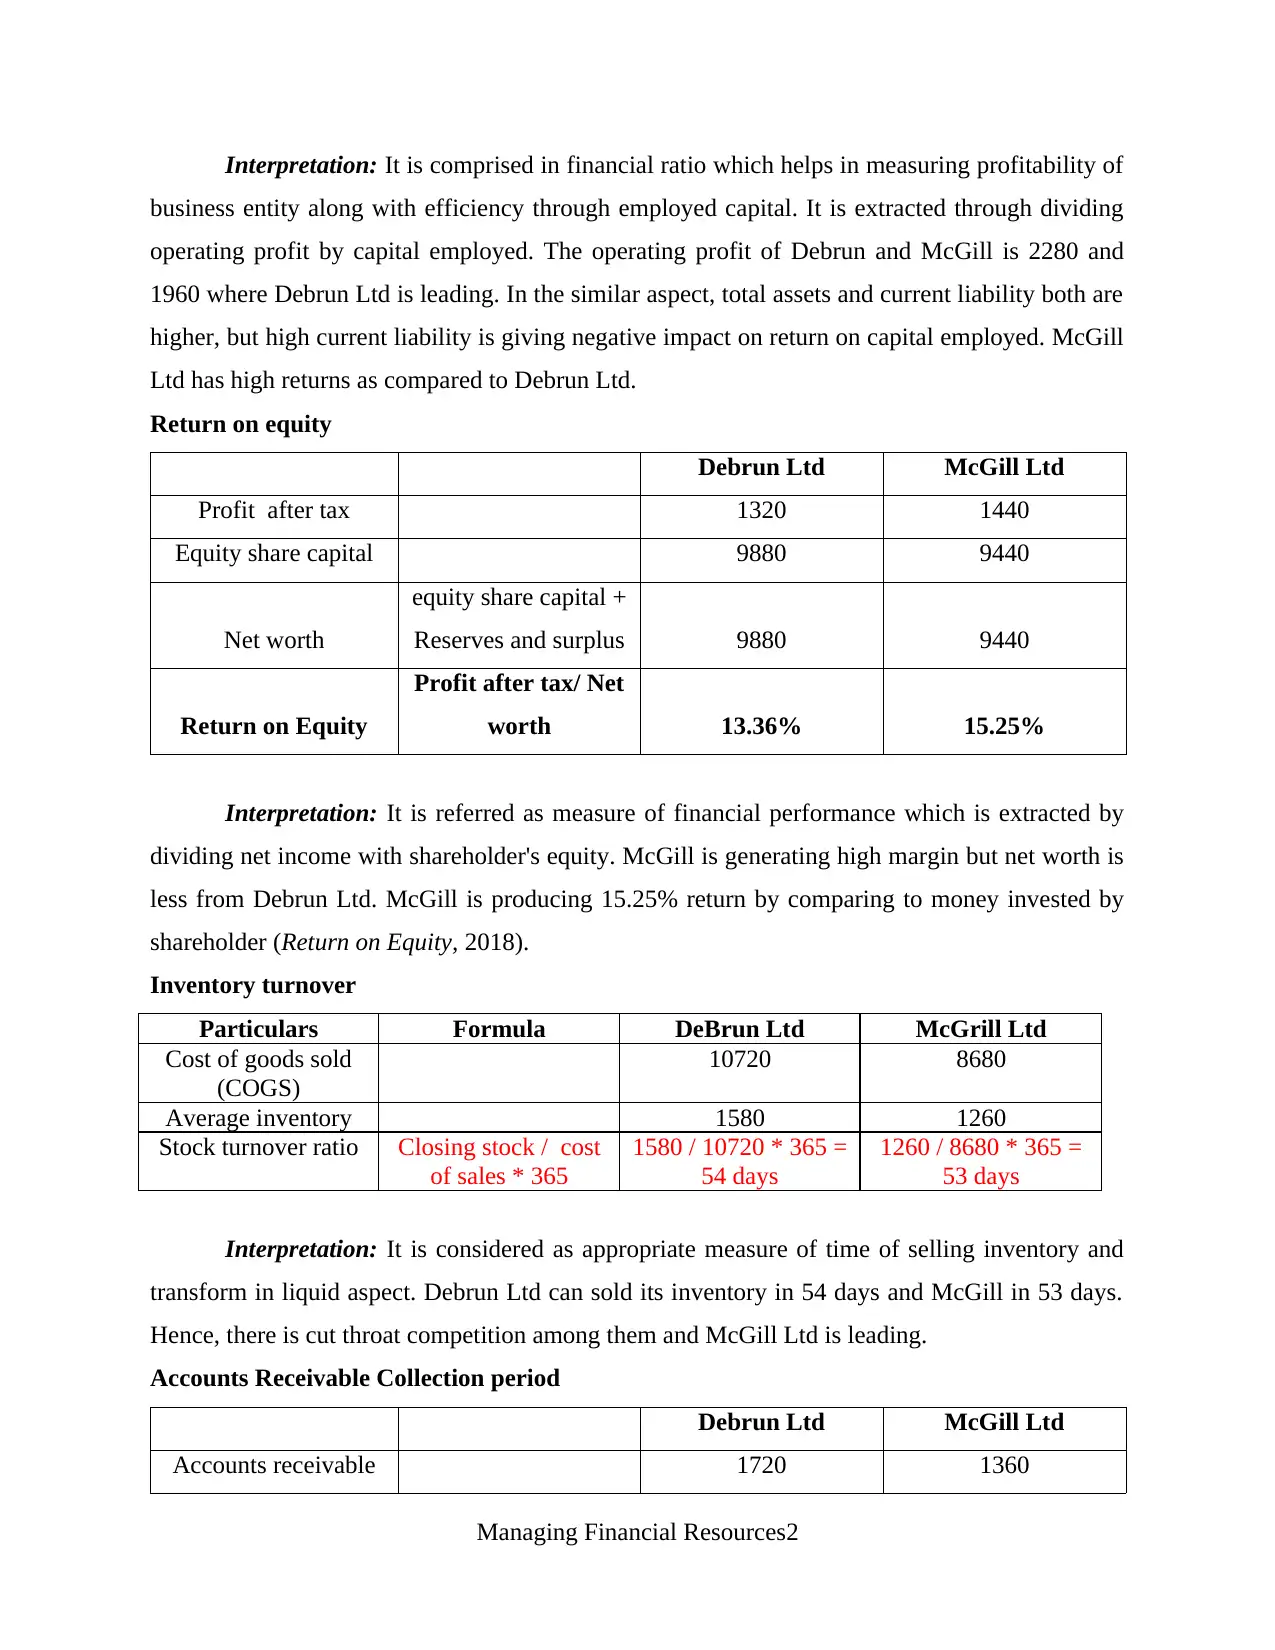
Interpretation: It is comprised in financial ratio which helps in measuring profitability of
business entity along with efficiency through employed capital. It is extracted through dividing
operating profit by capital employed. The operating profit of Debrun and McGill is 2280 and
1960 where Debrun Ltd is leading. In the similar aspect, total assets and current liability both are
higher, but high current liability is giving negative impact on return on capital employed. McGill
Ltd has high returns as compared to Debrun Ltd.
Return on equity
Debrun Ltd McGill Ltd
Profit after tax 1320 1440
Equity share capital 9880 9440
Net worth
equity share capital +
Reserves and surplus 9880 9440
Return on Equity
Profit after tax/ Net
worth 13.36% 15.25%
Interpretation: It is referred as measure of financial performance which is extracted by
dividing net income with shareholder's equity. McGill is generating high margin but net worth is
less from Debrun Ltd. McGill is producing 15.25% return by comparing to money invested by
shareholder (Return on Equity, 2018).
Inventory turnover
Particulars Formula DeBrun Ltd McGrill Ltd
Cost of goods sold
(COGS)
10720 8680
Average inventory 1580 1260
Stock turnover ratio Closing stock / cost
of sales * 365
1580 / 10720 * 365 =
54 days
1260 / 8680 * 365 =
53 days
Interpretation: It is considered as appropriate measure of time of selling inventory and
transform in liquid aspect. Debrun Ltd can sold its inventory in 54 days and McGill in 53 days.
Hence, there is cut throat competition among them and McGill Ltd is leading.
Accounts Receivable Collection period
Debrun Ltd McGill Ltd
Accounts receivable 1720 1360
Managing Financial Resources2
Paraphrase This Document
Need a fresh take? Get an instant paraphrase of this document with our AI Paraphraser
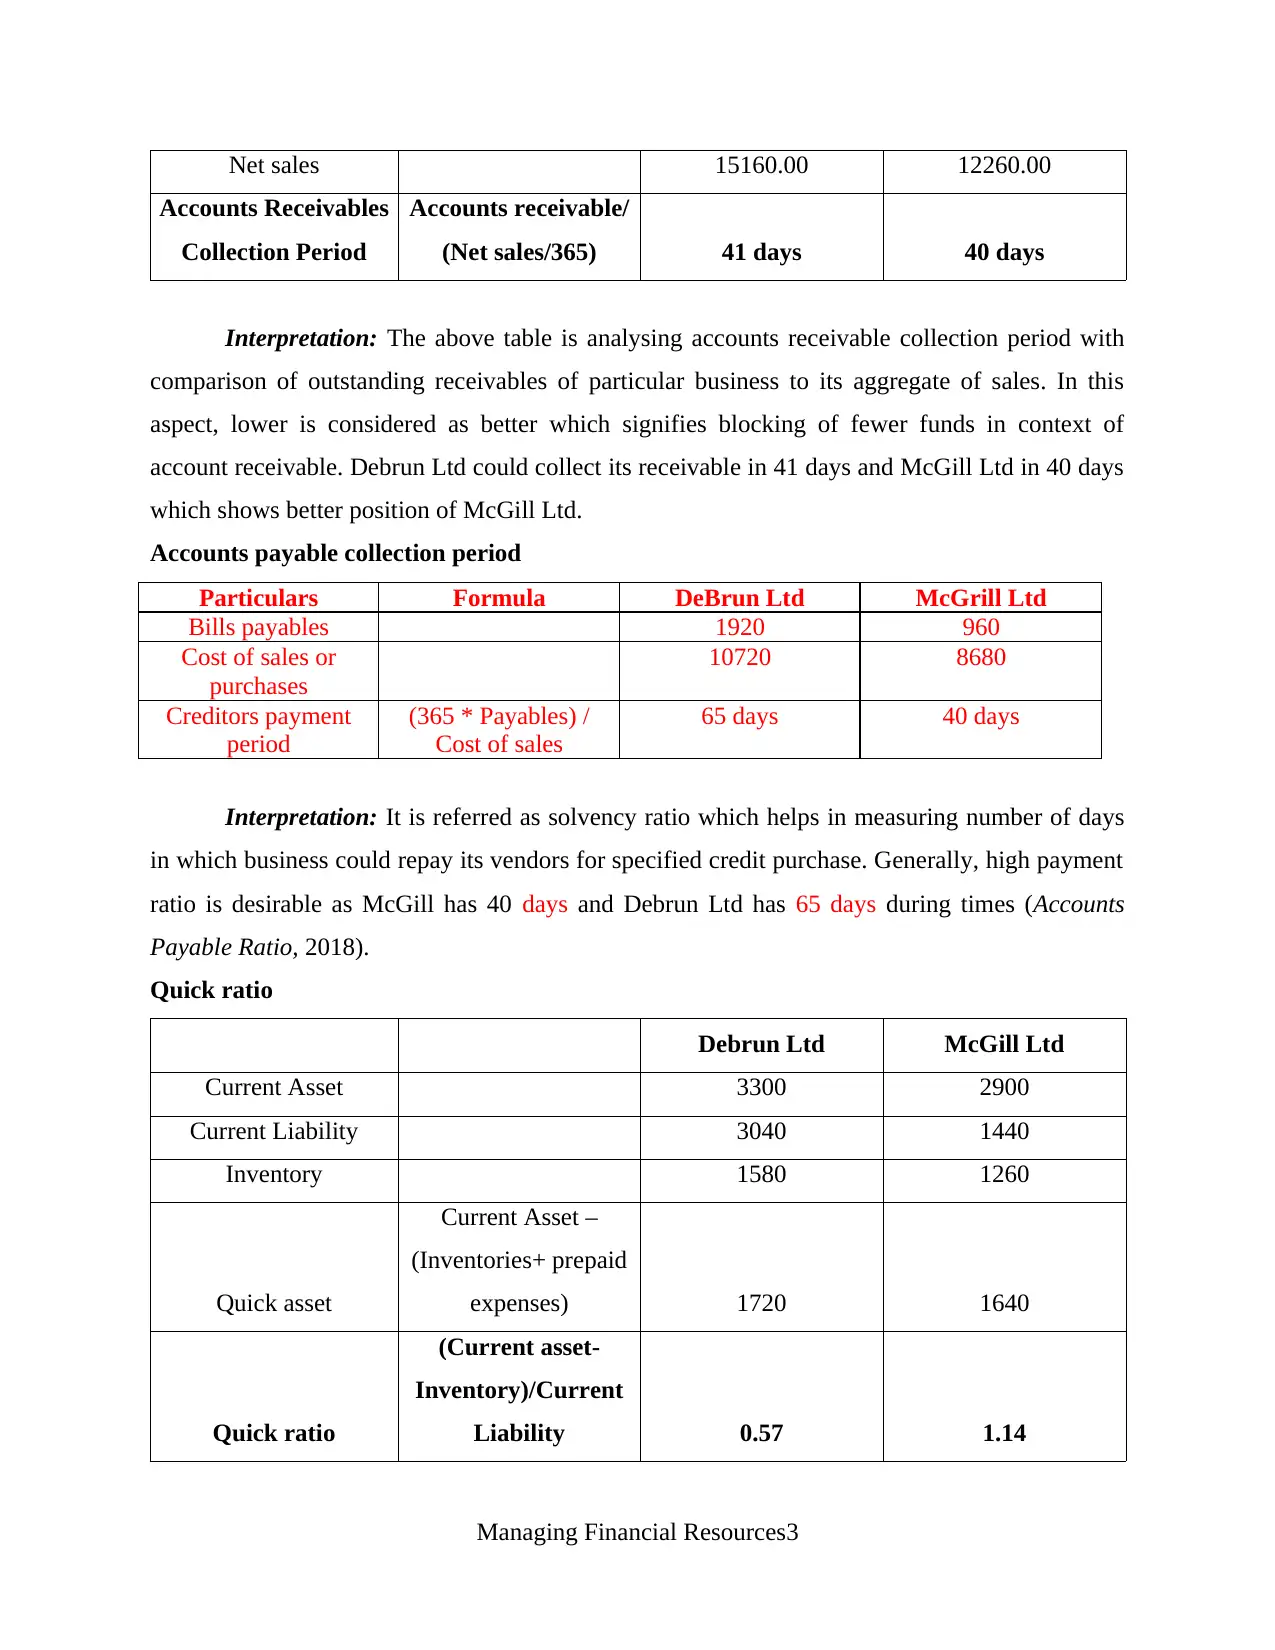
Net sales 15160.00 12260.00
Accounts Receivables
Collection Period
Accounts receivable/
(Net sales/365) 41 days 40 days
Interpretation: The above table is analysing accounts receivable collection period with
comparison of outstanding receivables of particular business to its aggregate of sales. In this
aspect, lower is considered as better which signifies blocking of fewer funds in context of
account receivable. Debrun Ltd could collect its receivable in 41 days and McGill Ltd in 40 days
which shows better position of McGill Ltd.
Accounts payable collection period
Particulars Formula DeBrun Ltd McGrill Ltd
Bills payables 1920 960
Cost of sales or
purchases
10720 8680
Creditors payment
period
(365 * Payables) /
Cost of sales
65 days 40 days
Interpretation: It is referred as solvency ratio which helps in measuring number of days
in which business could repay its vendors for specified credit purchase. Generally, high payment
ratio is desirable as McGill has 40 days and Debrun Ltd has 65 days during times (Accounts
Payable Ratio, 2018).
Quick ratio
Debrun Ltd McGill Ltd
Current Asset 3300 2900
Current Liability 3040 1440
Inventory 1580 1260
Quick asset
Current Asset –
(Inventories+ prepaid
expenses) 1720 1640
Quick ratio
(Current asset-
Inventory)/Current
Liability 0.57 1.14
Managing Financial Resources3
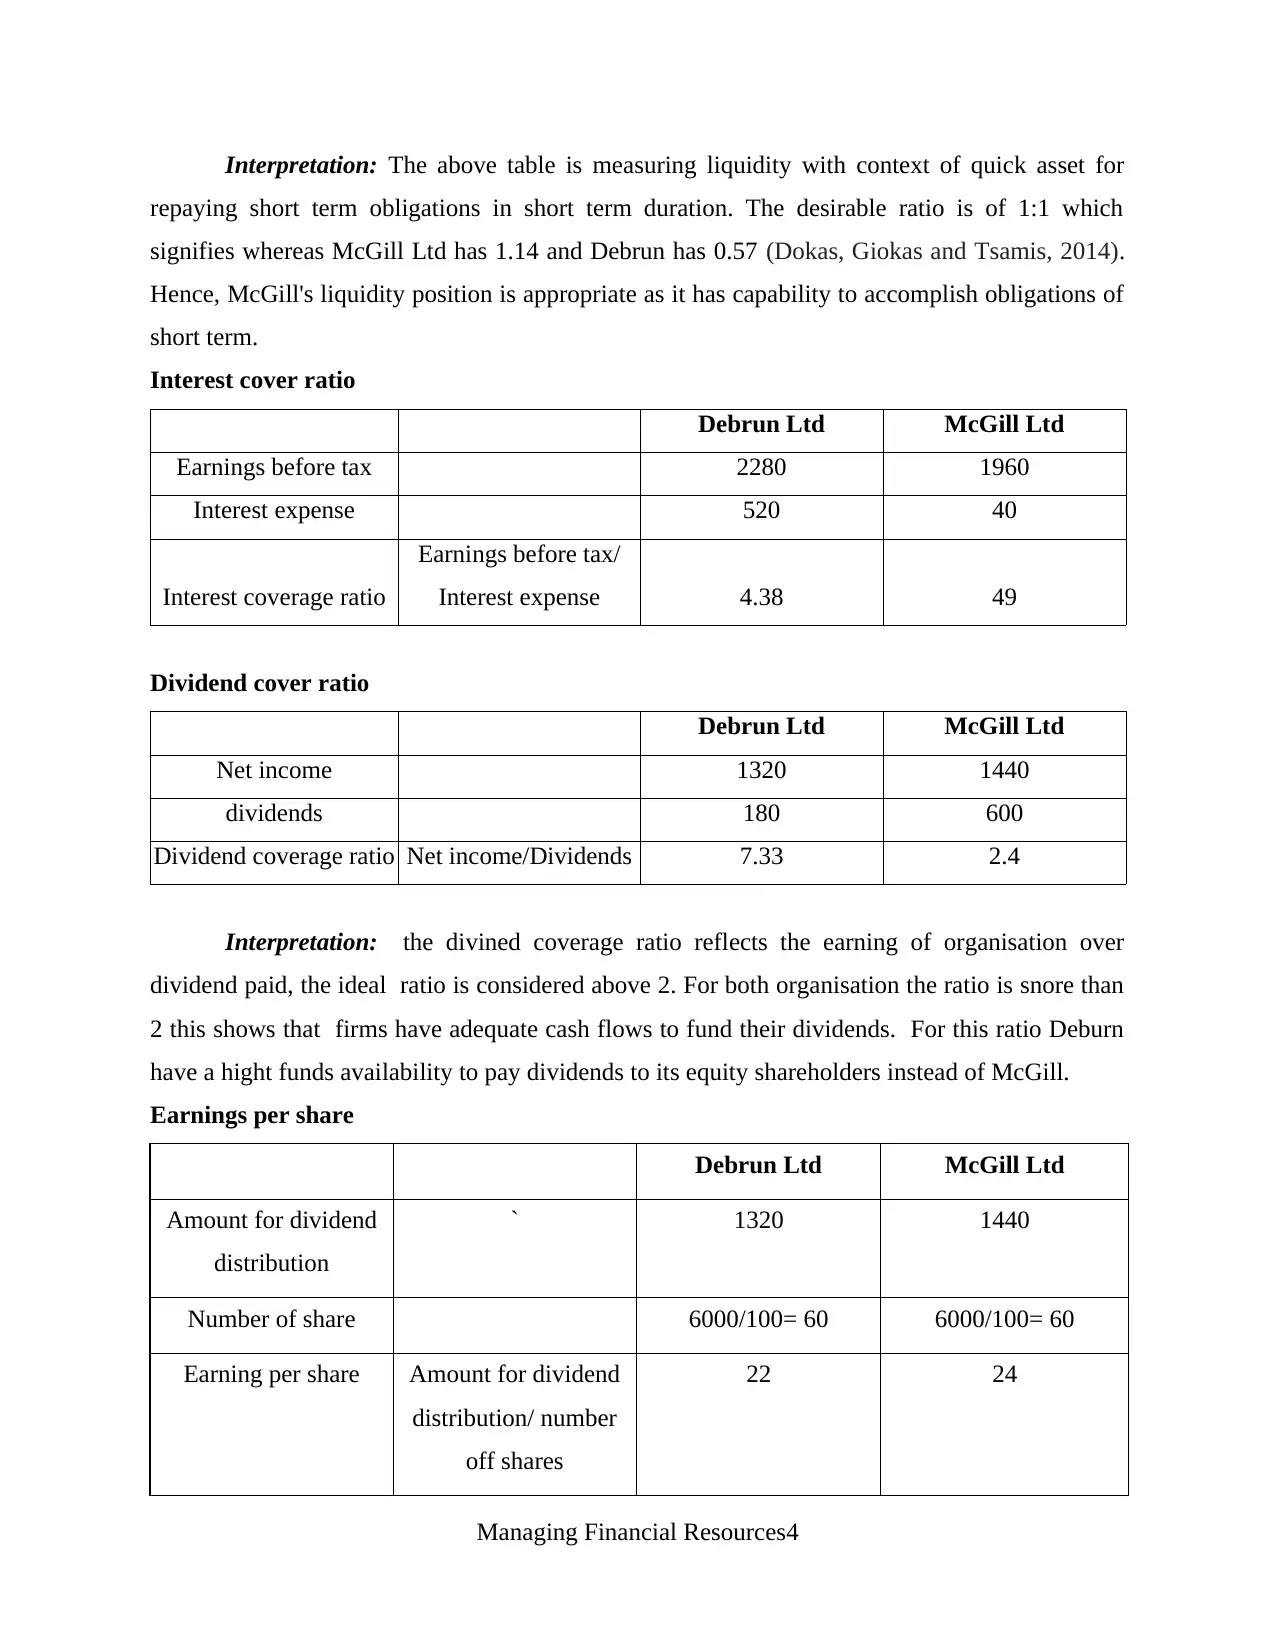
Interpretation: The above table is measuring liquidity with context of quick asset for
repaying short term obligations in short term duration. The desirable ratio is of 1:1 which
signifies whereas McGill Ltd has 1.14 and Debrun has 0.57 (Dokas, Giokas and Tsamis, 2014).
Hence, McGill's liquidity position is appropriate as it has capability to accomplish obligations of
short term.
Interest cover ratio
Debrun Ltd McGill Ltd
Earnings before tax 2280 1960
Interest expense 520 40
Interest coverage ratio
Earnings before tax/
Interest expense 4.38 49
Dividend cover ratio
Debrun Ltd McGill Ltd
Net income 1320 1440
dividends 180 600
Dividend coverage ratio Net income/Dividends 7.33 2.4
Interpretation: the divined coverage ratio reflects the earning of organisation over
dividend paid, the ideal ratio is considered above 2. For both organisation the ratio is snore than
2 this shows that firms have adequate cash flows to fund their dividends. For this ratio Deburn
have a hight funds availability to pay dividends to its equity shareholders instead of McGill.
Earnings per share
Debrun Ltd McGill Ltd
Amount for dividend
distribution
` 1320 1440
Number of share 6000/100= 60 6000/100= 60
Earning per share Amount for dividend
distribution/ number
off shares
22 24
Managing Financial Resources4
⊘ This is a preview!⊘
Do you want full access?
Subscribe today to unlock all pages.
Trusted by 1+ million students worldwide
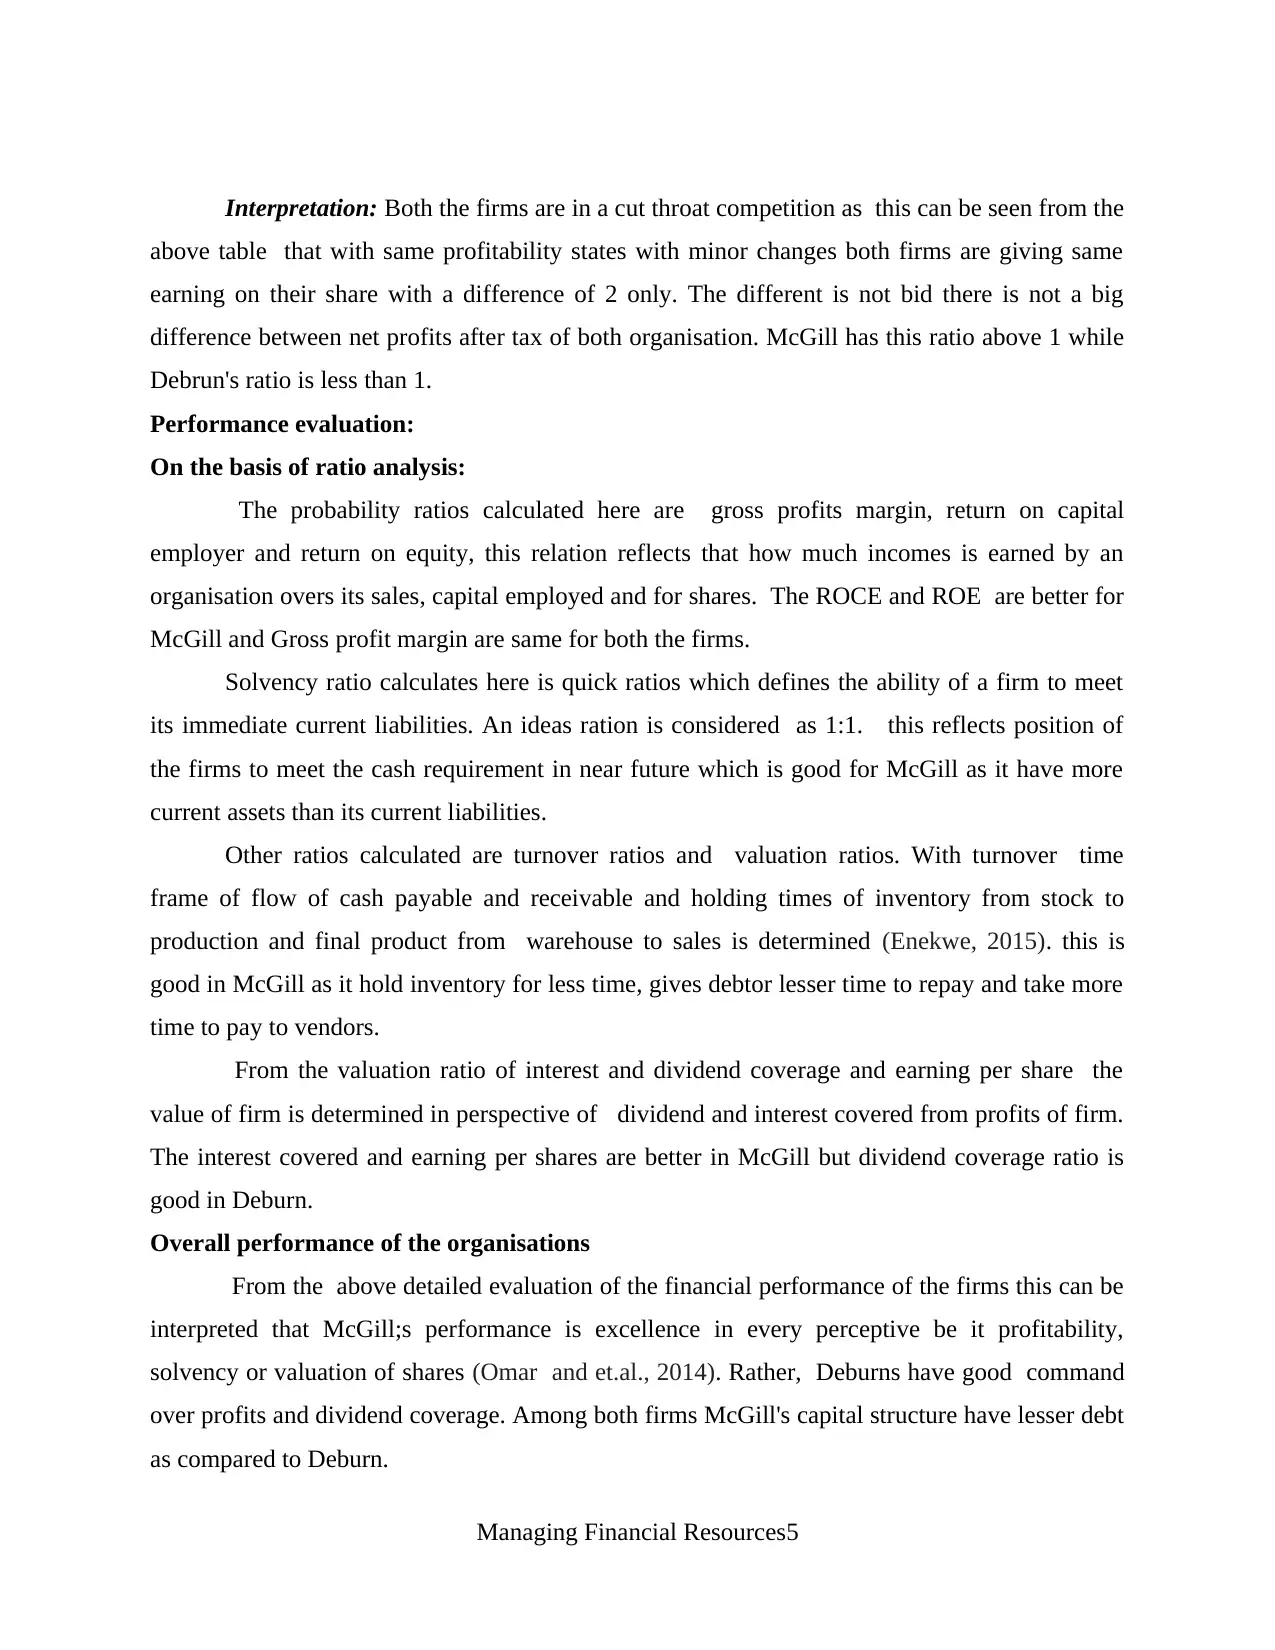
Interpretation: Both the firms are in a cut throat competition as this can be seen from the
above table that with same profitability states with minor changes both firms are giving same
earning on their share with a difference of 2 only. The different is not bid there is not a big
difference between net profits after tax of both organisation. McGill has this ratio above 1 while
Debrun's ratio is less than 1.
Performance evaluation:
On the basis of ratio analysis:
The probability ratios calculated here are gross profits margin, return on capital
employer and return on equity, this relation reflects that how much incomes is earned by an
organisation overs its sales, capital employed and for shares. The ROCE and ROE are better for
McGill and Gross profit margin are same for both the firms.
Solvency ratio calculates here is quick ratios which defines the ability of a firm to meet
its immediate current liabilities. An ideas ration is considered as 1:1. this reflects position of
the firms to meet the cash requirement in near future which is good for McGill as it have more
current assets than its current liabilities.
Other ratios calculated are turnover ratios and valuation ratios. With turnover time
frame of flow of cash payable and receivable and holding times of inventory from stock to
production and final product from warehouse to sales is determined (Enekwe, 2015). this is
good in McGill as it hold inventory for less time, gives debtor lesser time to repay and take more
time to pay to vendors.
From the valuation ratio of interest and dividend coverage and earning per share the
value of firm is determined in perspective of dividend and interest covered from profits of firm.
The interest covered and earning per shares are better in McGill but dividend coverage ratio is
good in Deburn.
Overall performance of the organisations
From the above detailed evaluation of the financial performance of the firms this can be
interpreted that McGill;s performance is excellence in every perceptive be it profitability,
solvency or valuation of shares (Omar and et.al., 2014). Rather, Deburns have good command
over profits and dividend coverage. Among both firms McGill's capital structure have lesser debt
as compared to Deburn.
Managing Financial Resources5
Paraphrase This Document
Need a fresh take? Get an instant paraphrase of this document with our AI Paraphraser
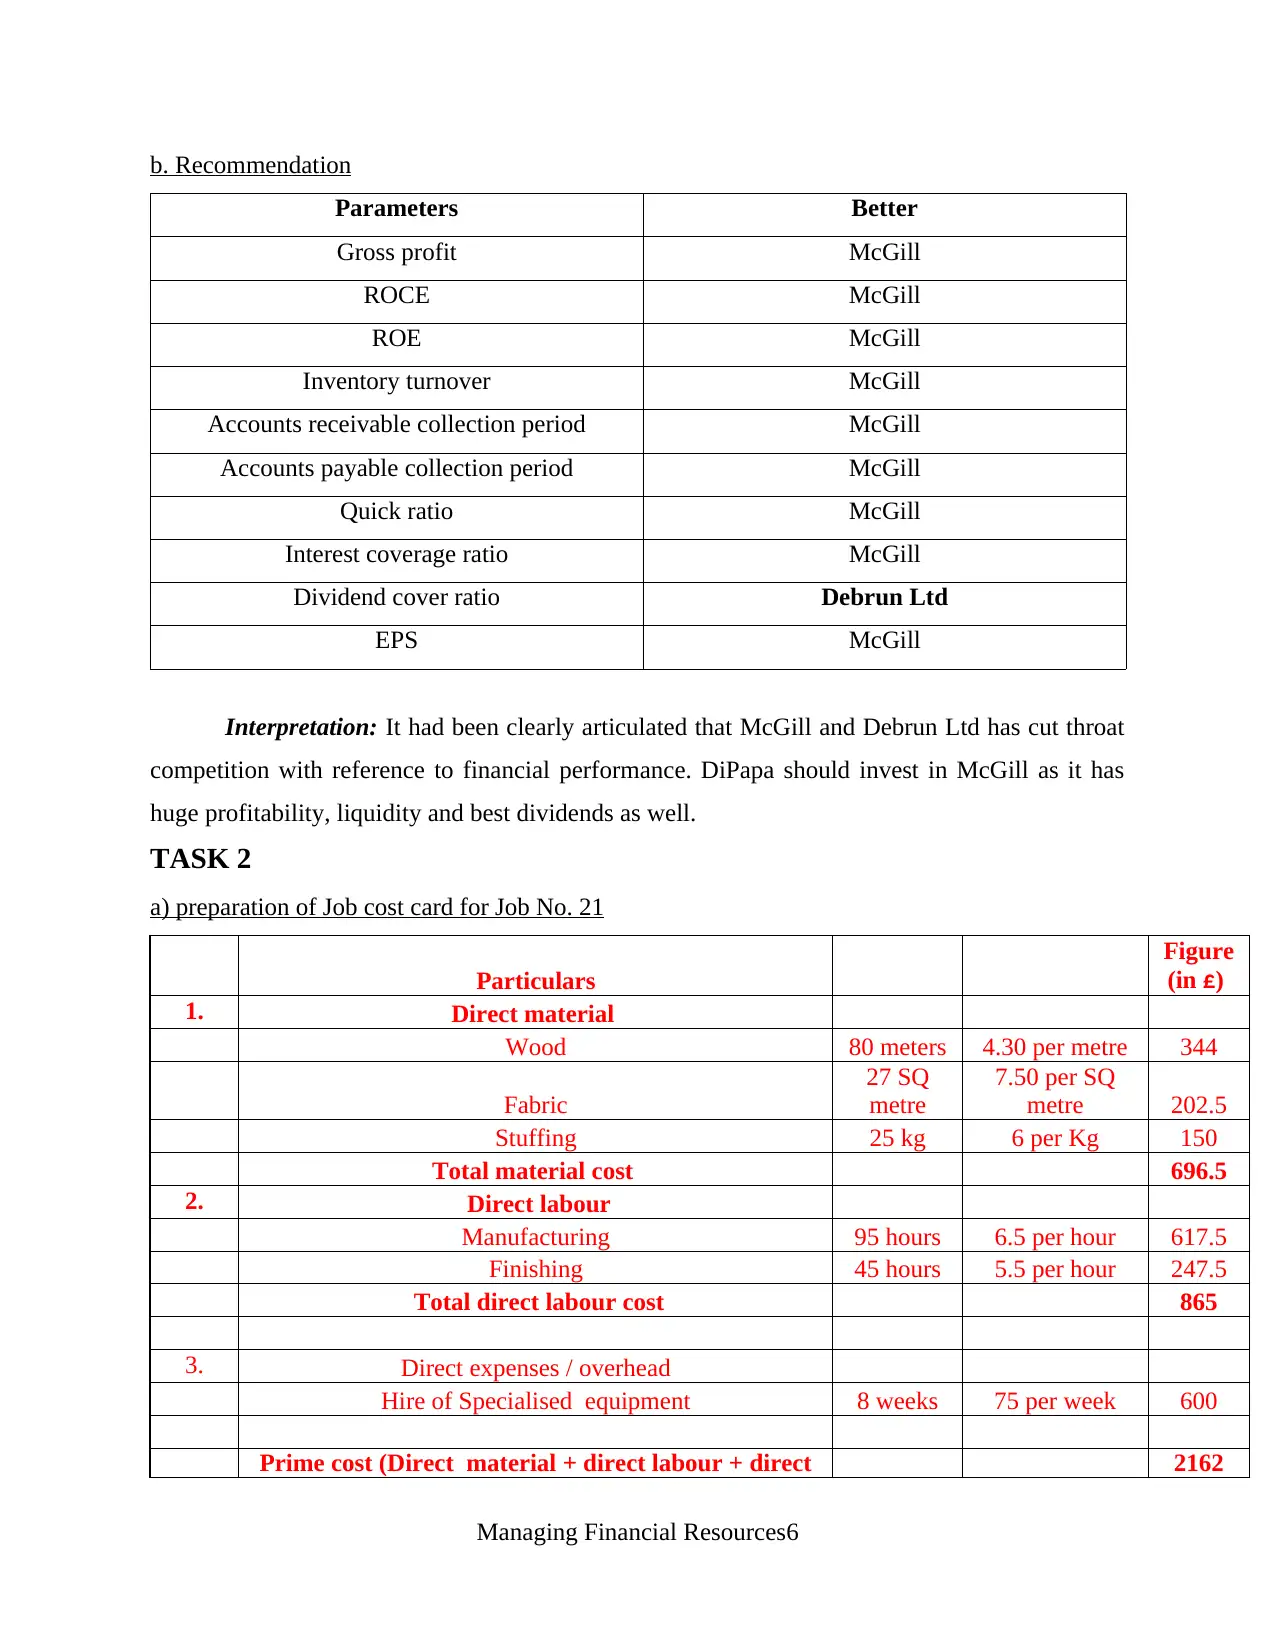
b. Recommendation
Parameters Better
Gross profit McGill
ROCE McGill
ROE McGill
Inventory turnover McGill
Accounts receivable collection period McGill
Accounts payable collection period McGill
Quick ratio McGill
Interest coverage ratio McGill
Dividend cover ratio Debrun Ltd
EPS McGill
Interpretation: It had been clearly articulated that McGill and Debrun Ltd has cut throat
competition with reference to financial performance. DiPapa should invest in McGill as it has
huge profitability, liquidity and best dividends as well.
TASK 2
a) preparation of Job cost card for Job No. 21
Particulars
Figure
(in £)
1. Direct material
Wood 80 meters 4.30 per metre 344
Fabric
27 SQ
metre
7.50 per SQ
metre 202.5
Stuffing 25 kg 6 per Kg 150
Total material cost 696.5
2. Direct labour
Manufacturing 95 hours 6.5 per hour 617.5
Finishing 45 hours 5.5 per hour 247.5
Total direct labour cost 865
3. Direct expenses / overhead
Hire of Specialised equipment 8 weeks 75 per week 600
Prime cost (Direct material + direct labour + direct 2162
Managing Financial Resources6
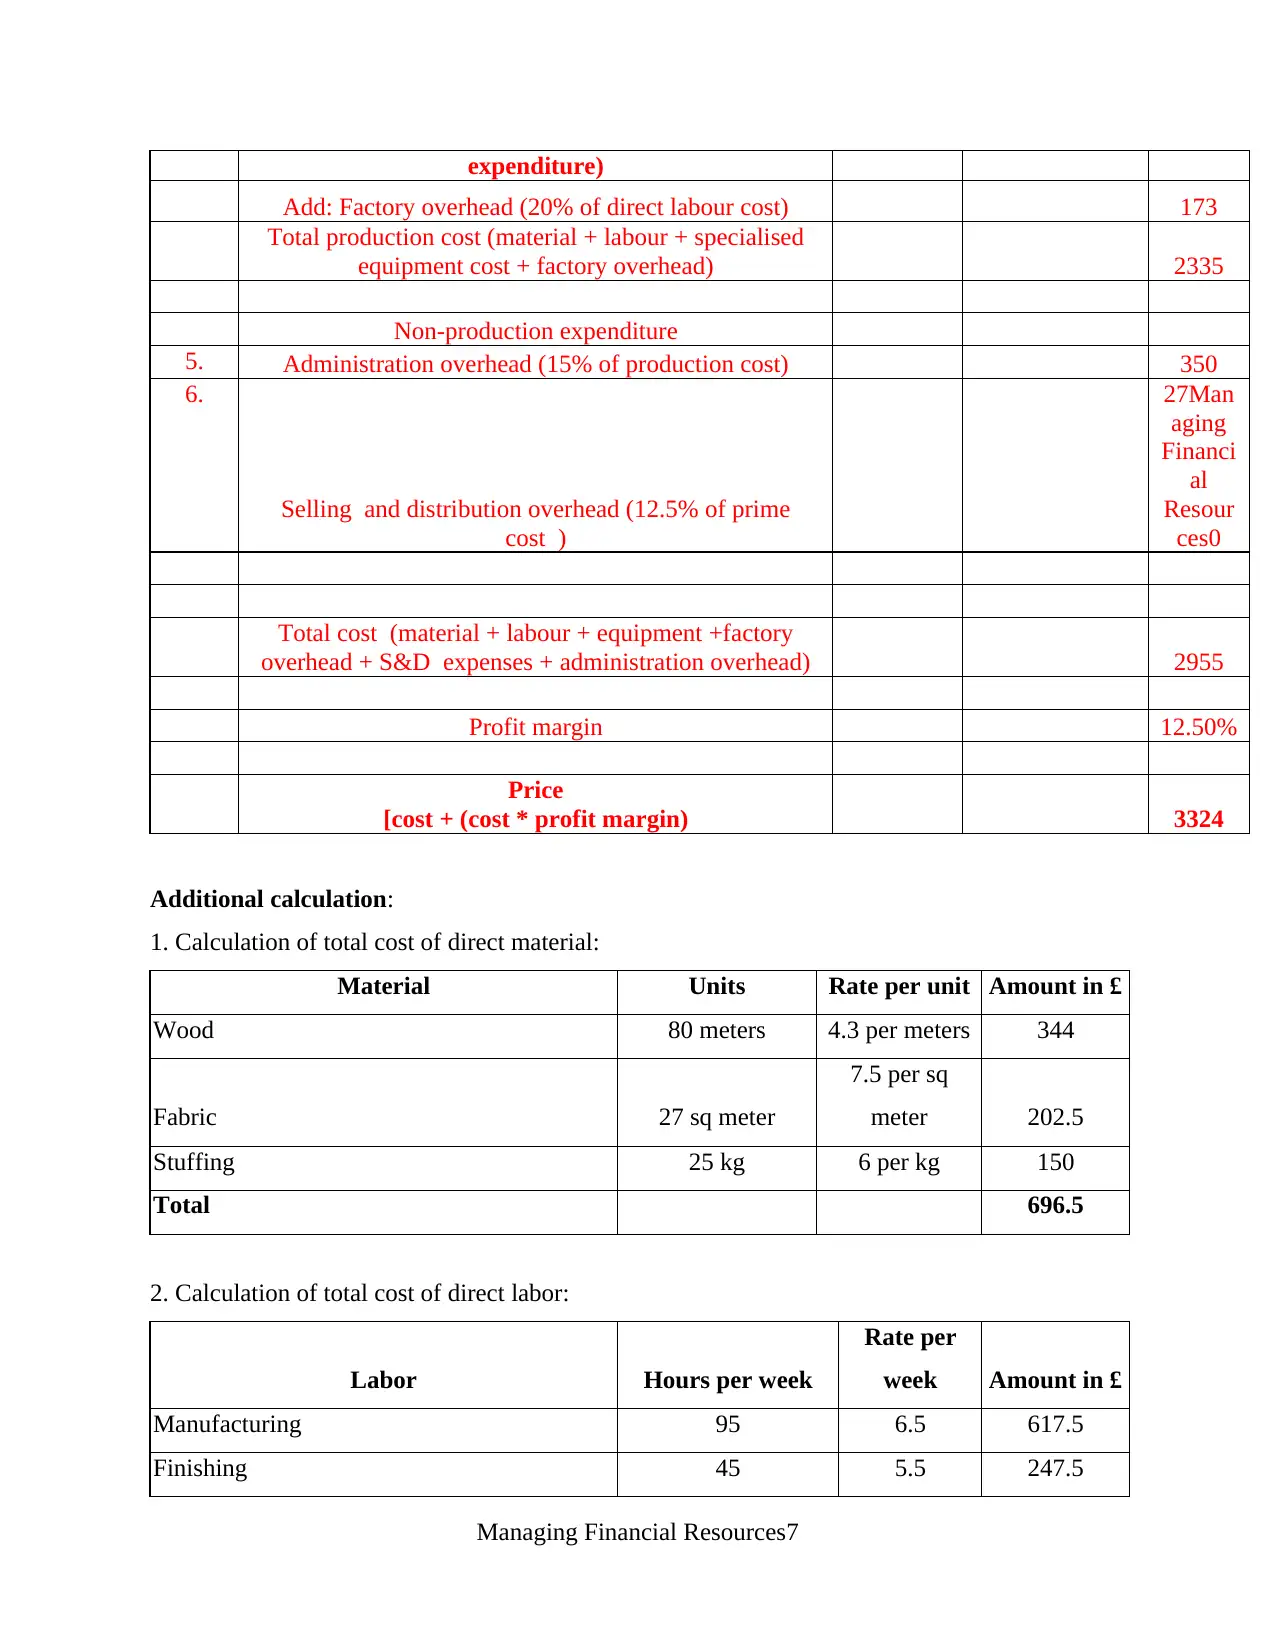
expenditure)
Add: Factory overhead (20% of direct labour cost) 173
Total production cost (material + labour + specialised
equipment cost + factory overhead) 2335
Non-production expenditure
5. Administration overhead (15% of production cost) 350
6.
Selling and distribution overhead (12.5% of prime
cost )
27Man
aging
Financi
al
Resour
ces0
Total cost (material + labour + equipment +factory
overhead + S&D expenses + administration overhead) 2955
Profit margin 12.50%
Price
[cost + (cost * profit margin) 3324
Additional calculation:
1. Calculation of total cost of direct material:
Material Units Rate per unit Amount in £
Wood 80 meters 4.3 per meters 344
Fabric 27 sq meter
7.5 per sq
meter 202.5
Stuffing 25 kg 6 per kg 150
Total 696.5
2. Calculation of total cost of direct labor:
Labor Hours per week
Rate per
week Amount in £
Manufacturing 95 6.5 617.5
Finishing 45 5.5 247.5
Managing Financial Resources7
⊘ This is a preview!⊘
Do you want full access?
Subscribe today to unlock all pages.
Trusted by 1+ million students worldwide
Total 140 865
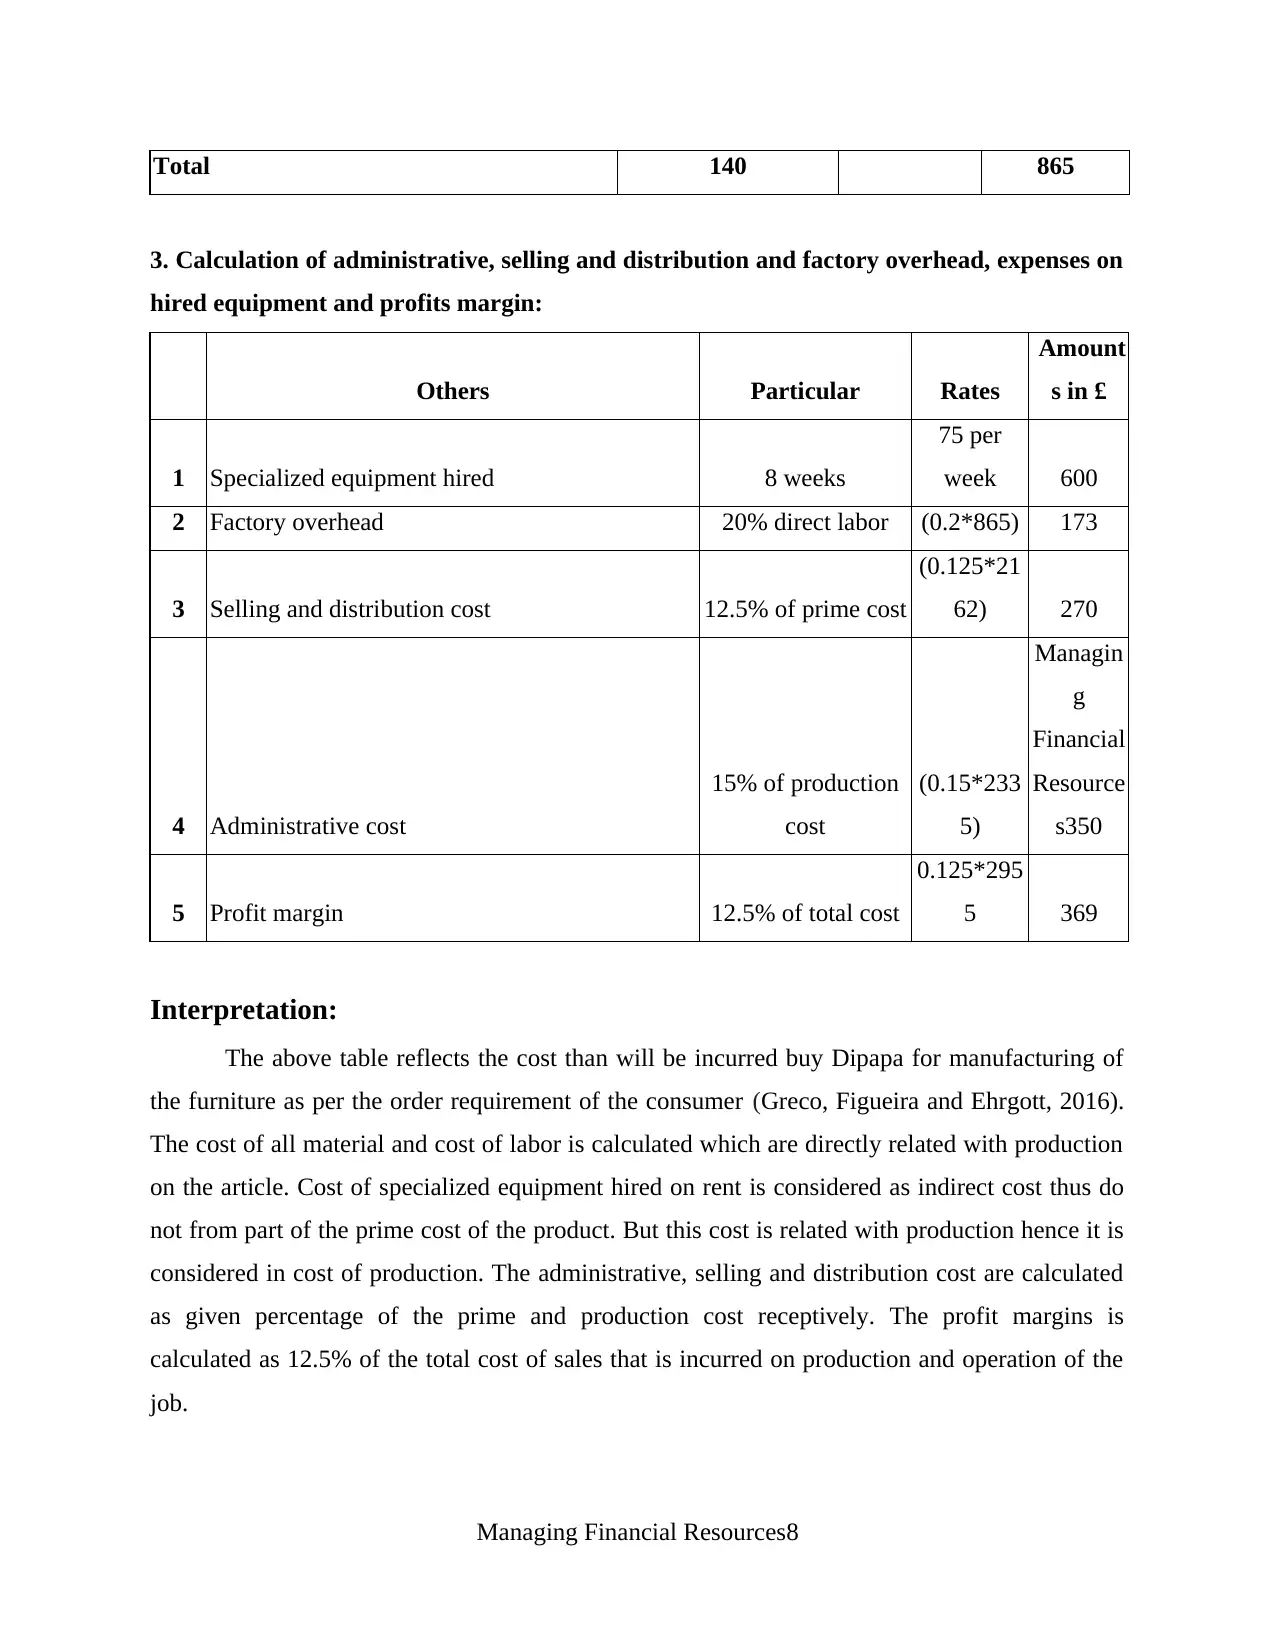
3. Calculation of administrative, selling and distribution and factory overhead, expenses on
hired equipment and profits margin:
Others Particular Rates
Amount
s in £
1 Specialized equipment hired 8 weeks
75 per
week 600
2 Factory overhead 20% direct labor (0.2*865) 173
3 Selling and distribution cost 12.5% of prime cost
(0.125*21
62) 270
4 Administrative cost
15% of production
cost
(0.15*233
5)
Managin
g
Financial
Resource
s350
5 Profit margin 12.5% of total cost
0.125*295
5 369
Interpretation:
The above table reflects the cost than will be incurred buy Dipapa for manufacturing of
the furniture as per the order requirement of the consumer (Greco, Figueira and Ehrgott, 2016).
The cost of all material and cost of labor is calculated which are directly related with production
on the article. Cost of specialized equipment hired on rent is considered as indirect cost thus do
not from part of the prime cost of the product. But this cost is related with production hence it is
considered in cost of production. The administrative, selling and distribution cost are calculated
as given percentage of the prime and production cost receptively. The profit margins is
calculated as 12.5% of the total cost of sales that is incurred on production and operation of the
job.
Managing Financial Resources8
Paraphrase This Document
Need a fresh take? Get an instant paraphrase of this document with our AI Paraphraser
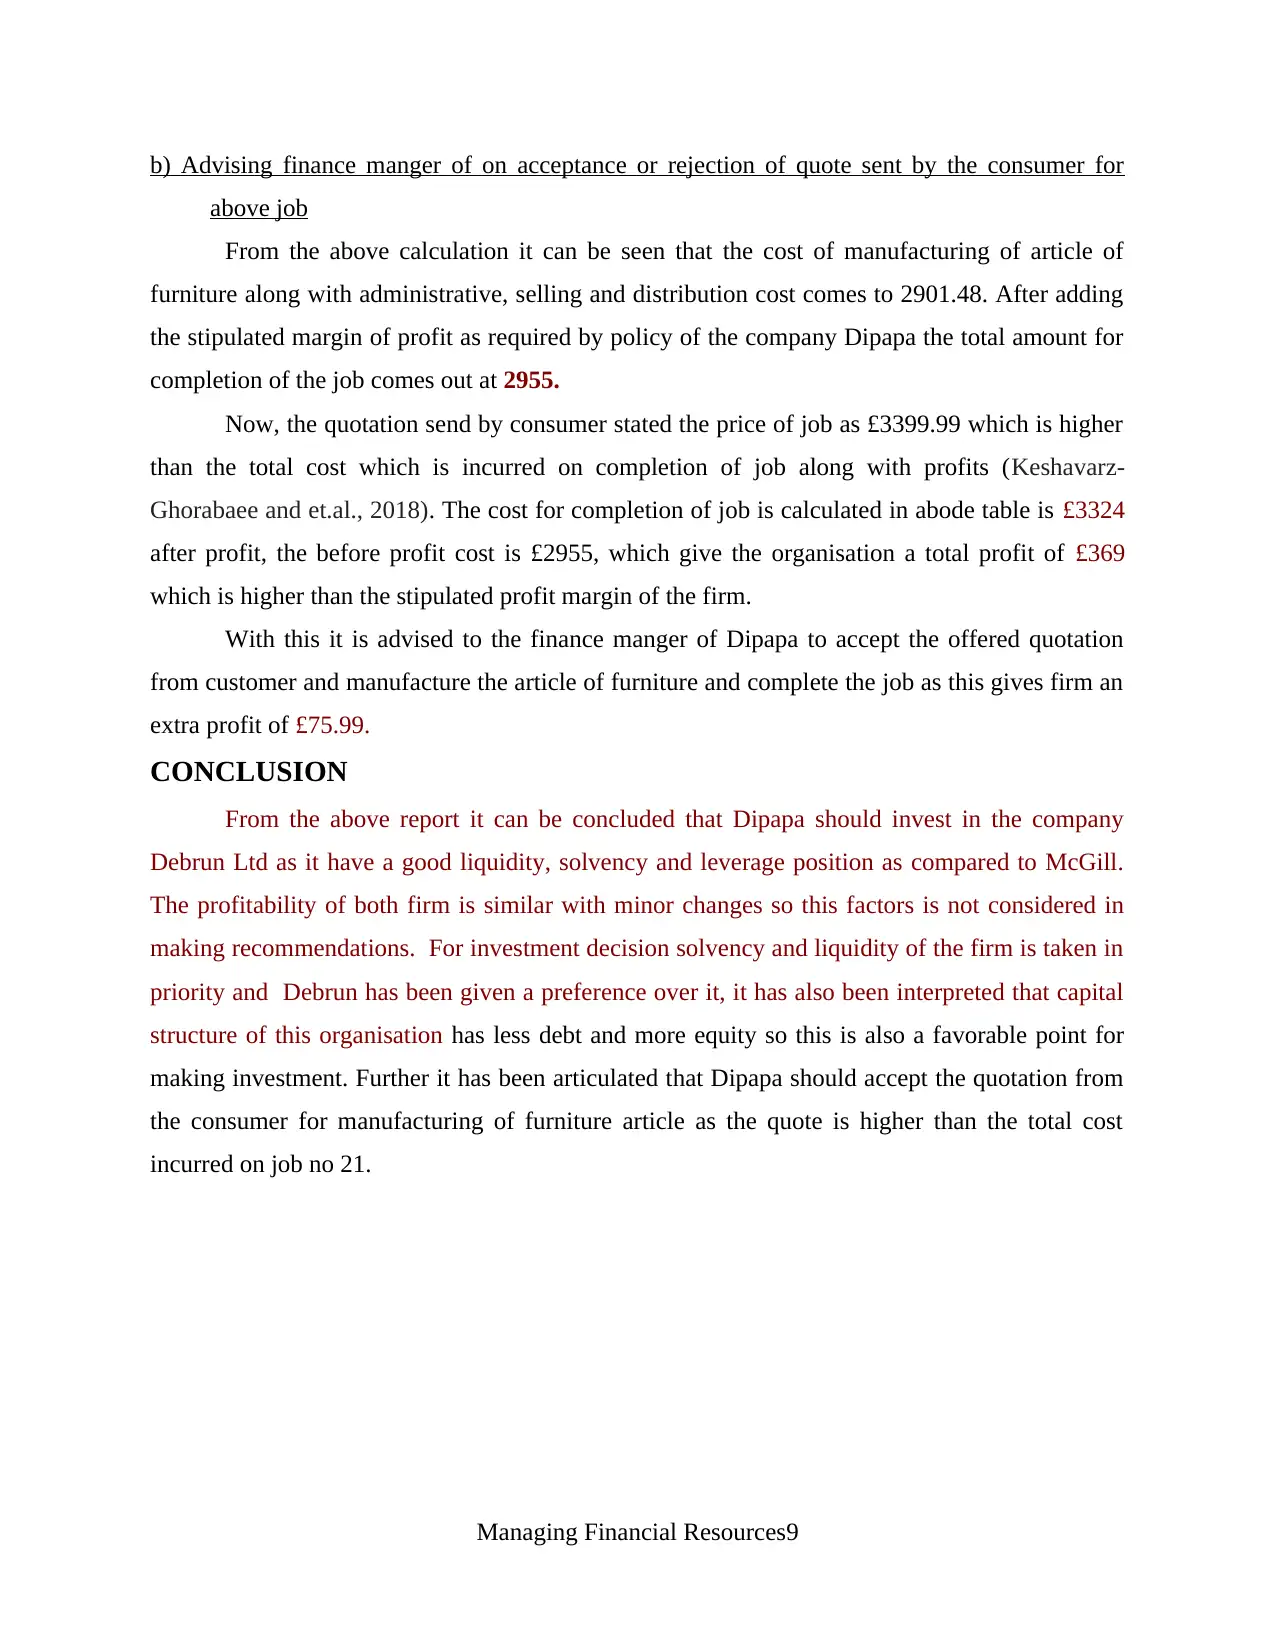
b) Advising finance manger of on acceptance or rejection of quote sent by the consumer for
above job
From the above calculation it can be seen that the cost of manufacturing of article of
furniture along with administrative, selling and distribution cost comes to 2901.48. After adding
the stipulated margin of profit as required by policy of the company Dipapa the total amount for
completion of the job comes out at 2955.
Now, the quotation send by consumer stated the price of job as £3399.99 which is higher
than the total cost which is incurred on completion of job along with profits (Keshavarz-
Ghorabaee and et.al., 2018). The cost for completion of job is calculated in abode table is £3324
after profit, the before profit cost is £2955, which give the organisation a total profit of £369
which is higher than the stipulated profit margin of the firm.
With this it is advised to the finance manger of Dipapa to accept the offered quotation
from customer and manufacture the article of furniture and complete the job as this gives firm an
extra profit of £75.99.
CONCLUSION
From the above report it can be concluded that Dipapa should invest in the company
Debrun Ltd as it have a good liquidity, solvency and leverage position as compared to McGill.
The profitability of both firm is similar with minor changes so this factors is not considered in
making recommendations. For investment decision solvency and liquidity of the firm is taken in
priority and Debrun has been given a preference over it, it has also been interpreted that capital
structure of this organisation has less debt and more equity so this is also a favorable point for
making investment. Further it has been articulated that Dipapa should accept the quotation from
the consumer for manufacturing of furniture article as the quote is higher than the total cost
incurred on job no 21.
Managing Financial Resources9
REFERENCES
Books and Journals
Dokas, I., Giokas, D. and Tsamis, A., 2014. Liquidity efficiency in the Greek listed firms: a
financial ratio based on data envelopment analysis. International Journal of Corporate
Finance and Accounting (IJCFA). 1(1). pp.40-59.
Enekwe, C. I., 2015. The relationship between financial ratio analysis and corporate
profitability: a study of selected quoted oil and gas companies in Nigeria. European
Journal of Accounting, Auditing and Finance Research. 3(2). pp.17-34.
Greco, S., Figueira, J. and Ehrgott, M., 2016. Multiple criteria decision analysis. New York:
Springer.
Keshavarz-Ghorabaee, M and et.al., 2018. An Extended Step-Wise Weight Assessment Ratio
Analysis with Symmetric Interval Type-2 Fuzzy Sets for Determining the Subjective
Weights of Criteria in Multi-Criteria Decision-Making Problems. Symmetry.10(4). p.91.
Omar, N and et.al., 2014. Financial statement fraud: A case examination using Beneish Model
and ratio analysis. International Journal of Trade, Economics and Finance. 5(2). p.184.
ONLINE
Accounts Payable Ratio. 2018. [Online]. Available through
<https://corporatefinanceinstitute.com/resources/knowledge/accounting/accounts-payable-
turnover-ratio/>.
Return on Equity. 2018. [Online]. Available through <https://investinganswers.com/financial-
dictionary/financial-statement-analysis/return-equity-roe-916>.
Managing Financial Resources10
⊘ This is a preview!⊘
Do you want full access?
Subscribe today to unlock all pages.
Trusted by 1+ million students worldwide
1 out of 12
Related Documents


Your All-in-One AI-Powered Toolkit for Academic Success.
+13062052269
info@desklib.com
Available 24*7 on WhatsApp / Email
![[object Object]](/_next/static/media/star-bottom.7253800d.svg)
Unlock your academic potential
Copyright © 2020–2026 A2Z Services. All Rights Reserved. Developed and managed by ZUCOL.