Managing Financial Resources: Event Budget Analysis and KPIs Report
VerifiedAdded on 2023/06/15
|10
|2764
|339
Report
AI Summary
This assignment provides a detailed analysis of managing financial resources, focusing on event budget preparation and key performance indicators (KPIs) within the hospitality sector. It begins with a breakdown of an event committee's budget, distinguishing between fixed and variable costs, and calculates the potential profit from the event using marginal costing techniques. The assignment then explains and illustrates several hospitality KPIs, including Average Daily Rate (ADR), Revenue per Available Room (RevPAR), Average Length of Stay (ALOS), Average Rate Index (ARI), and Market Penetration Index (MPI), providing formulas and examples for each. Finally, it discusses financial metrics such as the food cost of sales ratio, beverage cost of sales, labor cost calculation, Revenue per available seat hour and Customer Retention Rate, offering insights into their application and importance in assessing operational and financial performance within the industry.

MANAGING FINANCIAL
RESOURCES
RESOURCES
Paraphrase This Document
Need a fresh take? Get an instant paraphrase of this document with our AI Paraphraser
Table of Contents
SECTION A.....................................................................................................................................3
Question 2....................................................................................................................................3
SECTION B.....................................................................................................................................5
Question 5....................................................................................................................................5
Question 6....................................................................................................................................7
REFERENCES................................................................................................................................1
SECTION A
Question 2
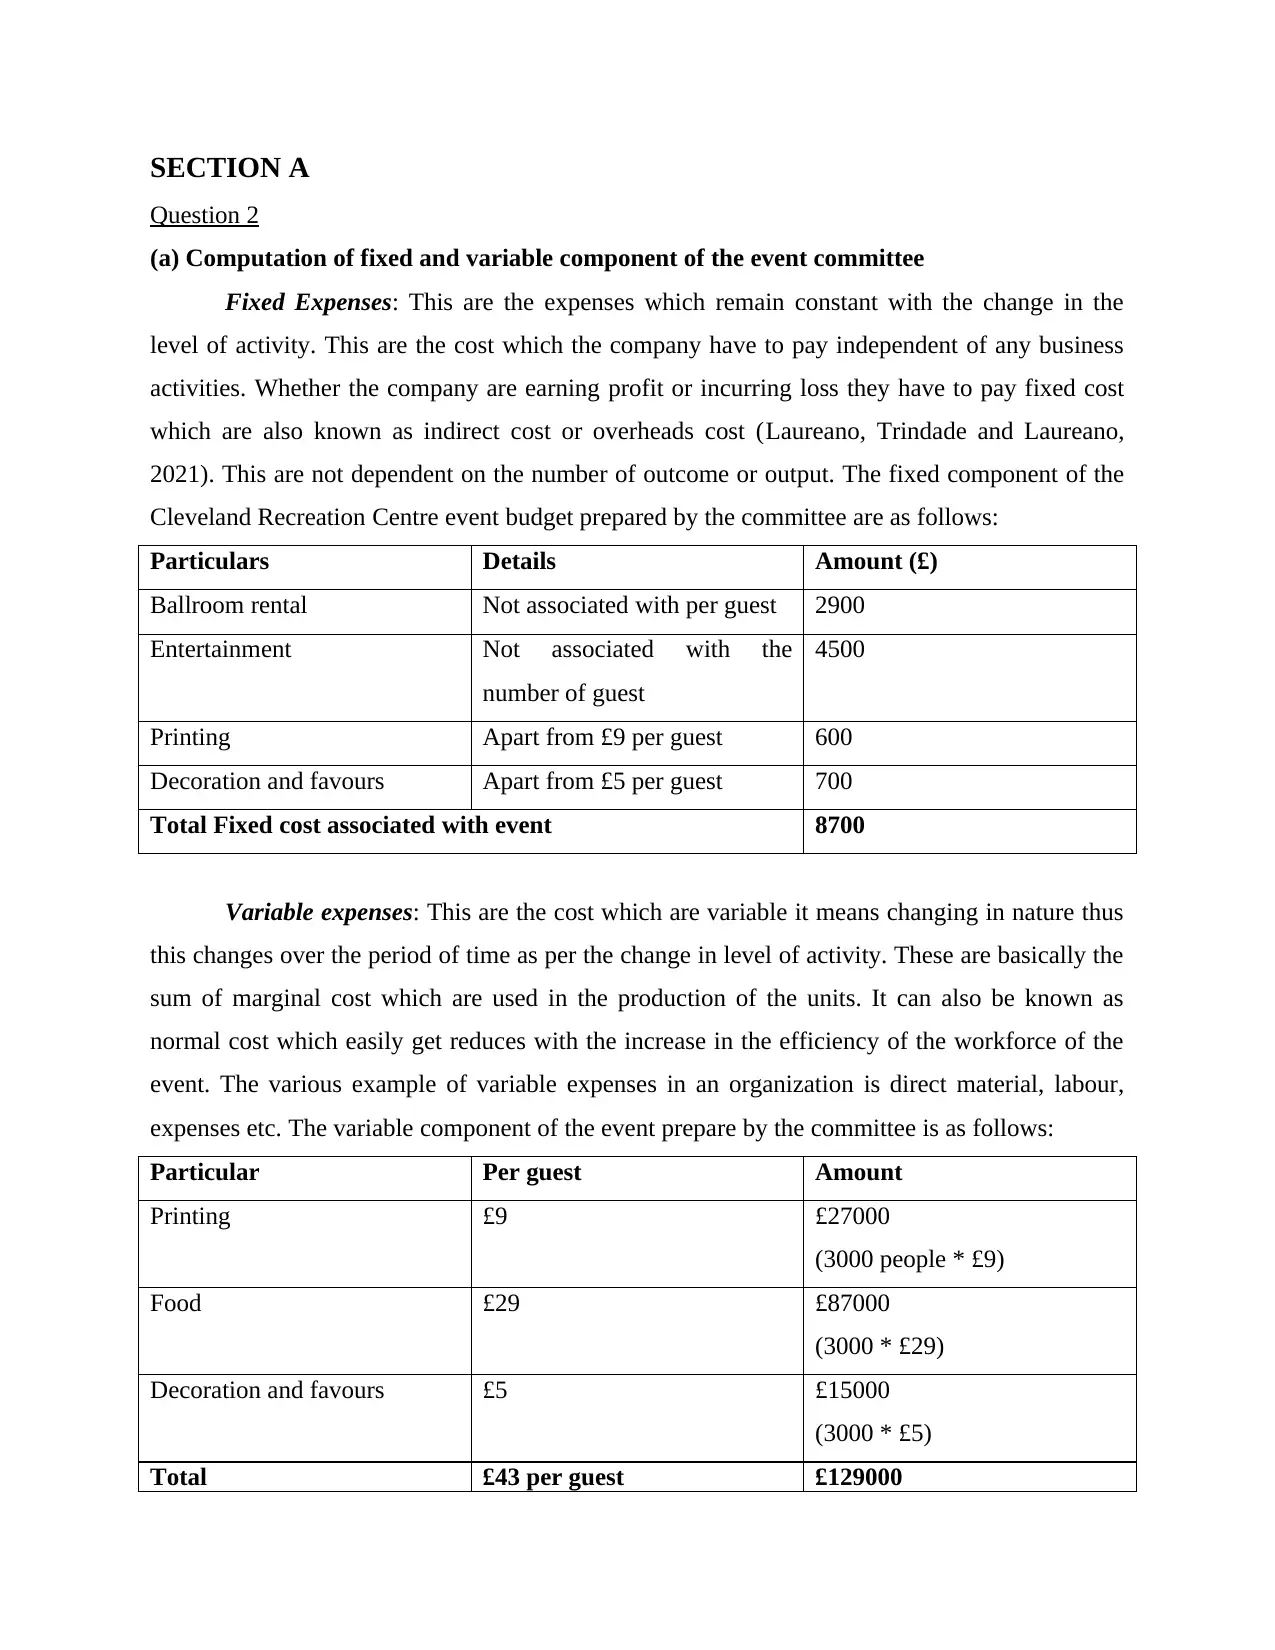
(a) Computation of fixed and variable component of the event committee
Fixed Expenses: This are the expenses which remain constant with the change in the
level of activity. This are the cost which the company have to pay independent of any business
activities. Whether the company are earning profit or incurring loss they have to pay fixed cost
which are also known as indirect cost or overheads cost (Laureano, Trindade and Laureano,
2021). This are not dependent on the number of outcome or output. The fixed component of the
Cleveland Recreation Centre event budget prepared by the committee are as follows:
Particulars Details Amount (£)
Ballroom rental Not associated with per guest 2900
Entertainment Not associated with the
number of guest
4500
Printing Apart from £9 per guest 600
Decoration and favours Apart from £5 per guest 700
Total Fixed cost associated with event 8700
Variable expenses: This are the cost which are variable it means changing in nature thus
this changes over the period of time as per the change in level of activity. These are basically the
sum of marginal cost which are used in the production of the units. It can also be known as
normal cost which easily get reduces with the increase in the efficiency of the workforce of the
event. The various example of variable expenses in an organization is direct material, labour,
expenses etc. The variable component of the event prepare by the committee is as follows:
Particular Per guest Amount
Printing £9 £27000
(3000 people * £9)
Food £29 £87000
(3000 * £29)
Decoration and favours £5 £15000
(3000 * £5)
Total £43 per guest £129000
Question 2
(a) Computation of fixed and variable component of the event committee
Fixed Expenses: This are the expenses which remain constant with the change in the
level of activity. This are the cost which the company have to pay independent of any business
activities. Whether the company are earning profit or incurring loss they have to pay fixed cost
which are also known as indirect cost or overheads cost (Laureano, Trindade and Laureano,
2021). This are not dependent on the number of outcome or output. The fixed component of the
Cleveland Recreation Centre event budget prepared by the committee are as follows:
Particulars Details Amount (£)
Ballroom rental Not associated with per guest 2900
Entertainment Not associated with the
number of guest
4500
Printing Apart from £9 per guest 600
Decoration and favours Apart from £5 per guest 700
Total Fixed cost associated with event 8700
Variable expenses: This are the cost which are variable it means changing in nature thus
this changes over the period of time as per the change in level of activity. These are basically the
sum of marginal cost which are used in the production of the units. It can also be known as
normal cost which easily get reduces with the increase in the efficiency of the workforce of the
event. The various example of variable expenses in an organization is direct material, labour,
expenses etc. The variable component of the event prepare by the committee is as follows:
Particular Per guest Amount
Printing £9 £27000
(3000 people * £9)
Food £29 £87000
(3000 * £29)
Decoration and favours £5 £15000
(3000 * £5)
Total £43 per guest £129000
⊘ This is a preview!⊘
Do you want full access?
Subscribe today to unlock all pages.
Trusted by 1+ million students worldwide
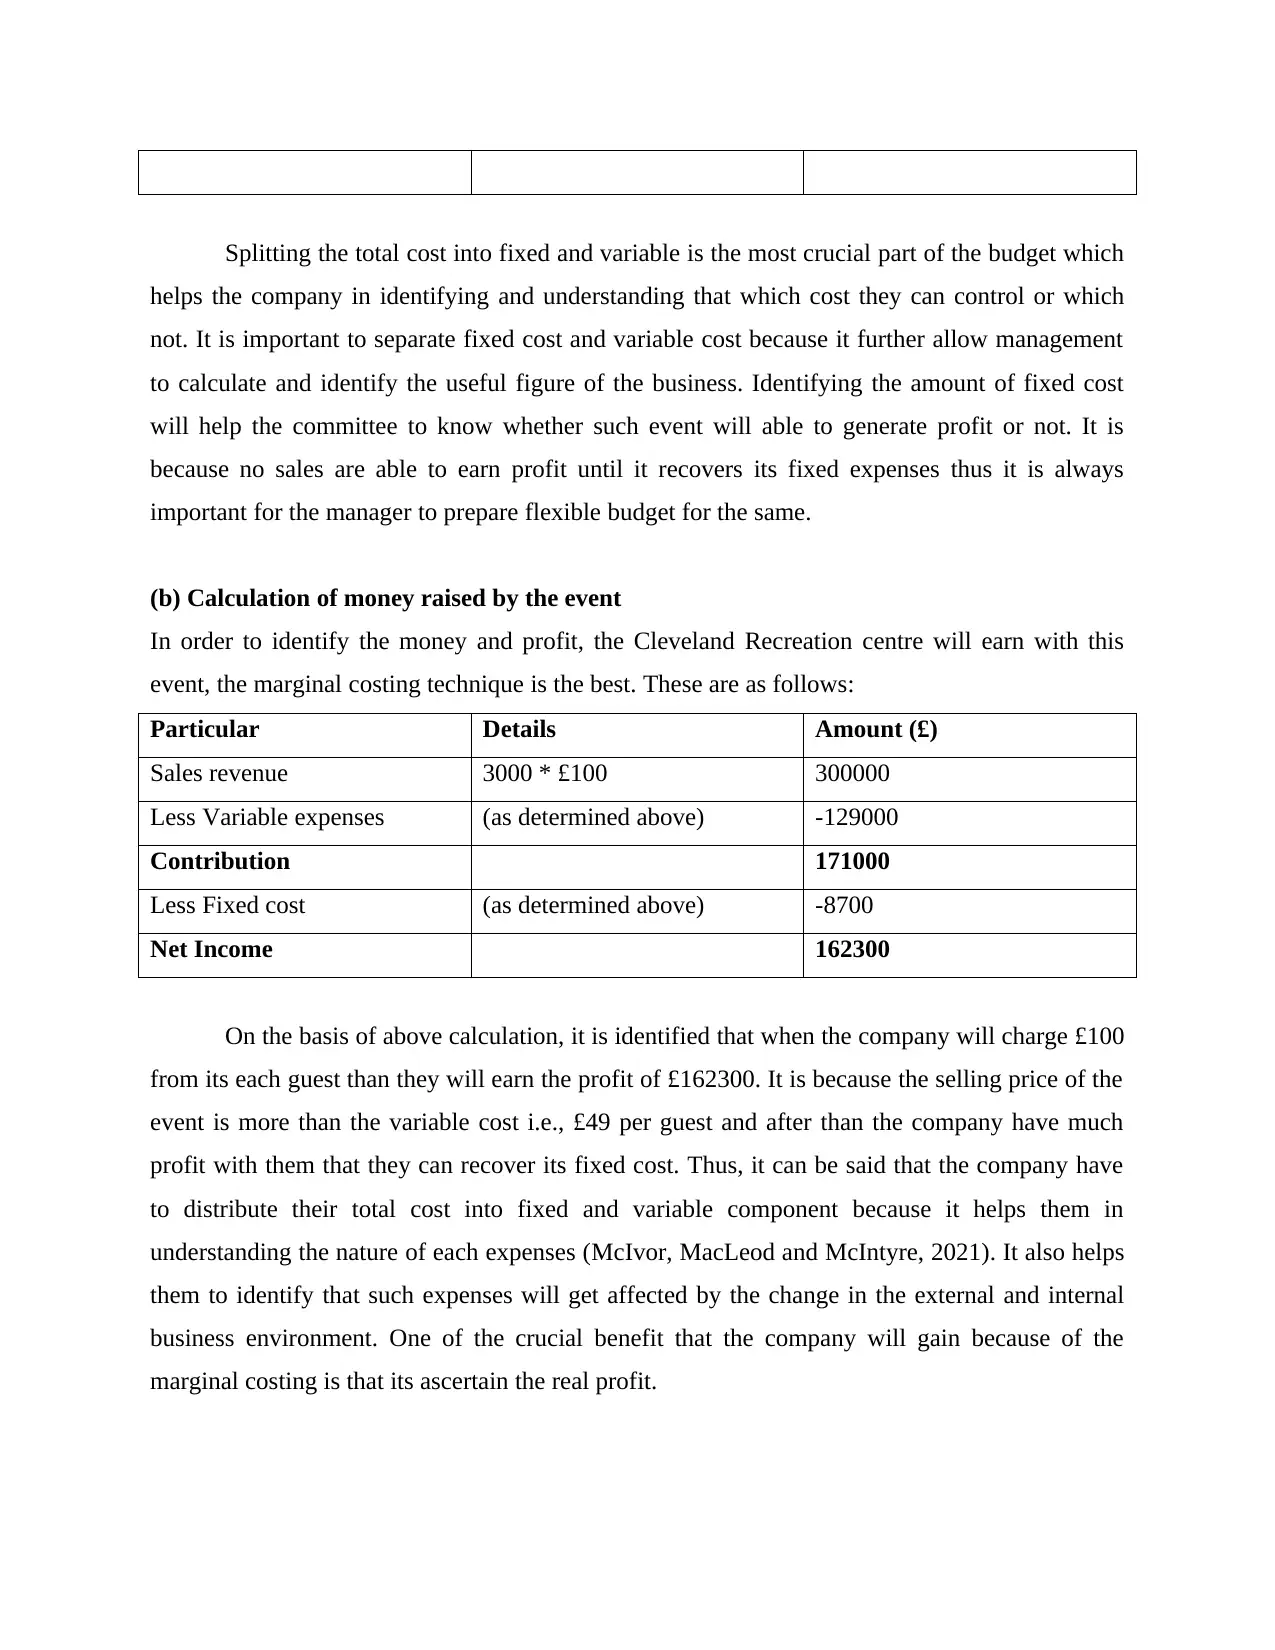
Splitting the total cost into fixed and variable is the most crucial part of the budget which
helps the company in identifying and understanding that which cost they can control or which
not. It is important to separate fixed cost and variable cost because it further allow management
to calculate and identify the useful figure of the business. Identifying the amount of fixed cost
will help the committee to know whether such event will able to generate profit or not. It is
because no sales are able to earn profit until it recovers its fixed expenses thus it is always
important for the manager to prepare flexible budget for the same.
(b) Calculation of money raised by the event
In order to identify the money and profit, the Cleveland Recreation centre will earn with this
event, the marginal costing technique is the best. These are as follows:
Particular Details Amount (£)
Sales revenue 3000 * £100 300000
Less Variable expenses (as determined above) -129000
Contribution 171000
Less Fixed cost (as determined above) -8700
Net Income 162300
On the basis of above calculation, it is identified that when the company will charge £100
from its each guest than they will earn the profit of £162300. It is because the selling price of the
event is more than the variable cost i.e., £49 per guest and after than the company have much
profit with them that they can recover its fixed cost. Thus, it can be said that the company have
to distribute their total cost into fixed and variable component because it helps them in
understanding the nature of each expenses (McIvor, MacLeod and McIntyre, 2021). It also helps
them to identify that such expenses will get affected by the change in the external and internal
business environment. One of the crucial benefit that the company will gain because of the
marginal costing is that its ascertain the real profit.
Paraphrase This Document
Need a fresh take? Get an instant paraphrase of this document with our AI Paraphraser
SECTION B
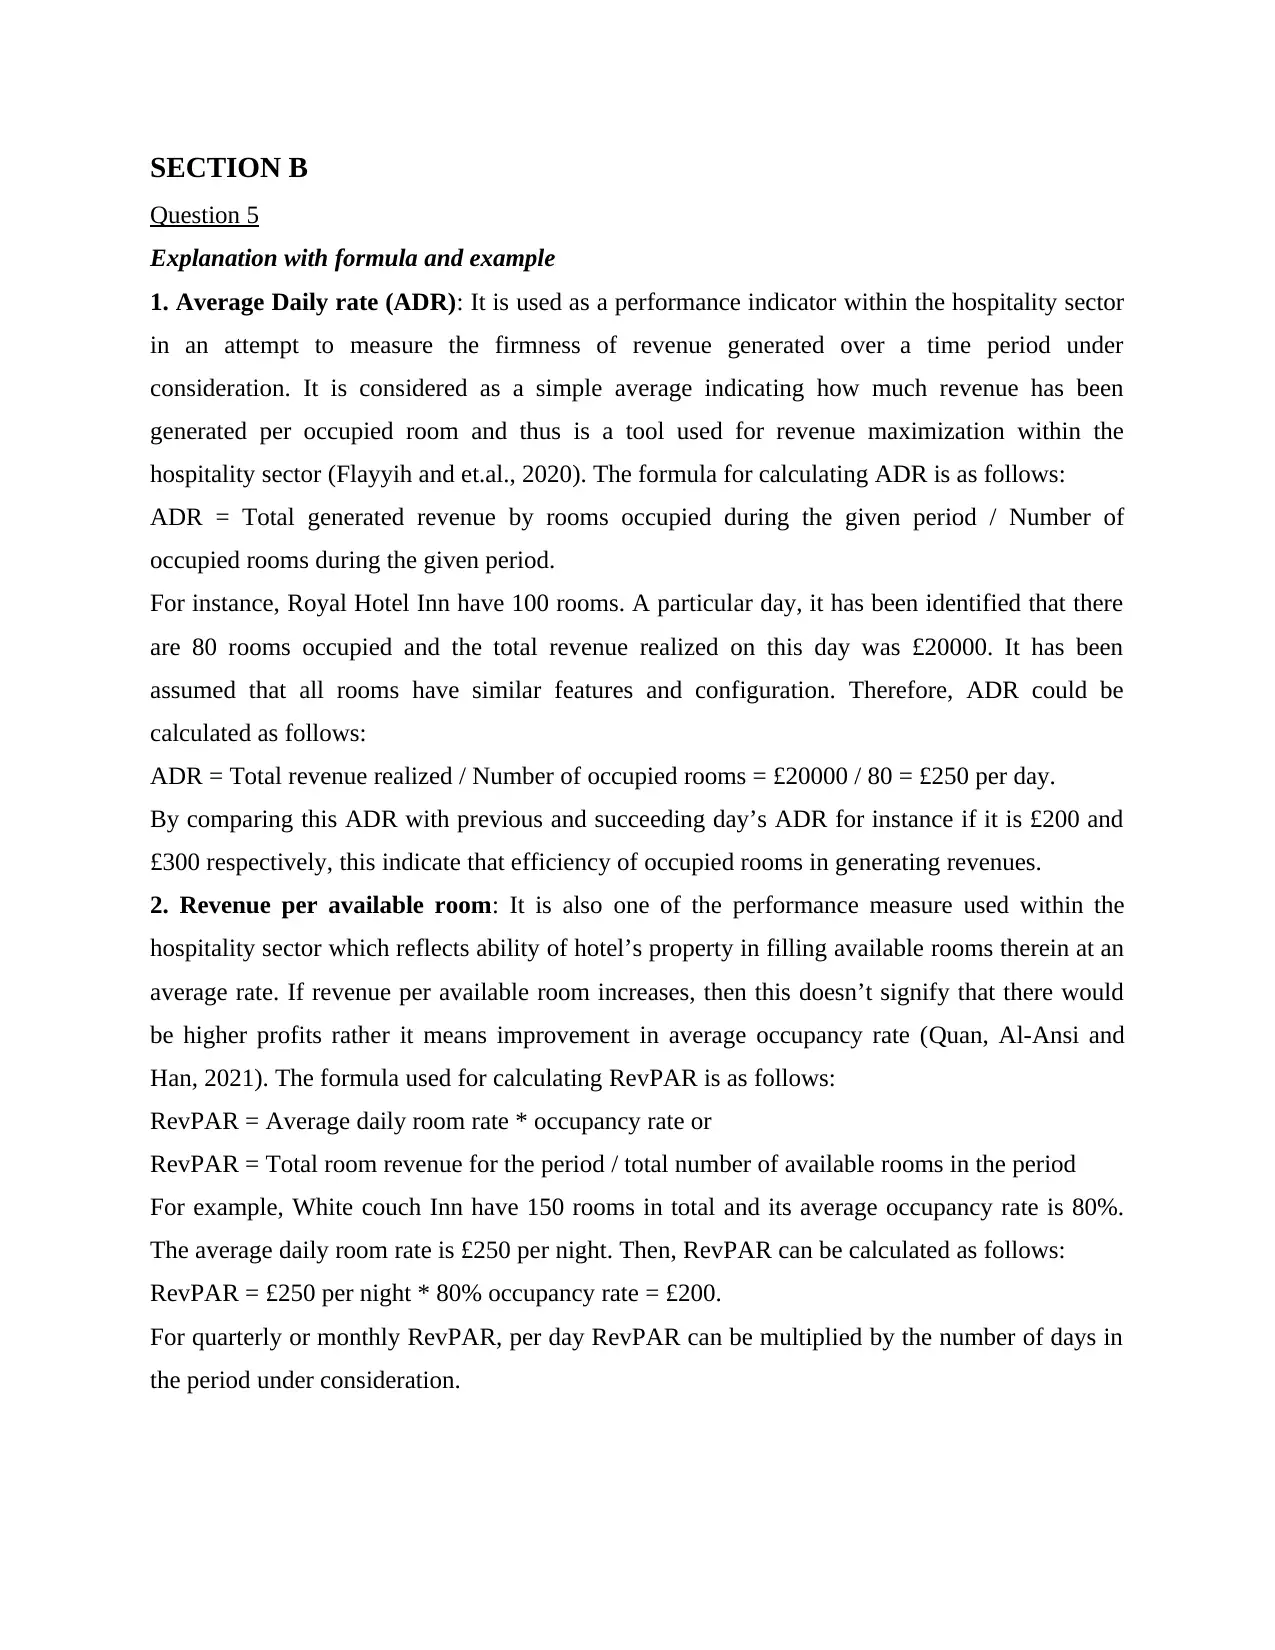
Question 5
Explanation with formula and example
1. Average Daily rate (ADR): It is used as a performance indicator within the hospitality sector
in an attempt to measure the firmness of revenue generated over a time period under
consideration. It is considered as a simple average indicating how much revenue has been
generated per occupied room and thus is a tool used for revenue maximization within the
hospitality sector (Flayyih and et.al., 2020). The formula for calculating ADR is as follows:
ADR = Total generated revenue by rooms occupied during the given period / Number of
occupied rooms during the given period.
For instance, Royal Hotel Inn have 100 rooms. A particular day, it has been identified that there
are 80 rooms occupied and the total revenue realized on this day was £20000. It has been
assumed that all rooms have similar features and configuration. Therefore, ADR could be
calculated as follows:
ADR = Total revenue realized / Number of occupied rooms = £20000 / 80 = £250 per day.
By comparing this ADR with previous and succeeding day’s ADR for instance if it is £200 and
£300 respectively, this indicate that efficiency of occupied rooms in generating revenues.
2. Revenue per available room: It is also one of the performance measure used within the
hospitality sector which reflects ability of hotel’s property in filling available rooms therein at an
average rate. If revenue per available room increases, then this doesn’t signify that there would
be higher profits rather it means improvement in average occupancy rate (Quan, Al-Ansi and
Han, 2021). The formula used for calculating RevPAR is as follows:
RevPAR = Average daily room rate * occupancy rate or
RevPAR = Total room revenue for the period / total number of available rooms in the period
For example, White couch Inn have 150 rooms in total and its average occupancy rate is 80%.
The average daily room rate is £250 per night. Then, RevPAR can be calculated as follows:
RevPAR = £250 per night * 80% occupancy rate = £200.
For quarterly or monthly RevPAR, per day RevPAR can be multiplied by the number of days in
the period under consideration.
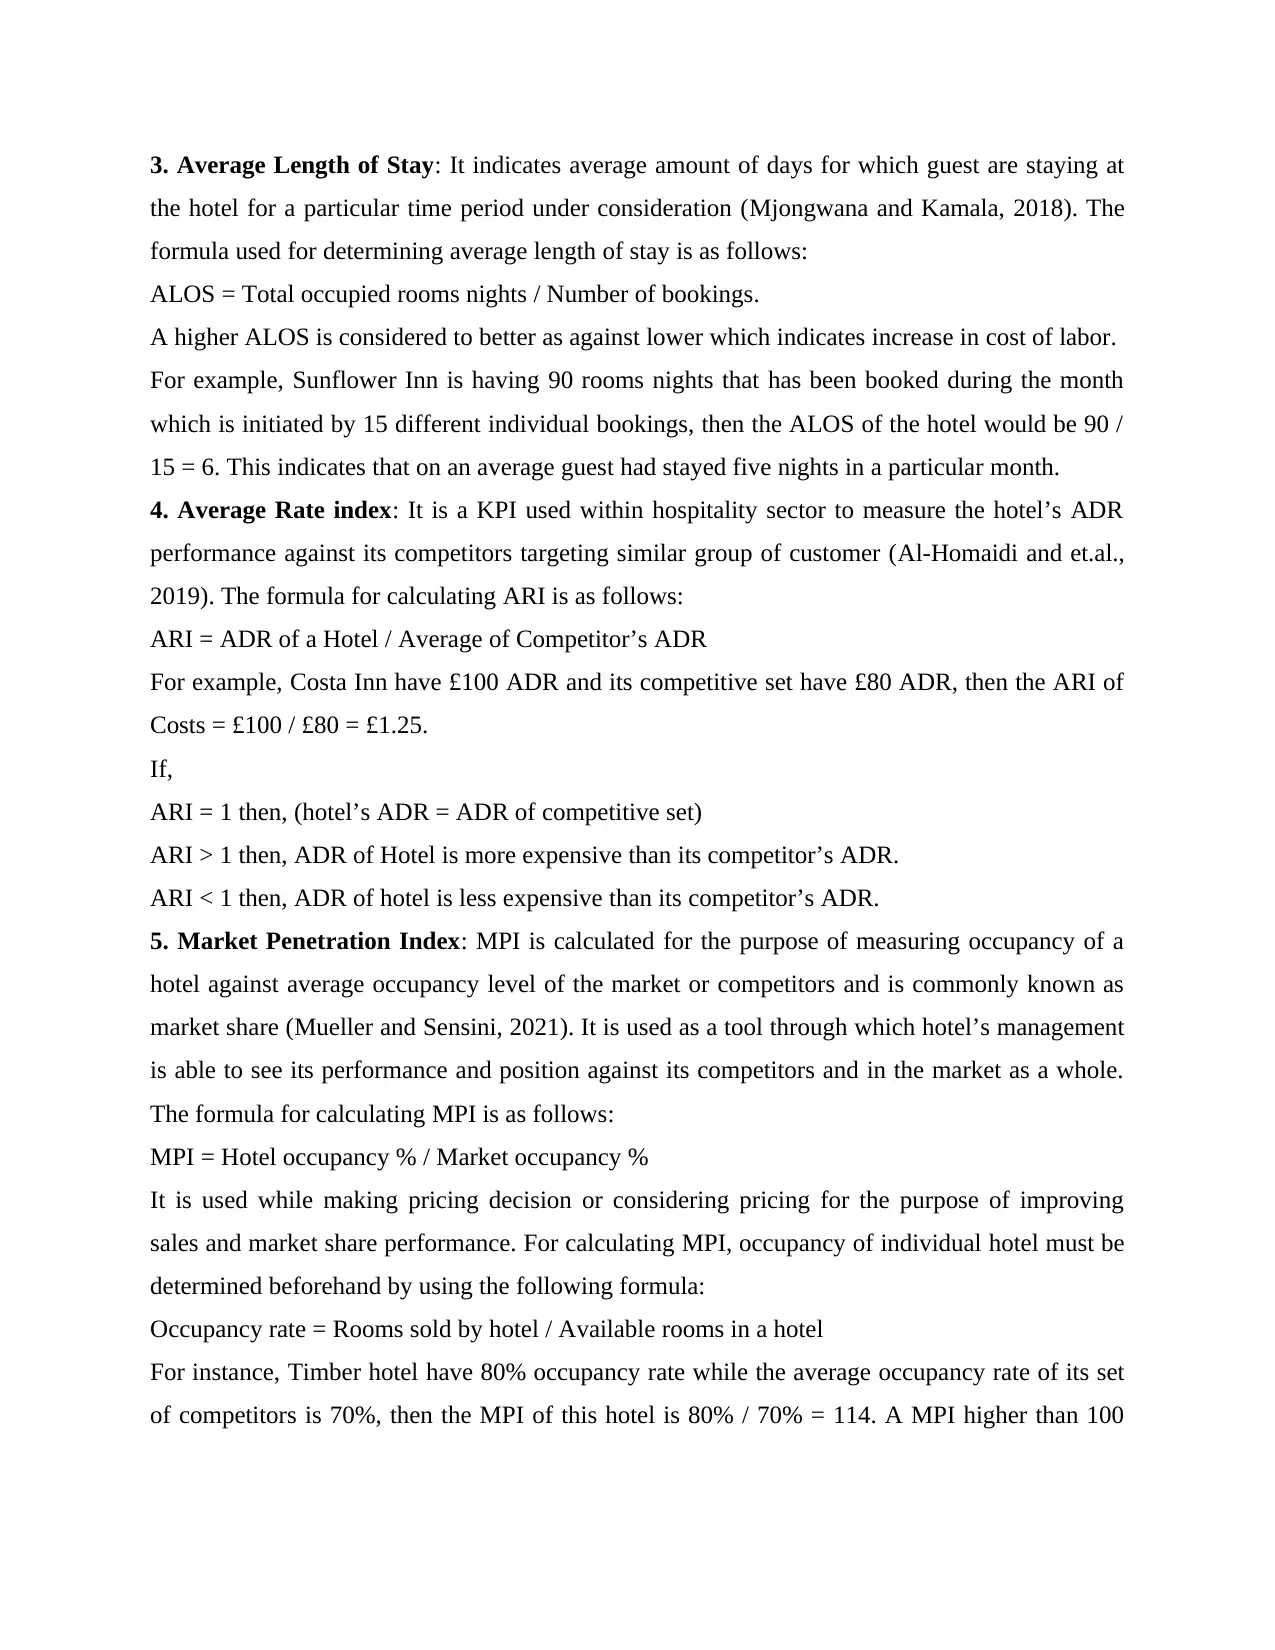
3. Average Length of Stay: It indicates average amount of days for which guest are staying at
the hotel for a particular time period under consideration (Mjongwana and Kamala, 2018). The
formula used for determining average length of stay is as follows:
ALOS = Total occupied rooms nights / Number of bookings.
A higher ALOS is considered to better as against lower which indicates increase in cost of labor.
For example, Sunflower Inn is having 90 rooms nights that has been booked during the month
which is initiated by 15 different individual bookings, then the ALOS of the hotel would be 90 /
15 = 6. This indicates that on an average guest had stayed five nights in a particular month.
4. Average Rate index: It is a KPI used within hospitality sector to measure the hotel’s ADR
performance against its competitors targeting similar group of customer (Al-Homaidi and et.al.,
2019). The formula for calculating ARI is as follows:
ARI = ADR of a Hotel / Average of Competitor’s ADR
For example, Costa Inn have £100 ADR and its competitive set have £80 ADR, then the ARI of
Costs = £100 / £80 = £1.25.
If,
ARI = 1 then, (hotel’s ADR = ADR of competitive set)
ARI > 1 then, ADR of Hotel is more expensive than its competitor’s ADR.
ARI < 1 then, ADR of hotel is less expensive than its competitor’s ADR.
5. Market Penetration Index: MPI is calculated for the purpose of measuring occupancy of a
hotel against average occupancy level of the market or competitors and is commonly known as
market share (Mueller and Sensini, 2021). It is used as a tool through which hotel’s management
is able to see its performance and position against its competitors and in the market as a whole.
The formula for calculating MPI is as follows:
MPI = Hotel occupancy % / Market occupancy %
It is used while making pricing decision or considering pricing for the purpose of improving
sales and market share performance. For calculating MPI, occupancy of individual hotel must be
determined beforehand by using the following formula:
Occupancy rate = Rooms sold by hotel / Available rooms in a hotel
For instance, Timber hotel have 80% occupancy rate while the average occupancy rate of its set
of competitors is 70%, then the MPI of this hotel is 80% / 70% = 114. A MPI higher than 100
⊘ This is a preview!⊘
Do you want full access?
Subscribe today to unlock all pages.
Trusted by 1+ million students worldwide
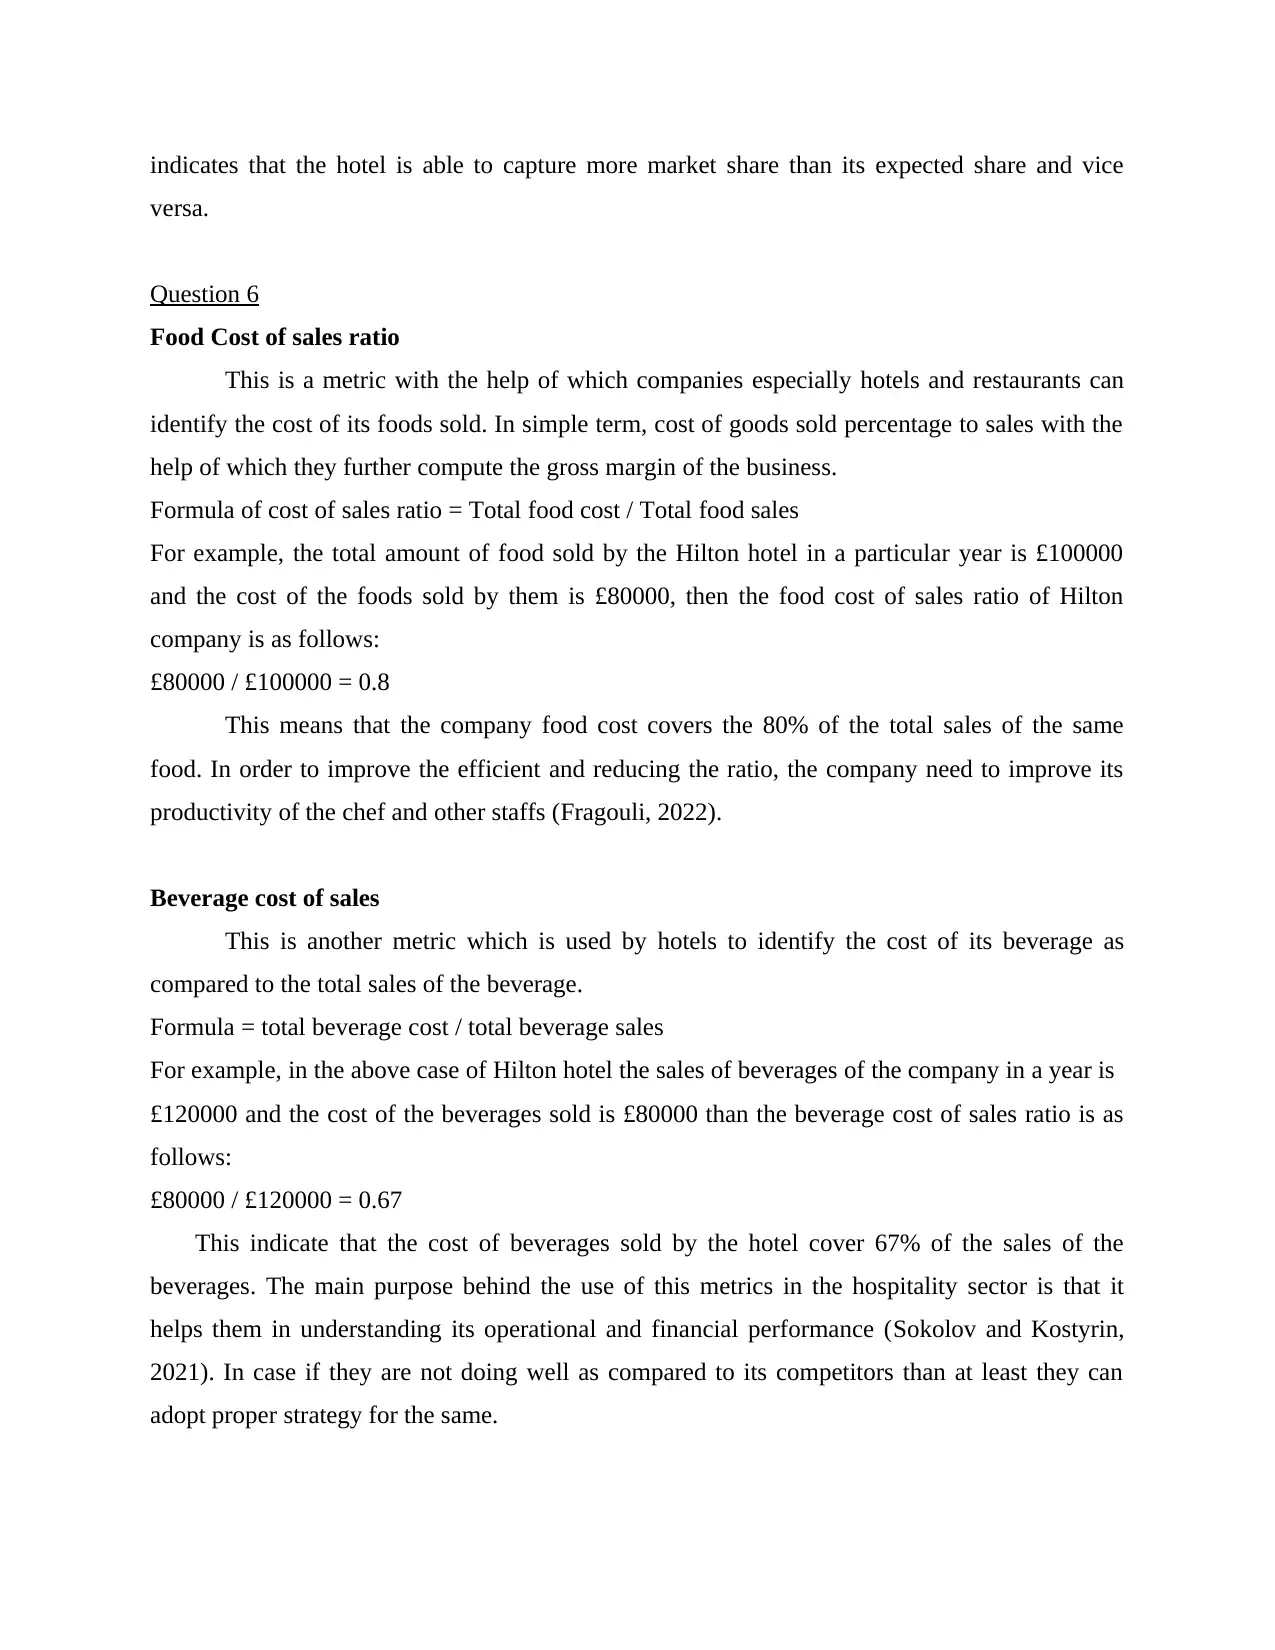
indicates that the hotel is able to capture more market share than its expected share and vice
versa.
Question 6
Food Cost of sales ratio
This is a metric with the help of which companies especially hotels and restaurants can
identify the cost of its foods sold. In simple term, cost of goods sold percentage to sales with the
help of which they further compute the gross margin of the business.
Formula of cost of sales ratio = Total food cost / Total food sales
For example, the total amount of food sold by the Hilton hotel in a particular year is £100000
and the cost of the foods sold by them is £80000, then the food cost of sales ratio of Hilton
company is as follows:
£80000 / £100000 = 0.8
This means that the company food cost covers the 80% of the total sales of the same
food. In order to improve the efficient and reducing the ratio, the company need to improve its
productivity of the chef and other staffs (Fragouli, 2022).
Beverage cost of sales
This is another metric which is used by hotels to identify the cost of its beverage as
compared to the total sales of the beverage.
Formula = total beverage cost / total beverage sales
For example, in the above case of Hilton hotel the sales of beverages of the company in a year is
£120000 and the cost of the beverages sold is £80000 than the beverage cost of sales ratio is as
follows:
£80000 / £120000 = 0.67
This indicate that the cost of beverages sold by the hotel cover 67% of the sales of the
beverages. The main purpose behind the use of this metrics in the hospitality sector is that it
helps them in understanding its operational and financial performance (Sokolov and Kostyrin,
2021). In case if they are not doing well as compared to its competitors than at least they can
adopt proper strategy for the same.
Paraphrase This Document
Need a fresh take? Get an instant paraphrase of this document with our AI Paraphraser
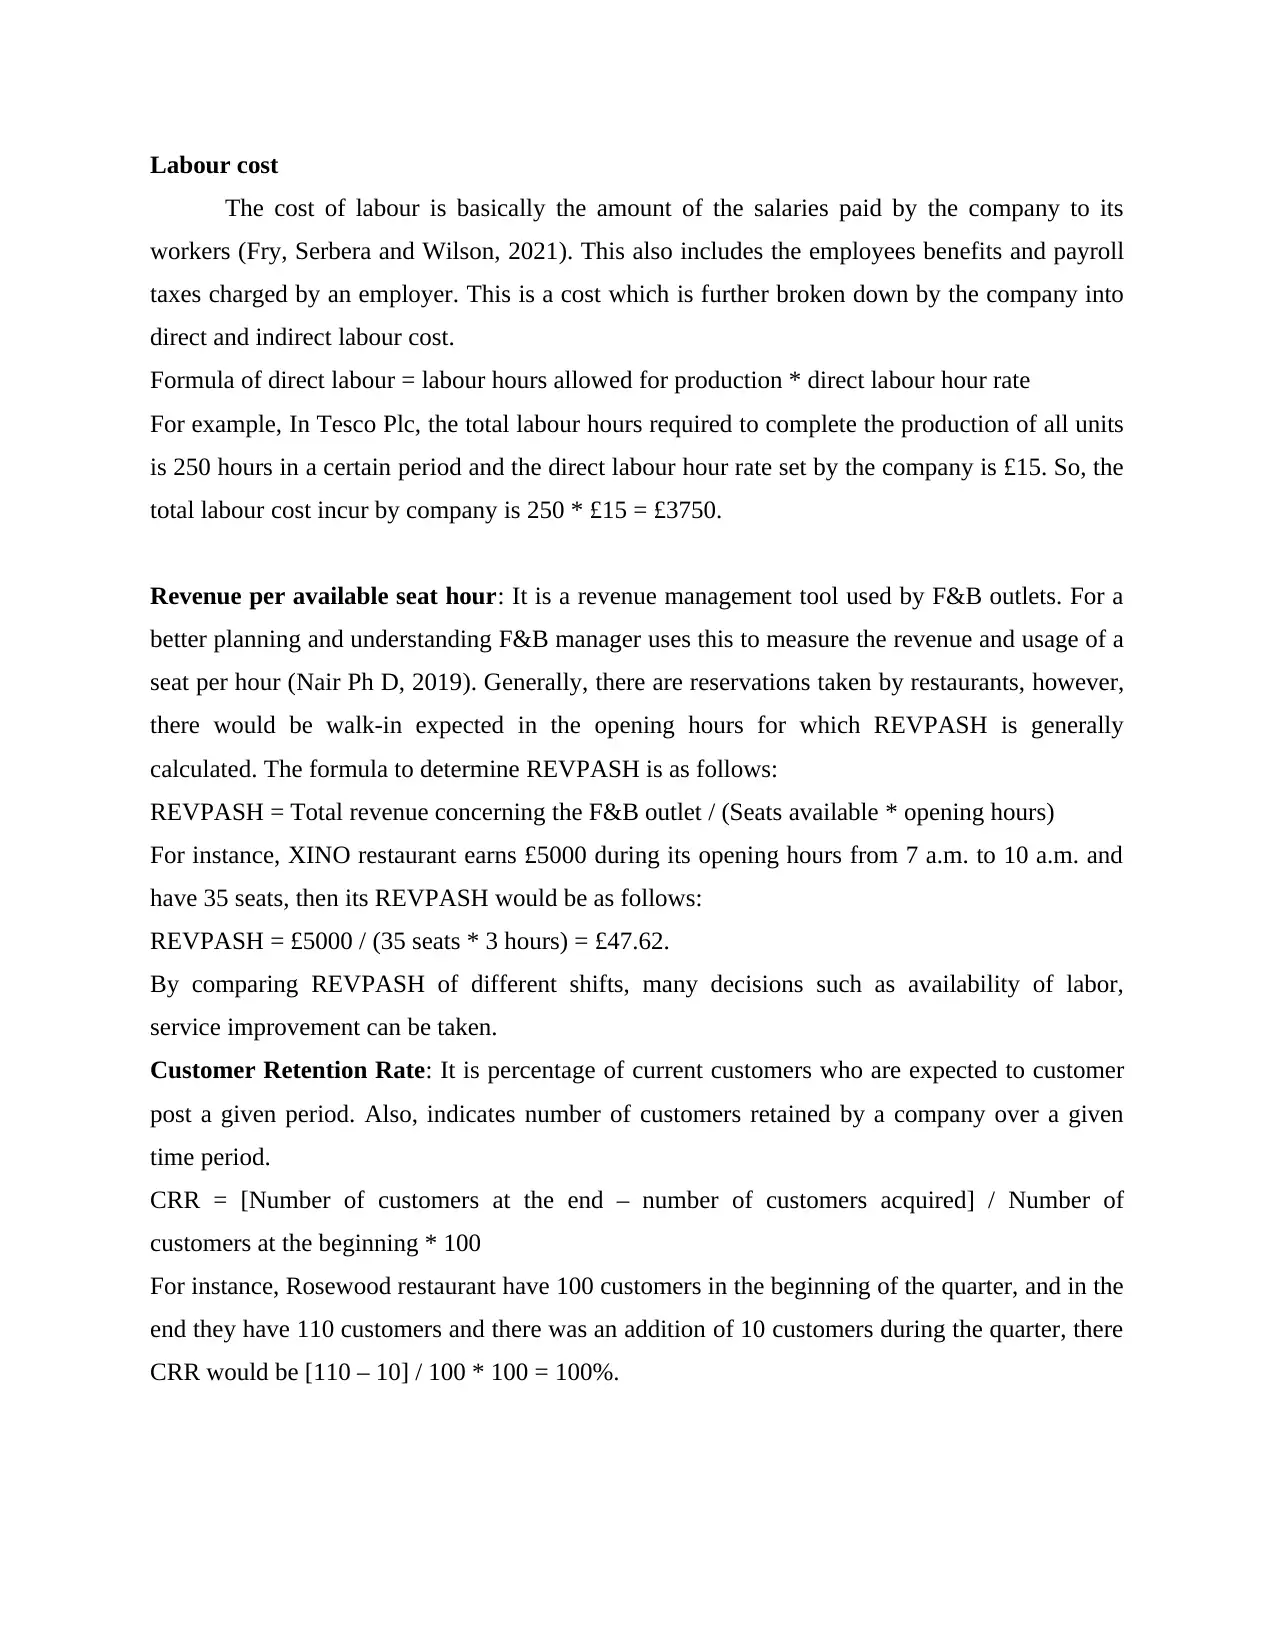
Labour cost
The cost of labour is basically the amount of the salaries paid by the company to its
workers (Fry, Serbera and Wilson, 2021). This also includes the employees benefits and payroll
taxes charged by an employer. This is a cost which is further broken down by the company into
direct and indirect labour cost.
Formula of direct labour = labour hours allowed for production * direct labour hour rate
For example, In Tesco Plc, the total labour hours required to complete the production of all units
is 250 hours in a certain period and the direct labour hour rate set by the company is £15. So, the
total labour cost incur by company is 250 * £15 = £3750.
Revenue per available seat hour: It is a revenue management tool used by F&B outlets. For a
better planning and understanding F&B manager uses this to measure the revenue and usage of a
seat per hour (Nair Ph D, 2019). Generally, there are reservations taken by restaurants, however,
there would be walk-in expected in the opening hours for which REVPASH is generally
calculated. The formula to determine REVPASH is as follows:
REVPASH = Total revenue concerning the F&B outlet / (Seats available * opening hours)
For instance, XINO restaurant earns £5000 during its opening hours from 7 a.m. to 10 a.m. and
have 35 seats, then its REVPASH would be as follows:
REVPASH = £5000 / (35 seats * 3 hours) = £47.62.
By comparing REVPASH of different shifts, many decisions such as availability of labor,
service improvement can be taken.
Customer Retention Rate: It is percentage of current customers who are expected to customer
post a given period. Also, indicates number of customers retained by a company over a given
time period.
CRR = [Number of customers at the end – number of customers acquired] / Number of
customers at the beginning * 100
For instance, Rosewood restaurant have 100 customers in the beginning of the quarter, and in the
end they have 110 customers and there was an addition of 10 customers during the quarter, there
CRR would be [110 – 10] / 100 * 100 = 100%.
REFERENCES
Books and journals
Laureano, R. M., Trindade, G. and Laureano, L. M., 2021, June. Predictive models for managing
financial incentives oriented to companies: Application to Portugal 2020. In 2021 16th
Iberian Conference on Information Systems and Technologies (CISTI) (pp. 1-6). IEEE.
McIvor, J. G., MacLeod, N. D. and McIntyre, S., 2021. Managing Grassy Woodlands: Balancing
Production and Conservation of Resources.
Fragouli, E., 2022. MANAGING LOCAL RESOURCES & CHALLENGES FOR
INTERNATIONAL COMPANIES. International Journal of Information, Business and
Management. 14(1). pp.103-127.
Sokolov, E. V. and Kostyrin, E. V., 2021, September. Economic effect of managing the
development of the domestic healthcare system on the basis of medical savings accounts.
In 2021 14th International Conference Management of large-scale system development
(MLSD) (pp. 1-5). IEEE.
Fry, J., Serbera, J. P. and Wilson, R., 2021. Managing performance expectations in association
football. Journal of Business Research. 135. pp.445-453.
Nair Ph D, G. K., 2019. Dynamics of learning orientation, innovativeness, and financial
performance of the hotel industry. Journal of Hospitality Financial Management, 27(1),
p.4.
Mueller, A. and Sensini, L., 2021. Determinants of Financing Decisions of SMEs: Evidence
from Hotel Industry. International Journal of Business and Management, 16(3), pp.117-
127.
Al-Homaidi, E. A., and et.al., 2019. Impact of corporate governance mechanisms on financial
performance of hotel companies: Empirical evidence from India. African Journal of
Hospitality, Tourism and Leisure, 8(2), pp.1-21.
Mjongwana, A. and Kamala, P. N., 2018. Non-financial performance measurement by small and
medium sized enterprises operating in the hotel industry in the city of Cape
Town. African Journal of Hospitality, Tourism and Leisure, 7(1), pp.1-26.
Quan, L., Al-Ansi, A. and Han, H., 2021. Assessing customer financial risk perception and
attitude in the hotel industry: Exploring the role of protective measures against COVID-
19. International Journal of Hospitality Management, p.103123.
1
⊘ This is a preview!⊘
Do you want full access?
Subscribe today to unlock all pages.
Trusted by 1+ million students worldwide

Flayyih, H. H., and et.al., 2020. Integration of the system of Activity Based Costing and liability
accounting. Integration, 1(2), pp.1-9.
2
accounting. Integration, 1(2), pp.1-9.
2
1 out of 10
Related Documents


Your All-in-One AI-Powered Toolkit for Academic Success.
+13062052269
info@desklib.com
Available 24*7 on WhatsApp / Email
![[object Object]](/_next/static/media/star-bottom.7253800d.svg)
Unlock your academic potential
Copyright © 2020–2026 A2Z Services. All Rights Reserved. Developed and managed by ZUCOL.