Managing Financial Resources and Decision Making Report, Finance
VerifiedAdded on 2020/01/07
|20
|3936
|183
Report
AI Summary
This report comprehensively examines financial resource management and decision-making, providing an in-depth analysis of various financial concepts. The report begins by identifying and evaluating different sources of finance available to businesses, including equity, debentures, bank loans, and retained earnings, along with their implications. It then delves into financial planning, emphasizing its importance and the information needs of different decision-makers. The report includes an analysis of budgets, calculation of unit costs, and a review of project evaluation methods, such as payback period, ARR, IRR, and NPV. Furthermore, it presents financial statements for various business structures, including partnerships, sole traders, and companies, along with a detailed ratio analysis. The report utilizes tables, figures, and real-world examples to illustrate key financial concepts and provide practical insights into financial decision-making. The report concludes by summarizing key findings and recommendations for effective financial management.
MANAGING FINANCIAL
RESOURCES AND DECISIOSN
MAKING
RESOURCES AND DECISIOSN
MAKING
Paraphrase This Document
Need a fresh take? Get an instant paraphrase of this document with our AI Paraphraser
TABLE OF CONTENT
INTRODUCTION...........................................................................................................................3
TASK 1............................................................................................................................................3
1.1 Sources of finance that are available to business firms.........................................................3
1.2 Implications of source of finance..........................................................................................3
1.3 Appropriate source of finance for the firm............................................................................4
TASK 2............................................................................................................................................5
2.1 Cost of different source of finance........................................................................................5
2.2 Importance of financial planning...........................................................................................5
2.3 Information needs of different decision makers....................................................................6
2.4 Impact of finance of financial statements..............................................................................7
TASK 3............................................................................................................................................7
3.1 Analysis of budget.................................................................................................................7
3.2 Calculation of unit cost.........................................................................................................8
3.3 Project evaluation methods....................................................................................................8
TASK 4..........................................................................................................................................10
4.1Finanicial statements of the firms.........................................................................................10
4.2 Financial statements.............................................................................................................11
4.3 Financial ratios.....................................................................................................................16
CONCLUSION..............................................................................................................................17
REFRENCES.................................................................................................................................18
Table 1: Analysis of cash budget.....................................................................................................8
Table 2 Payback period method......................................................................................................9
Table 3Calculation of ARR...........................................................................................................10
Table 4Calcualtion of IRR.............................................................................................................10
Table 5Calculaiton of NPV...........................................................................................................10
Table 6 Balance sheet of partners..................................................................................................12
Table 7 income statement of partners............................................................................................13
Table 8 Income statement of sole trader........................................................................................13
Table 9 Balance sheet of sole trader..............................................................................................14
Table 10 Balance sheet of company..............................................................................................15
Table 11 Income statement of sole trader......................................................................................15
Table 12 Income statement of Non-profit organization................................................................16
Table 13 Balance sheet of company..............................................................................................17
Table 14: Ratio analysis of Tesco for FY 2013-15........................................................................17
Figure 1Balance sheet of partners..................................................................................................12
Figure 2 income statement of partners...........................................................................................13
Figure 3Income statement of sole trader.......................................................................................13
Figure 4Balance sheet of sole trader..............................................................................................14
Figure 5Balance sheet of company................................................................................................15
Figure 6 Income statement of sole trader......................................................................................15
Figure 7 Income statement of Non-profit organization.................................................................16
Figure 8 Balance sheet of company...............................................................................................17
⊘ This is a preview!⊘
Do you want full access?
Subscribe today to unlock all pages.
Trusted by 1+ million students worldwide
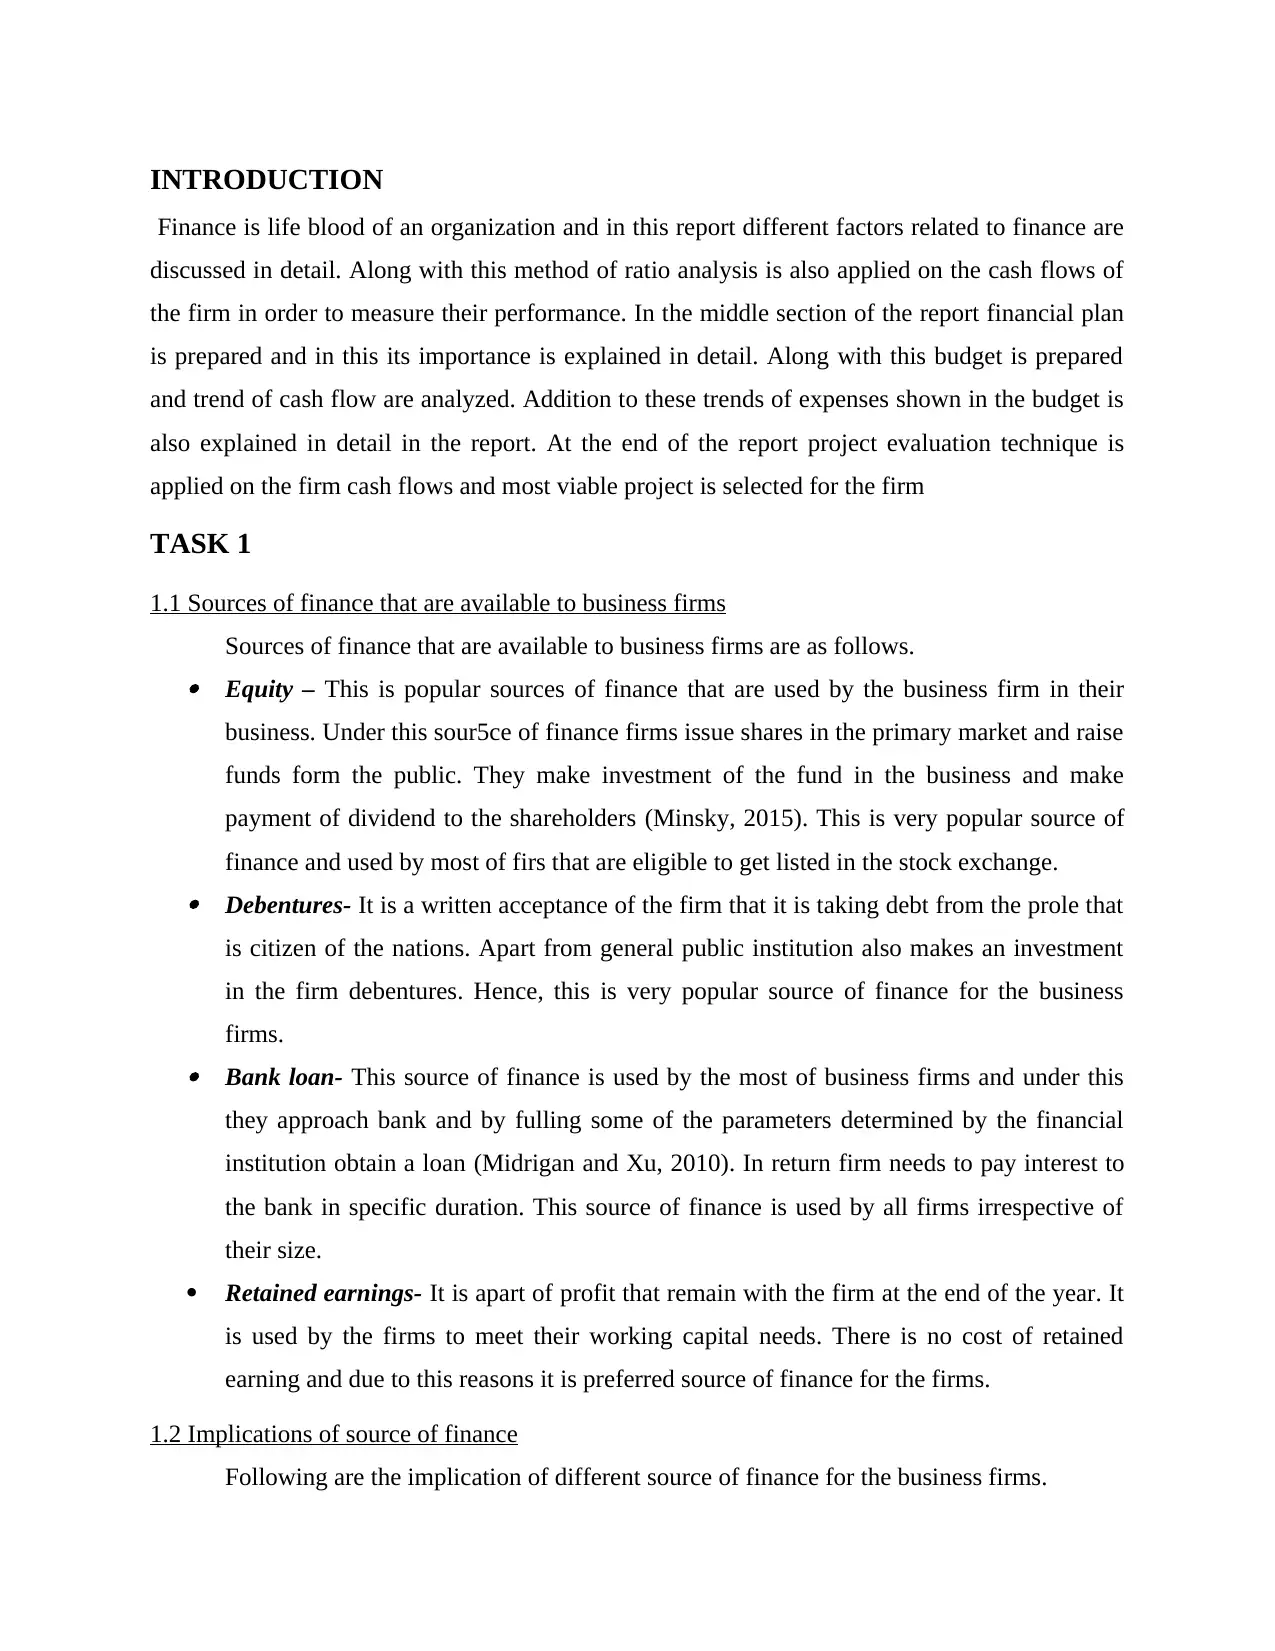
INTRODUCTION
Finance is life blood of an organization and in this report different factors related to finance are
discussed in detail. Along with this method of ratio analysis is also applied on the cash flows of
the firm in order to measure their performance. In the middle section of the report financial plan
is prepared and in this its importance is explained in detail. Along with this budget is prepared
and trend of cash flow are analyzed. Addition to these trends of expenses shown in the budget is
also explained in detail in the report. At the end of the report project evaluation technique is
applied on the firm cash flows and most viable project is selected for the firm
TASK 1
1.1 Sources of finance that are available to business firms
Sources of finance that are available to business firms are as follows. Equity – This is popular sources of finance that are used by the business firm in their
business. Under this sour5ce of finance firms issue shares in the primary market and raise
funds form the public. They make investment of the fund in the business and make
payment of dividend to the shareholders (Minsky, 2015). This is very popular source of
finance and used by most of firs that are eligible to get listed in the stock exchange. Debentures- It is a written acceptance of the firm that it is taking debt from the prole that
is citizen of the nations. Apart from general public institution also makes an investment
in the firm debentures. Hence, this is very popular source of finance for the business
firms. Bank loan- This source of finance is used by the most of business firms and under this
they approach bank and by fulling some of the parameters determined by the financial
institution obtain a loan (Midrigan and Xu, 2010). In return firm needs to pay interest to
the bank in specific duration. This source of finance is used by all firms irrespective of
their size.
Retained earnings- It is apart of profit that remain with the firm at the end of the year. It
is used by the firms to meet their working capital needs. There is no cost of retained
earning and due to this reasons it is preferred source of finance for the firms.
1.2 Implications of source of finance
Following are the implication of different source of finance for the business firms.
Paraphrase This Document
Need a fresh take? Get an instant paraphrase of this document with our AI Paraphraser
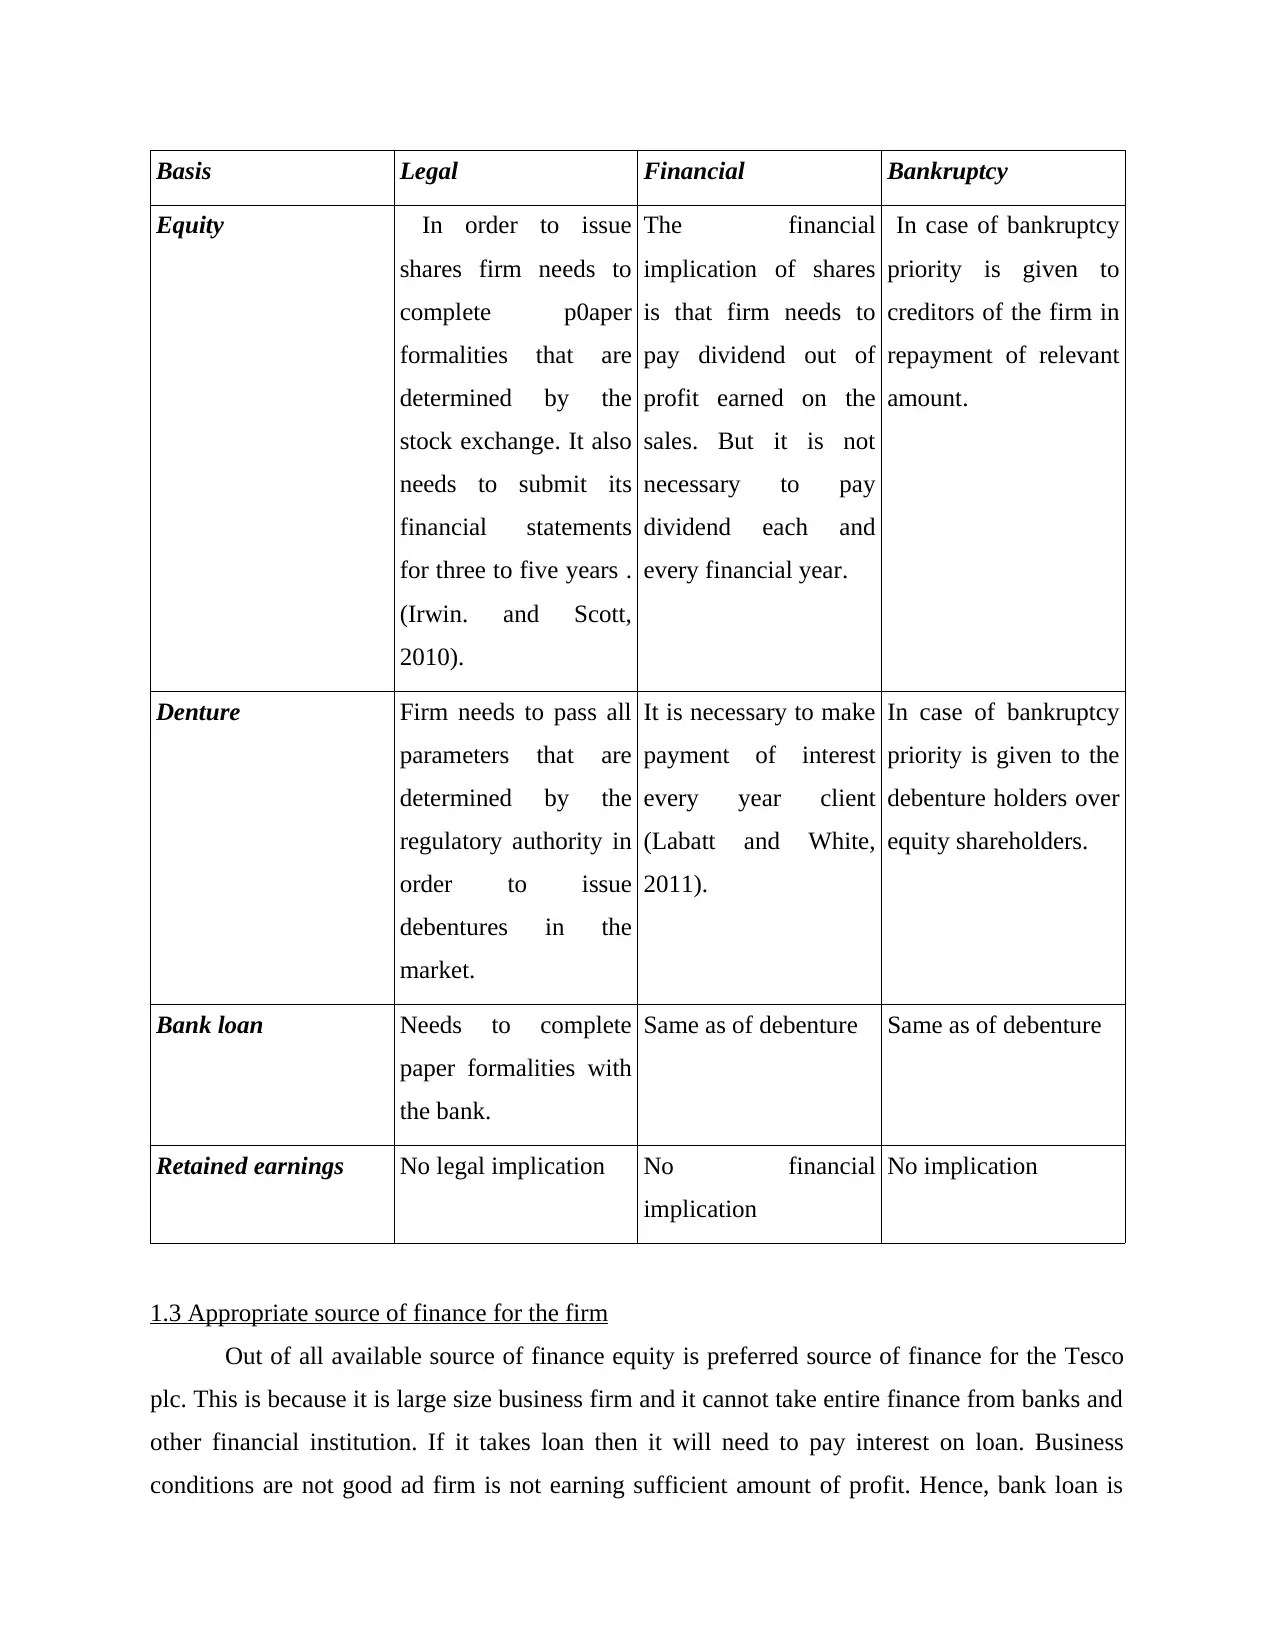
Basis Legal Financial Bankruptcy
Equity In order to issue
shares firm needs to
complete p0aper
formalities that are
determined by the
stock exchange. It also
needs to submit its
financial statements
for three to five years .
(Irwin. and Scott,
2010).
The financial
implication of shares
is that firm needs to
pay dividend out of
profit earned on the
sales. But it is not
necessary to pay
dividend each and
every financial year.
In case of bankruptcy
priority is given to
creditors of the firm in
repayment of relevant
amount.
Denture Firm needs to pass all
parameters that are
determined by the
regulatory authority in
order to issue
debentures in the
market.
It is necessary to make
payment of interest
every year client
(Labatt and White,
2011).
In case of bankruptcy
priority is given to the
debenture holders over
equity shareholders.
Bank loan Needs to complete
paper formalities with
the bank.
Same as of debenture Same as of debenture
Retained earnings No legal implication No financial
implication
No implication
1.3 Appropriate source of finance for the firm
Out of all available source of finance equity is preferred source of finance for the Tesco
plc. This is because it is large size business firm and it cannot take entire finance from banks and
other financial institution. If it takes loan then it will need to pay interest on loan. Business
conditions are not good ad firm is not earning sufficient amount of profit. Hence, bank loan is
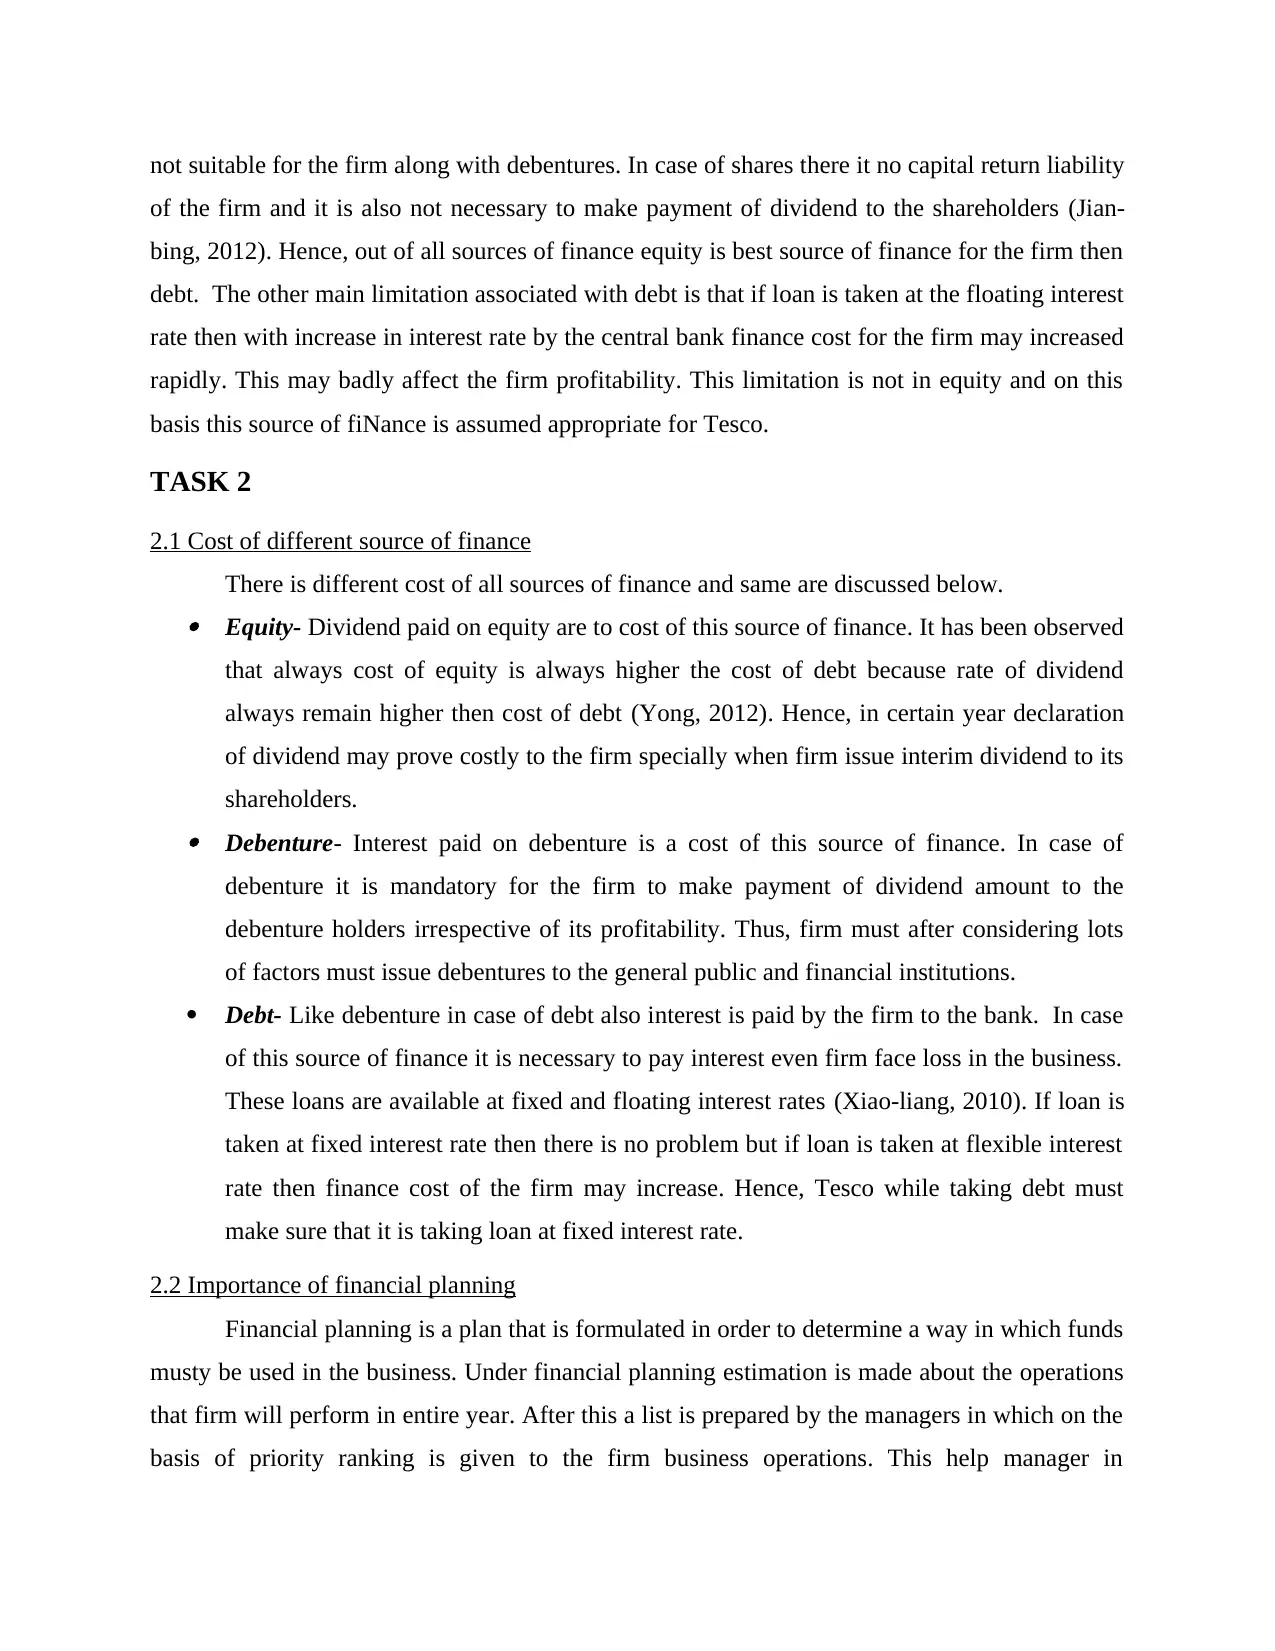
not suitable for the firm along with debentures. In case of shares there it no capital return liability
of the firm and it is also not necessary to make payment of dividend to the shareholders (Jian-
bing, 2012). Hence, out of all sources of finance equity is best source of finance for the firm then
debt. The other main limitation associated with debt is that if loan is taken at the floating interest
rate then with increase in interest rate by the central bank finance cost for the firm may increased
rapidly. This may badly affect the firm profitability. This limitation is not in equity and on this
basis this source of fiNance is assumed appropriate for Tesco.
TASK 2
2.1 Cost of different source of finance
There is different cost of all sources of finance and same are discussed below. Equity- Dividend paid on equity are to cost of this source of finance. It has been observed
that always cost of equity is always higher the cost of debt because rate of dividend
always remain higher then cost of debt (Yong, 2012). Hence, in certain year declaration
of dividend may prove costly to the firm specially when firm issue interim dividend to its
shareholders. Debenture- Interest paid on debenture is a cost of this source of finance. In case of
debenture it is mandatory for the firm to make payment of dividend amount to the
debenture holders irrespective of its profitability. Thus, firm must after considering lots
of factors must issue debentures to the general public and financial institutions.
Debt- Like debenture in case of debt also interest is paid by the firm to the bank. In case
of this source of finance it is necessary to pay interest even firm face loss in the business.
These loans are available at fixed and floating interest rates (Xiao-liang, 2010). If loan is
taken at fixed interest rate then there is no problem but if loan is taken at flexible interest
rate then finance cost of the firm may increase. Hence, Tesco while taking debt must
make sure that it is taking loan at fixed interest rate.
2.2 Importance of financial planning
Financial planning is a plan that is formulated in order to determine a way in which funds
musty be used in the business. Under financial planning estimation is made about the operations
that firm will perform in entire year. After this a list is prepared by the managers in which on the
basis of priority ranking is given to the firm business operations. This help manager in
⊘ This is a preview!⊘
Do you want full access?
Subscribe today to unlock all pages.
Trusted by 1+ million students worldwide
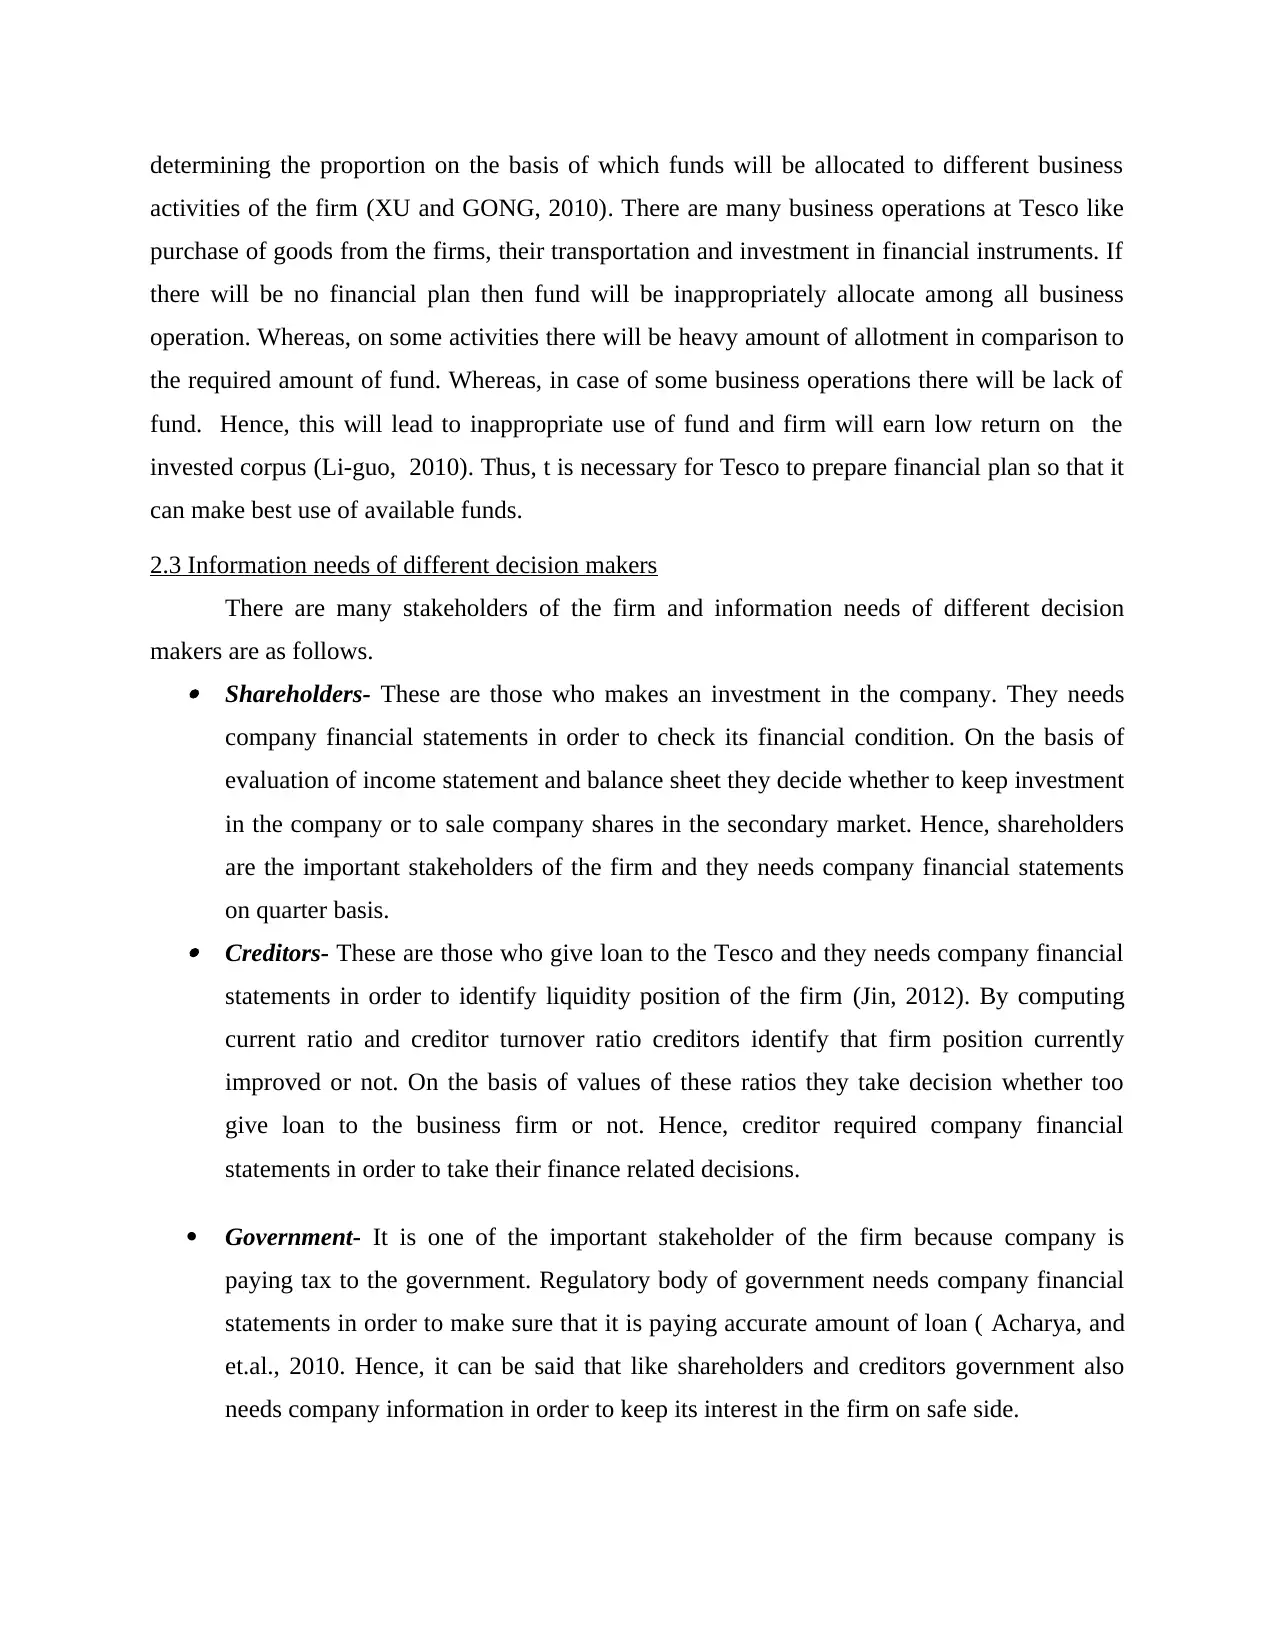
determining the proportion on the basis of which funds will be allocated to different business
activities of the firm (XU and GONG, 2010). There are many business operations at Tesco like
purchase of goods from the firms, their transportation and investment in financial instruments. If
there will be no financial plan then fund will be inappropriately allocate among all business
operation. Whereas, on some activities there will be heavy amount of allotment in comparison to
the required amount of fund. Whereas, in case of some business operations there will be lack of
fund. Hence, this will lead to inappropriate use of fund and firm will earn low return on the
invested corpus (Li-guo, 2010). Thus, t is necessary for Tesco to prepare financial plan so that it
can make best use of available funds.
2.3 Information needs of different decision makers
There are many stakeholders of the firm and information needs of different decision
makers are as follows. Shareholders- These are those who makes an investment in the company. They needs
company financial statements in order to check its financial condition. On the basis of
evaluation of income statement and balance sheet they decide whether to keep investment
in the company or to sale company shares in the secondary market. Hence, shareholders
are the important stakeholders of the firm and they needs company financial statements
on quarter basis. Creditors- These are those who give loan to the Tesco and they needs company financial
statements in order to identify liquidity position of the firm (Jin, 2012). By computing
current ratio and creditor turnover ratio creditors identify that firm position currently
improved or not. On the basis of values of these ratios they take decision whether too
give loan to the business firm or not. Hence, creditor required company financial
statements in order to take their finance related decisions.
Government- It is one of the important stakeholder of the firm because company is
paying tax to the government. Regulatory body of government needs company financial
statements in order to make sure that it is paying accurate amount of loan ( Acharya, and
et.al., 2010. Hence, it can be said that like shareholders and creditors government also
needs company information in order to keep its interest in the firm on safe side.
Paraphrase This Document
Need a fresh take? Get an instant paraphrase of this document with our AI Paraphraser
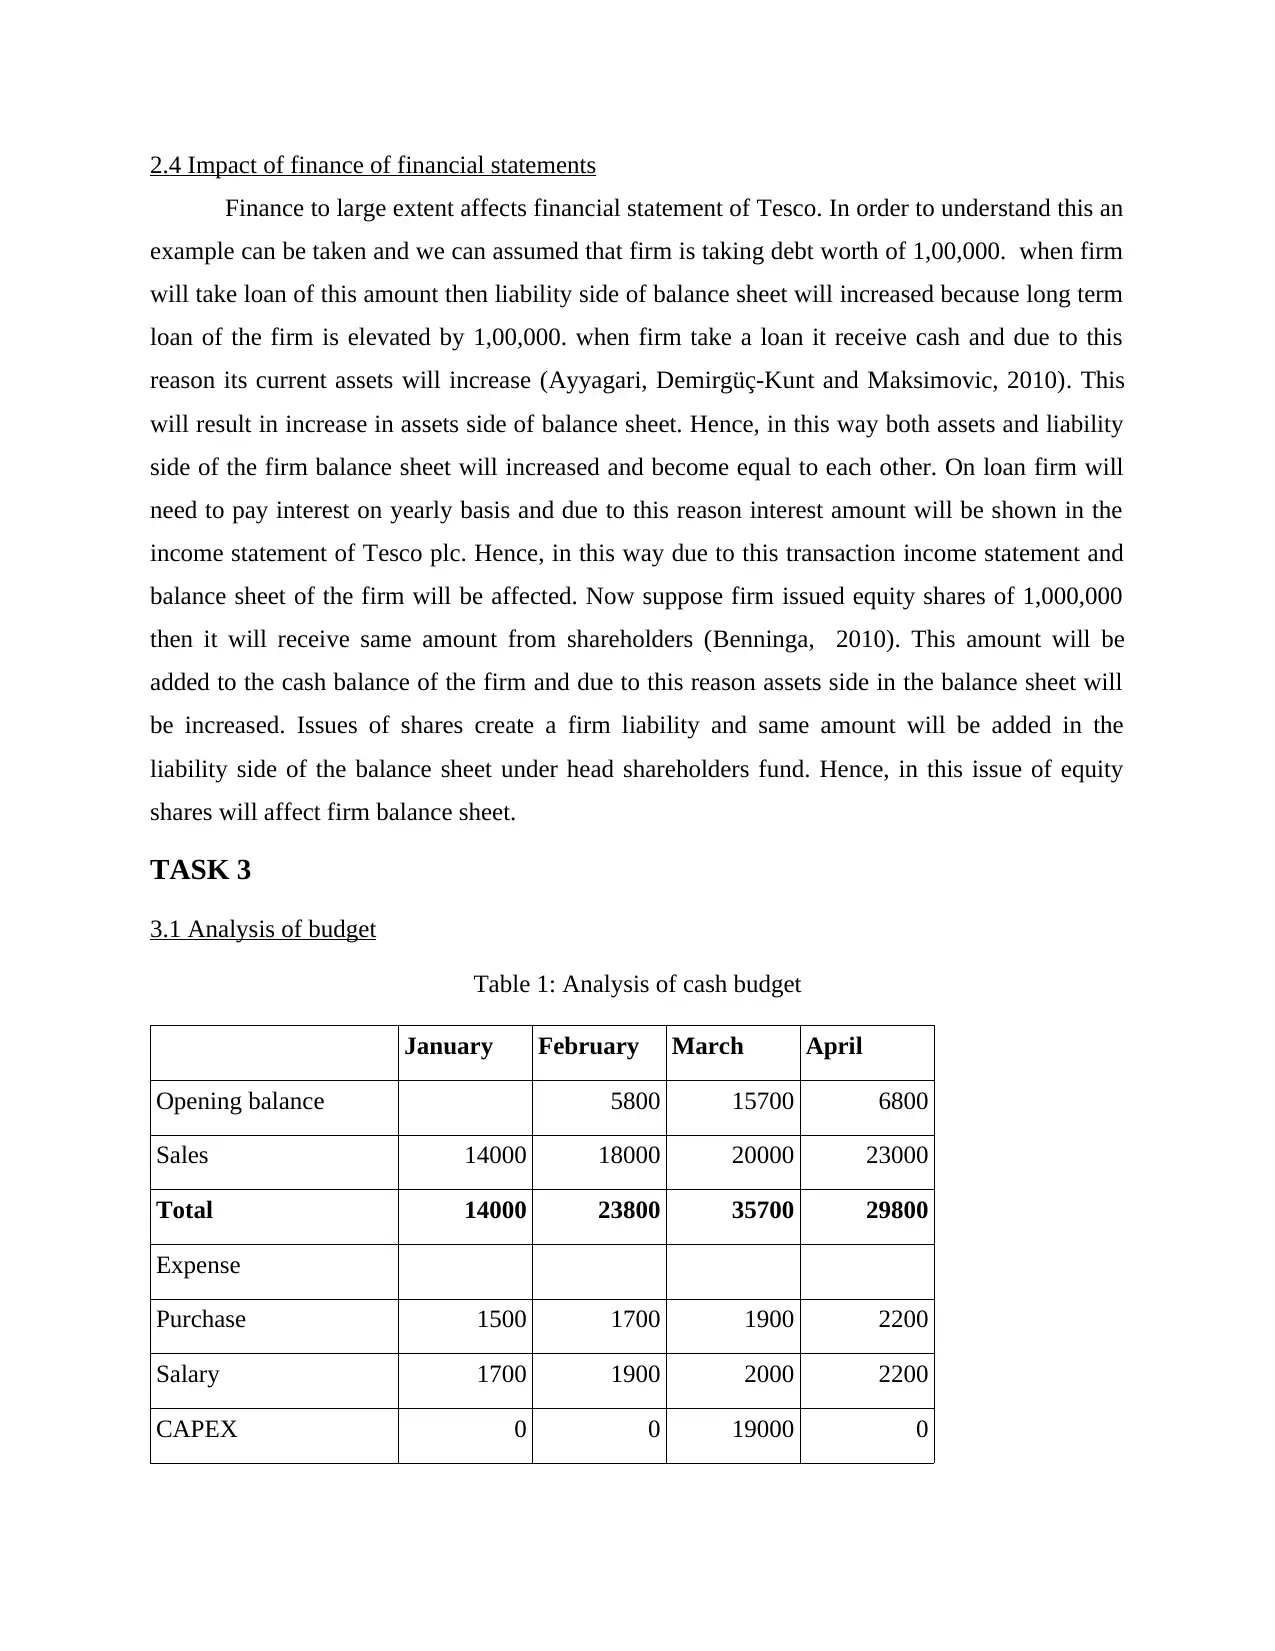
2.4 Impact of finance of financial statements
Finance to large extent affects financial statement of Tesco. In order to understand this an
example can be taken and we can assumed that firm is taking debt worth of 1,00,000. when firm
will take loan of this amount then liability side of balance sheet will increased because long term
loan of the firm is elevated by 1,00,000. when firm take a loan it receive cash and due to this
reason its current assets will increase (Ayyagari, Demirgüç-Kunt and Maksimovic, 2010). This
will result in increase in assets side of balance sheet. Hence, in this way both assets and liability
side of the firm balance sheet will increased and become equal to each other. On loan firm will
need to pay interest on yearly basis and due to this reason interest amount will be shown in the
income statement of Tesco plc. Hence, in this way due to this transaction income statement and
balance sheet of the firm will be affected. Now suppose firm issued equity shares of 1,000,000
then it will receive same amount from shareholders (Benninga, 2010). This amount will be
added to the cash balance of the firm and due to this reason assets side in the balance sheet will
be increased. Issues of shares create a firm liability and same amount will be added in the
liability side of the balance sheet under head shareholders fund. Hence, in this issue of equity
shares will affect firm balance sheet.
TASK 3
3.1 Analysis of budget
Table 1: Analysis of cash budget
January February March April
Opening balance 5800 15700 6800
Sales 14000 18000 20000 23000
Total 14000 23800 35700 29800
Expense
Purchase 1500 1700 1900 2200
Salary 1700 1900 2000 2200
CAPEX 0 0 19000 0
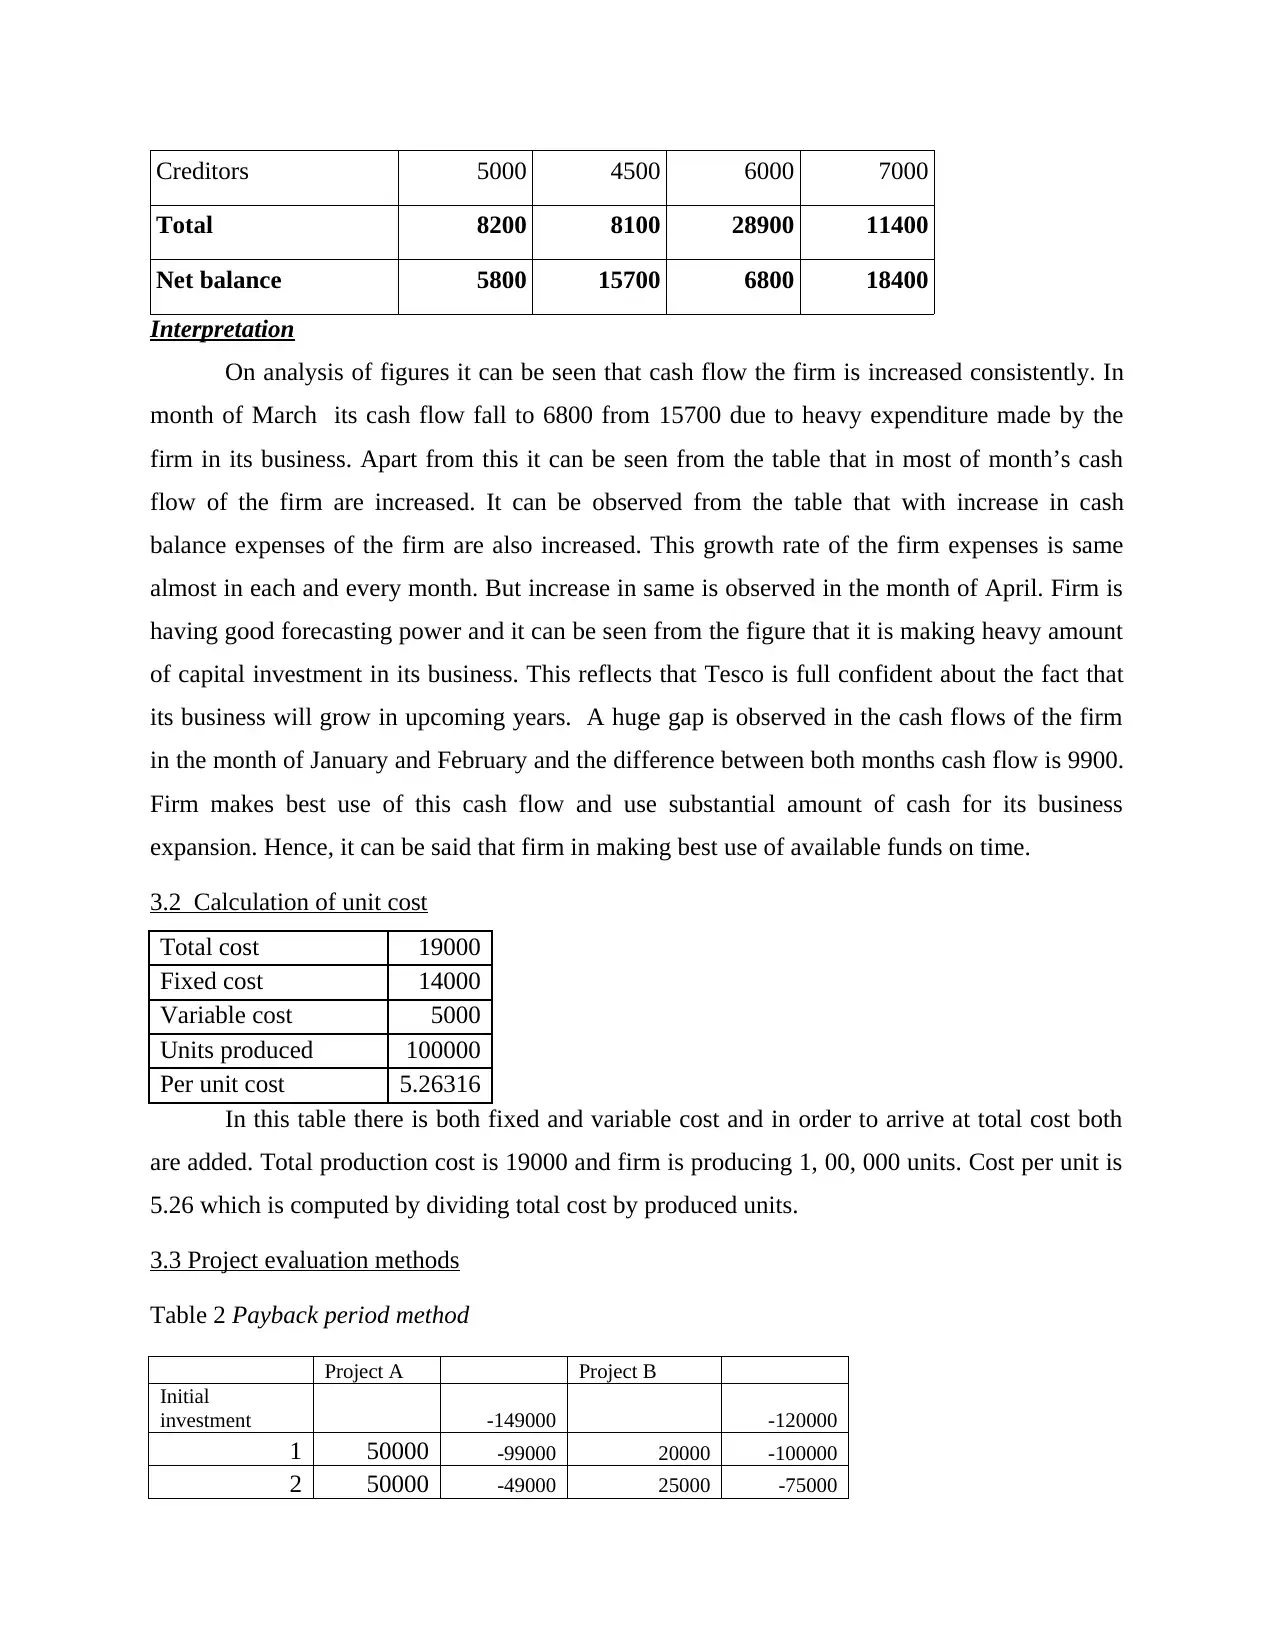
Creditors 5000 4500 6000 7000
Total 8200 8100 28900 11400
Net balance 5800 15700 6800 18400
Interpretation
On analysis of figures it can be seen that cash flow the firm is increased consistently. In
month of March its cash flow fall to 6800 from 15700 due to heavy expenditure made by the
firm in its business. Apart from this it can be seen from the table that in most of month’s cash
flow of the firm are increased. It can be observed from the table that with increase in cash
balance expenses of the firm are also increased. This growth rate of the firm expenses is same
almost in each and every month. But increase in same is observed in the month of April. Firm is
having good forecasting power and it can be seen from the figure that it is making heavy amount
of capital investment in its business. This reflects that Tesco is full confident about the fact that
its business will grow in upcoming years. A huge gap is observed in the cash flows of the firm
in the month of January and February and the difference between both months cash flow is 9900.
Firm makes best use of this cash flow and use substantial amount of cash for its business
expansion. Hence, it can be said that firm in making best use of available funds on time.
3.2 Calculation of unit cost
Total cost 19000
Fixed cost 14000
Variable cost 5000
Units produced 100000
Per unit cost 5.26316
In this table there is both fixed and variable cost and in order to arrive at total cost both
are added. Total production cost is 19000 and firm is producing 1, 00, 000 units. Cost per unit is
5.26 which is computed by dividing total cost by produced units.
3.3 Project evaluation methods
Table 2 Payback period method
Project A Project B
Initial
investment -149000 -120000
1 50000 -99000 20000 -100000
2 50000 -49000 25000 -75000
⊘ This is a preview!⊘
Do you want full access?
Subscribe today to unlock all pages.
Trusted by 1+ million students worldwide
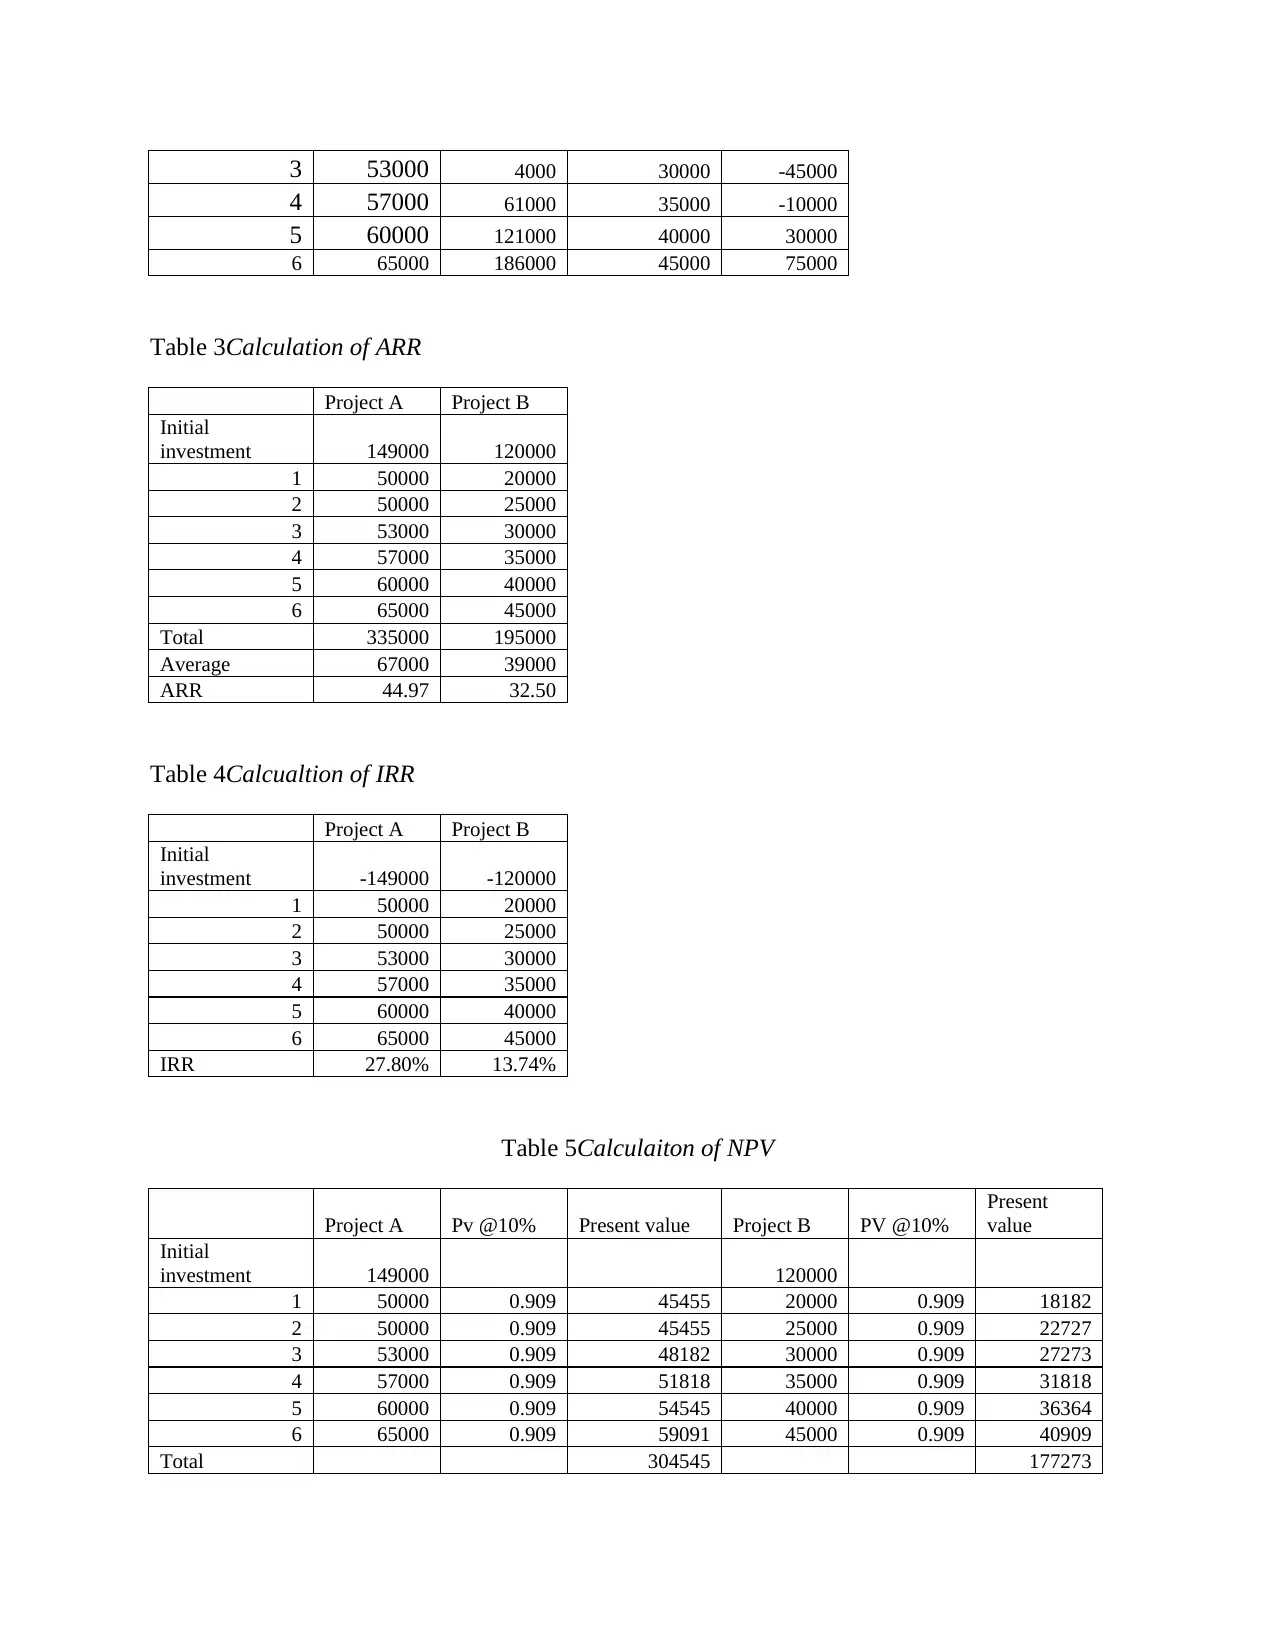
3 53000 4000 30000 -45000
4 57000 61000 35000 -10000
5 60000 121000 40000 30000
6 65000 186000 45000 75000
Table 3Calculation of ARR
Project A Project B
Initial
investment 149000 120000
1 50000 20000
2 50000 25000
3 53000 30000
4 57000 35000
5 60000 40000
6 65000 45000
Total 335000 195000
Average 67000 39000
ARR 44.97 32.50
Table 4Calcualtion of IRR
Project A Project B
Initial
investment -149000 -120000
1 50000 20000
2 50000 25000
3 53000 30000
4 57000 35000
5 60000 40000
6 65000 45000
IRR 27.80% 13.74%
Table 5Calculaiton of NPV
Project A Pv @10% Present value Project B PV @10%
Present
value
Initial
investment 149000 120000
1 50000 0.909 45455 20000 0.909 18182
2 50000 0.909 45455 25000 0.909 22727
3 53000 0.909 48182 30000 0.909 27273
4 57000 0.909 51818 35000 0.909 31818
5 60000 0.909 54545 40000 0.909 36364
6 65000 0.909 59091 45000 0.909 40909
Total 304545 177273
Paraphrase This Document
Need a fresh take? Get an instant paraphrase of this document with our AI Paraphraser
NPV 155545 57273
Definitions
Payback period- It is a method that indicate the time period within project can recover
invested amount (Pay back period. 2013). If time period in which investment recovered
is short then project is assumed viable for the firm.
Net present value- It is a method that indicate net present value of the project after
deducting initial investment from present value of cash flows. If NPV is positive and is of
high value then it is assumed that project is viable for the firm.
ARR- It indicates average return that a project can earn on the invested amount. Higher
the value of ARR project is assumed viable for the firm (Accounting rate of return
method. 2015).
IRR- It indicates actual return that project can earn on the invested amount. IRR gives
clearer picture then ARR in terms of viability of project. Hence, most of experts prefer to
use IRR instead of ARR.
Analysis of results
NPV, IRR and ARR of project B is greater than project A. moreover, former project is
recovering invested amount in short duration and due to this reason project B is considered more
viable then project A.
TASK 4
4.1Finanicial statements of the firms
Following are the main financial statements of the firms.
1. Income statement- It indicate the revenue earned and expenses incurred by the firm. On the
basis of evaluation of income statement manager comes to know about the direction in
which they need to go (Boatright, 2013). Hence, income statement has great importance for
the firm,
2. Balance sheet- it is a statement that indicate financial position of the firm. Managers use
ratio analysis method and evaluate company condition from different sides. Hence, balance
sheet helps managers in identifying areas where they needs to work.
3. Cash flow statement- It is a statement that reflects cash inflow and outflow in the business.
Thus, by using cash flow statement manager comes to know about the sources from which
cash is generated and places where cash is invested (Brown, Beekes. and Verhoeven,
2011). Hence, this statement helps managers in preparing good cash management strategy.
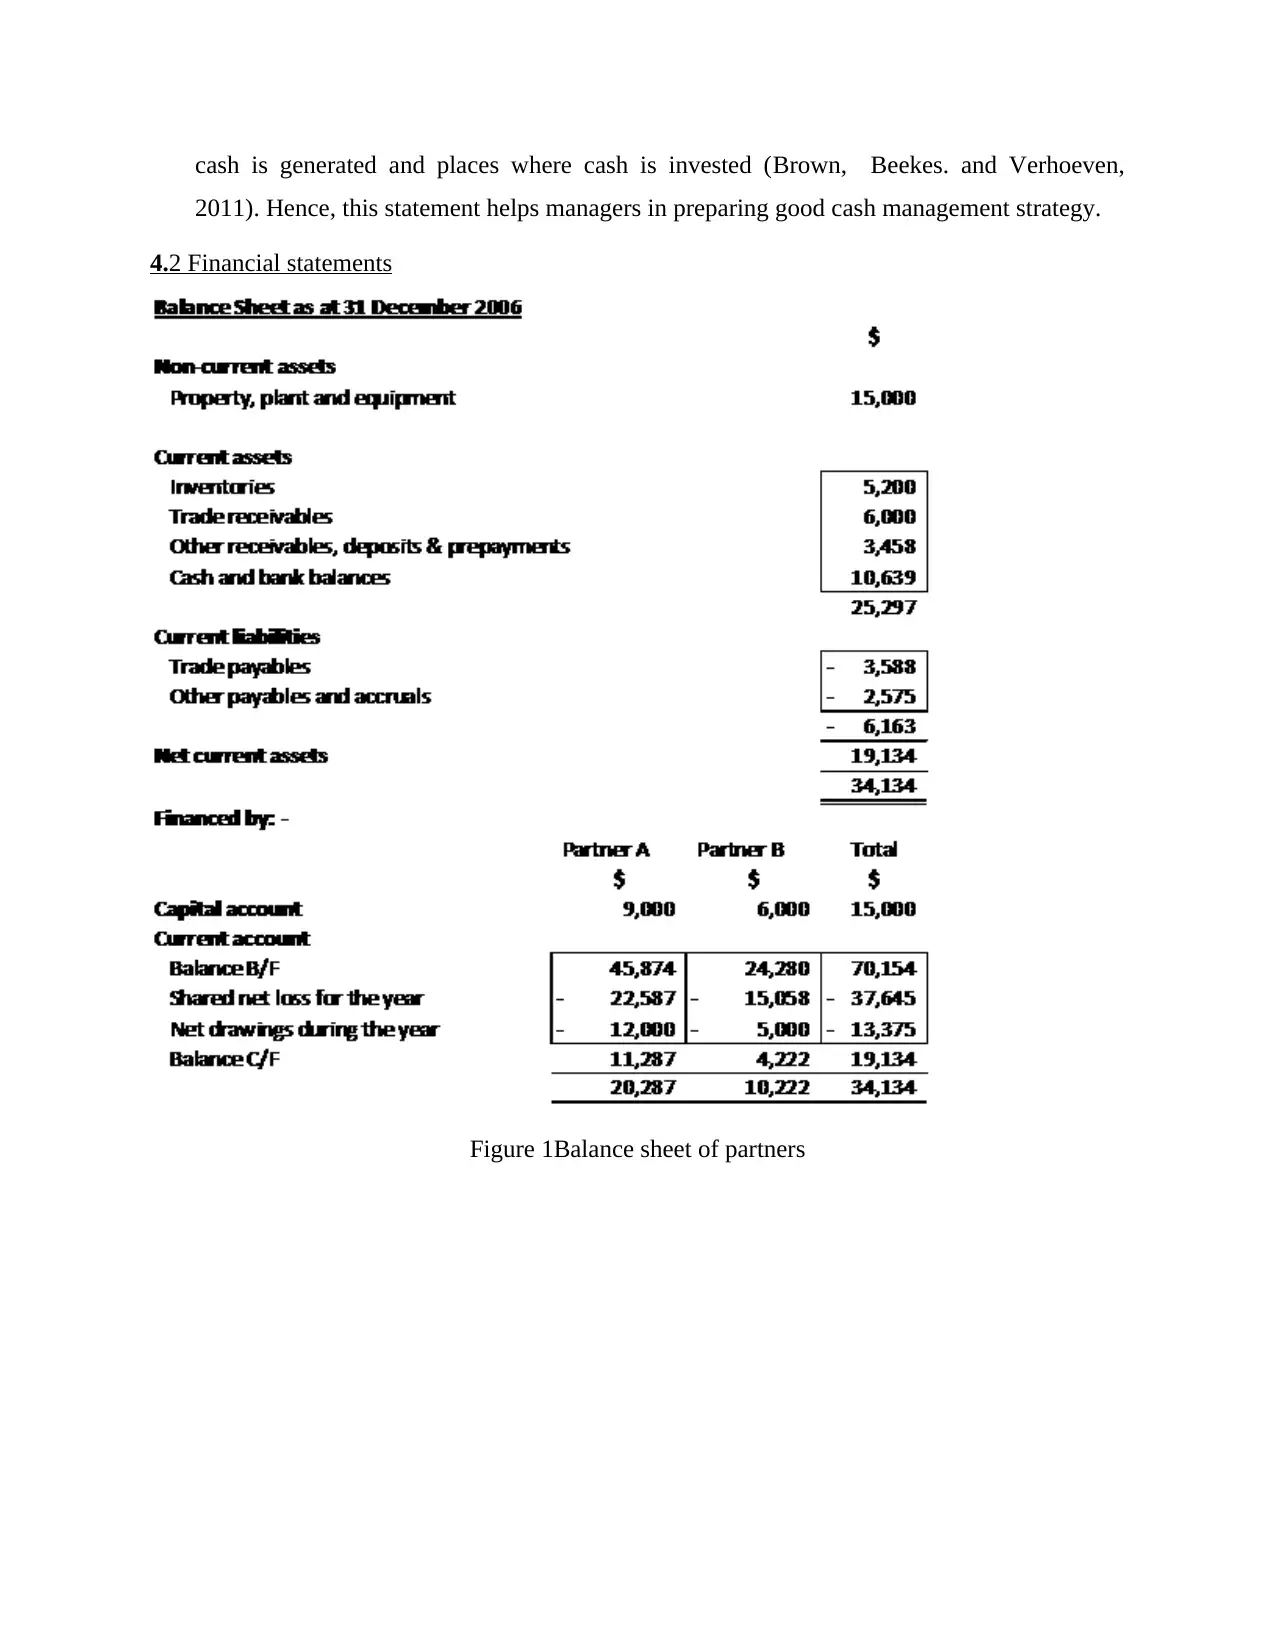
4.2 Financial statements
Figure 1Balance sheet of partners
2011). Hence, this statement helps managers in preparing good cash management strategy.
4.2 Financial statements
Figure 1Balance sheet of partners
⊘ This is a preview!⊘
Do you want full access?
Subscribe today to unlock all pages.
Trusted by 1+ million students worldwide
1 out of 20
Related Documents


Your All-in-One AI-Powered Toolkit for Academic Success.
+13062052269
info@desklib.com
Available 24*7 on WhatsApp / Email
![[object Object]](/_next/static/media/star-bottom.7253800d.svg)
Unlock your academic potential
Copyright © 2020–2026 A2Z Services. All Rights Reserved. Developed and managed by ZUCOL.