Financial Risk Management: Comparative Analysis of HSBC and Lloyd Bank
VerifiedAdded on 2021/12/13
|18
|3518
|26
Report
AI Summary
This report provides a comprehensive analysis of financial risk management within the banking sector, specifically focusing on HSBC and Lloyd Bank. The study employs a quantitative approach, utilizing financial data from 2011 to 2017, to assess the banks' performance through various financial ratios, including efficiency, profitability, liquidity, share performance, management capacity, and capital structure. The research methodology involves a descriptive research design and deductive approach, with data sourced from the annual reports of both companies. The analysis includes liquidity, profitability, and management capacity ratios, revealing the banks' ability to manage short-term obligations, generate returns, and utilize assets effectively. The findings highlight the relative variability in financial operations and asset utilization between the two banks, despite their overall strong performance. The report concludes by discussing the implications of these findings for effective risk management practices within the banking industry and providing insights into the financial health and stability of HSBC and Lloyd Bank.
0
Running head: BANK FINANCIAL RISK MANAGEMENT
BANK FINANCIAL RISK MANAGEMENT
Name of the Student
Name of the University
Author’s Note
Running head: BANK FINANCIAL RISK MANAGEMENT
BANK FINANCIAL RISK MANAGEMENT
Name of the Student
Name of the University
Author’s Note
Paraphrase This Document
Need a fresh take? Get an instant paraphrase of this document with our AI Paraphraser
1BANK FINANCIAL RISK MANAGEMENT
Abstract
The objective of the paper is to delve into the aspects of risk management through
covering the process of effective examination upon the financial performance of the considered
two banks which are HSBC bank and Lloyd bank. Quantitative analysis is being executed upon
the obtained financial data from 2011 till 2017 for the two banks and the respective results are
interpreted and compared. The involved ratios that were being undertaken for conducting the
financial ratio analysis are the efficiency ratio, profitability ratio, liquidity ratio, share
performance, management capacity and capital structure of the two banking firms. Descriptive
statistical analysis was then implemented to rank the financial performance of the firms followed
by revealing the existing banking scenario in terms of its overall stability and measure of
dispersion from the performance expected. The major finding reflected that both of the banks
performed substantially well though relative variability was been found in their financial
operation and way of asset utilization.
Keywords: HSBC, Lloyd Bank, Financial Ratios Analysis, Performance Measurement
2BANK FINANCIAL RISK MANAGEMENT
Table of Contents
Abstract............................................................................................................................................1
Introduction......................................................................................................................................3
Background Information..................................................................................................................3
Research Objective..........................................................................................................................4
Research Methodology....................................................................................................................4
Literature Review............................................................................................................................4
Financial Ratio Analysis..................................................................................................................5
Liquidity Analysis......................................................................................................................6
Profitability Ratios.......................................................................................................................8
Management Capacity Ratios....................................................................................................10
Capital Structure Ratios.............................................................................................................12
Growth Ratios............................................................................................................................14
Conclusion.....................................................................................................................................16
References......................................................................................................................................17
⊘ This is a preview!⊘
Do you want full access?
Subscribe today to unlock all pages.
Trusted by 1+ million students worldwide
3BANK FINANCIAL RISK MANAGEMENT
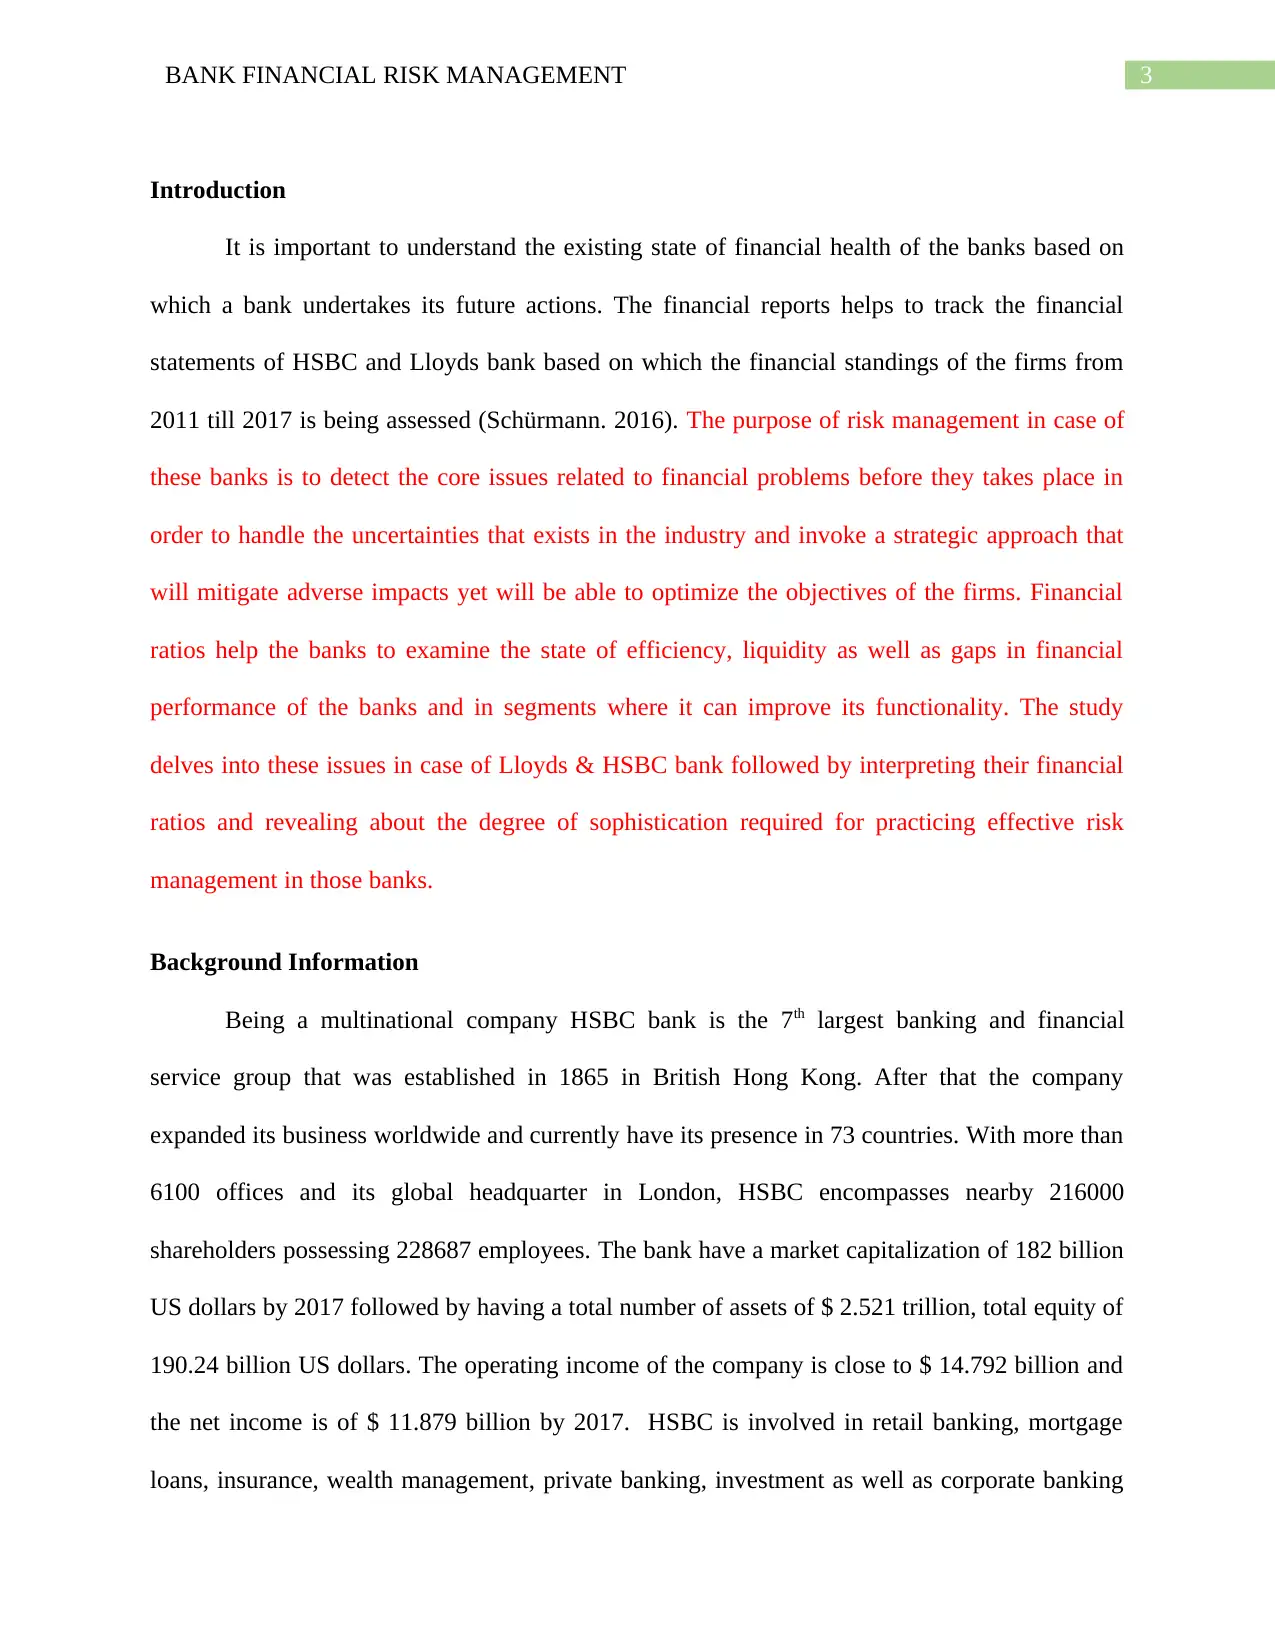
Introduction
It is important to understand the existing state of financial health of the banks based on
which a bank undertakes its future actions. The financial reports helps to track the financial
statements of HSBC and Lloyds bank based on which the financial standings of the firms from
2011 till 2017 is being assessed (Schürmann. 2016). The purpose of risk management in case of
these banks is to detect the core issues related to financial problems before they takes place in
order to handle the uncertainties that exists in the industry and invoke a strategic approach that
will mitigate adverse impacts yet will be able to optimize the objectives of the firms. Financial
ratios help the banks to examine the state of efficiency, liquidity as well as gaps in financial
performance of the banks and in segments where it can improve its functionality. The study
delves into these issues in case of Lloyds & HSBC bank followed by interpreting their financial
ratios and revealing about the degree of sophistication required for practicing effective risk
management in those banks.
Background Information
Being a multinational company HSBC bank is the 7th largest banking and financial
service group that was established in 1865 in British Hong Kong. After that the company
expanded its business worldwide and currently have its presence in 73 countries. With more than
6100 offices and its global headquarter in London, HSBC encompasses nearby 216000
shareholders possessing 228687 employees. The bank have a market capitalization of 182 billion
US dollars by 2017 followed by having a total number of assets of $ 2.521 trillion, total equity of
190.24 billion US dollars. The operating income of the company is close to $ 14.792 billion and
the net income is of $ 11.879 billion by 2017. HSBC is involved in retail banking, mortgage
loans, insurance, wealth management, private banking, investment as well as corporate banking
Paraphrase This Document
Need a fresh take? Get an instant paraphrase of this document with our AI Paraphraser
4BANK FINANCIAL RISK MANAGEMENT
and has a customer base of 51 million worldwide. Lloyd bank on the other hand is headquartered
in London, and is among the big four clearing banks involved in retail and commercial banking.
The firm provides insurance services and by 2016 possessed an employee strength of 45856 and
Lloyd bank was having an operating income of 17.5 billion, followed by net income of 16.6
billion and average income earning banking assets of 436 billion.
Research Objective
The objective of the research encompasses the aspect of determining the financial ratios
of HSBC and Lloyd banks based on which their financial development and ability to manage
financial risks for the period 2011-2017 are examined followed by a comparison between the
two banks.
Research Methodology
The methodology of the research is done through descriptive research design and
maintaining a deductive research approach. The data of 2011-2017 are gathered from the annual
reports of the respective companies and the financial information thus obtained are further being
analyzed through quantitative measurements.
Literature Review
According to Yan et al. (2017), financial positioning is quite dependent upon the
variations that are being taking place within the ability of the banking firms to mitigate risks
associated with their business. Adaptive analysis of the pass trends of the financial ratios can
provide a predictive measures that needs to be undertaken for reducing the financial risks
involved. The paper clearly put forth that beside operational risk, reputational risk, the banks
5BANK FINANCIAL RISK MANAGEMENT
faces liquidity risks to cover up its liabilities with its assets as well as market risks which are
nothing but systematic risks in the business.
In accordance with Black et al. (2016), it assessed the performance of banks financially
and depicted that financial ratios are effective estimators of the responsive of firms to understand
its performance overtime. Measurement of the financial health based on the profitability ratios
and efficiency ratios gave that there exist statistically significant difference between the
performance levels of the banking firms.
Curi and Murgia (2018), investigated upon the influential factors that renders impact in
the long run upon the financial health of the banking sectors. Among them the wealth
management, liquidity positions, asset quality, earning ability measurements are found to be
important parameters that determine financial health of the banks.
Adelopo (2017), examined the financial anomalies of private and public banks and how
financial ratios helps to understand them. It was been reflected in the paper that the joint ventures
made by public and private banks are capable of strongly assessing the risk mitigation ability of
the banks by measurement of financial ratios. It was also revealed by the paper that ranking the
capital adequacy, return on assets, etc. renders adequate information about the existing capital
utilization and repayment ability of the banks of their debts.
Financial Ratio Analysis
The financial ratio analysis are done in order to understand the relationship between
various factors that boosts a firs ability to manage risks as well as ensure its success based on the
measurement of its past performance from the perspective of the investor as well as the bank.
⊘ This is a preview!⊘
Do you want full access?
Subscribe today to unlock all pages.
Trusted by 1+ million students worldwide
6BANK FINANCIAL RISK MANAGEMENT
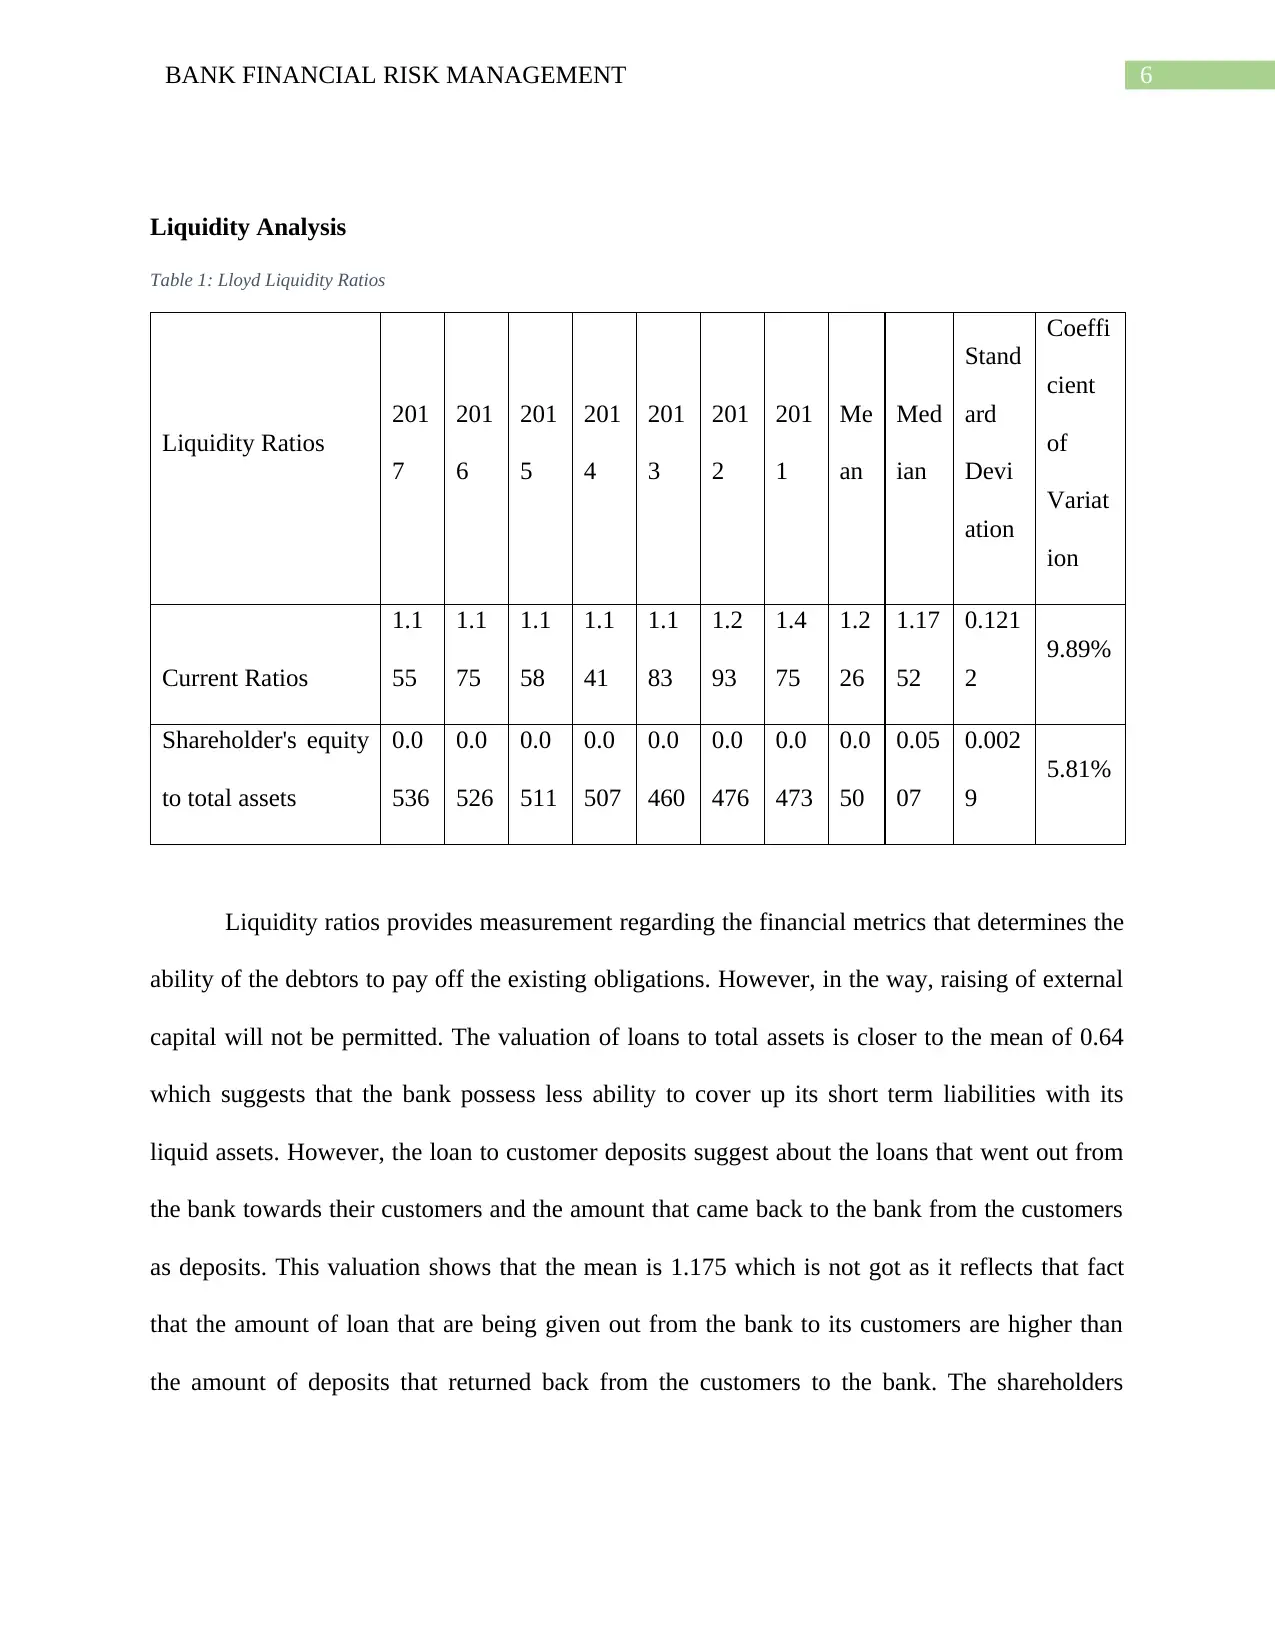
Liquidity Analysis
Table 1: Lloyd Liquidity Ratios
Liquidity Ratios
201
7
201
6
201
5
201
4
201
3
201
2
201
1
Me
an
Med
ian
Stand
ard
Devi
ation
Coeffi
cient
of
Variat
ion
Current Ratios
1.1
55
1.1
75
1.1
58
1.1
41
1.1
83
1.2
93
1.4
75
1.2
26
1.17
52
0.121
2
9.89%
Shareholder's equity
to total assets
0.0
536
0.0
526
0.0
511
0.0
507
0.0
460
0.0
476
0.0
473
0.0
50
0.05
07
0.002
9
5.81%
Liquidity ratios provides measurement regarding the financial metrics that determines the
ability of the debtors to pay off the existing obligations. However, in the way, raising of external
capital will not be permitted. The valuation of loans to total assets is closer to the mean of 0.64
which suggests that the bank possess less ability to cover up its short term liabilities with its
liquid assets. However, the loan to customer deposits suggest about the loans that went out from
the bank towards their customers and the amount that came back to the bank from the customers
as deposits. This valuation shows that the mean is 1.175 which is not got as it reflects that fact
that the amount of loan that are being given out from the bank to its customers are higher than
the amount of deposits that returned back from the customers to the bank. The shareholders
Paraphrase This Document
Need a fresh take? Get an instant paraphrase of this document with our AI Paraphraser
7BANK FINANCIAL RISK MANAGEMENT
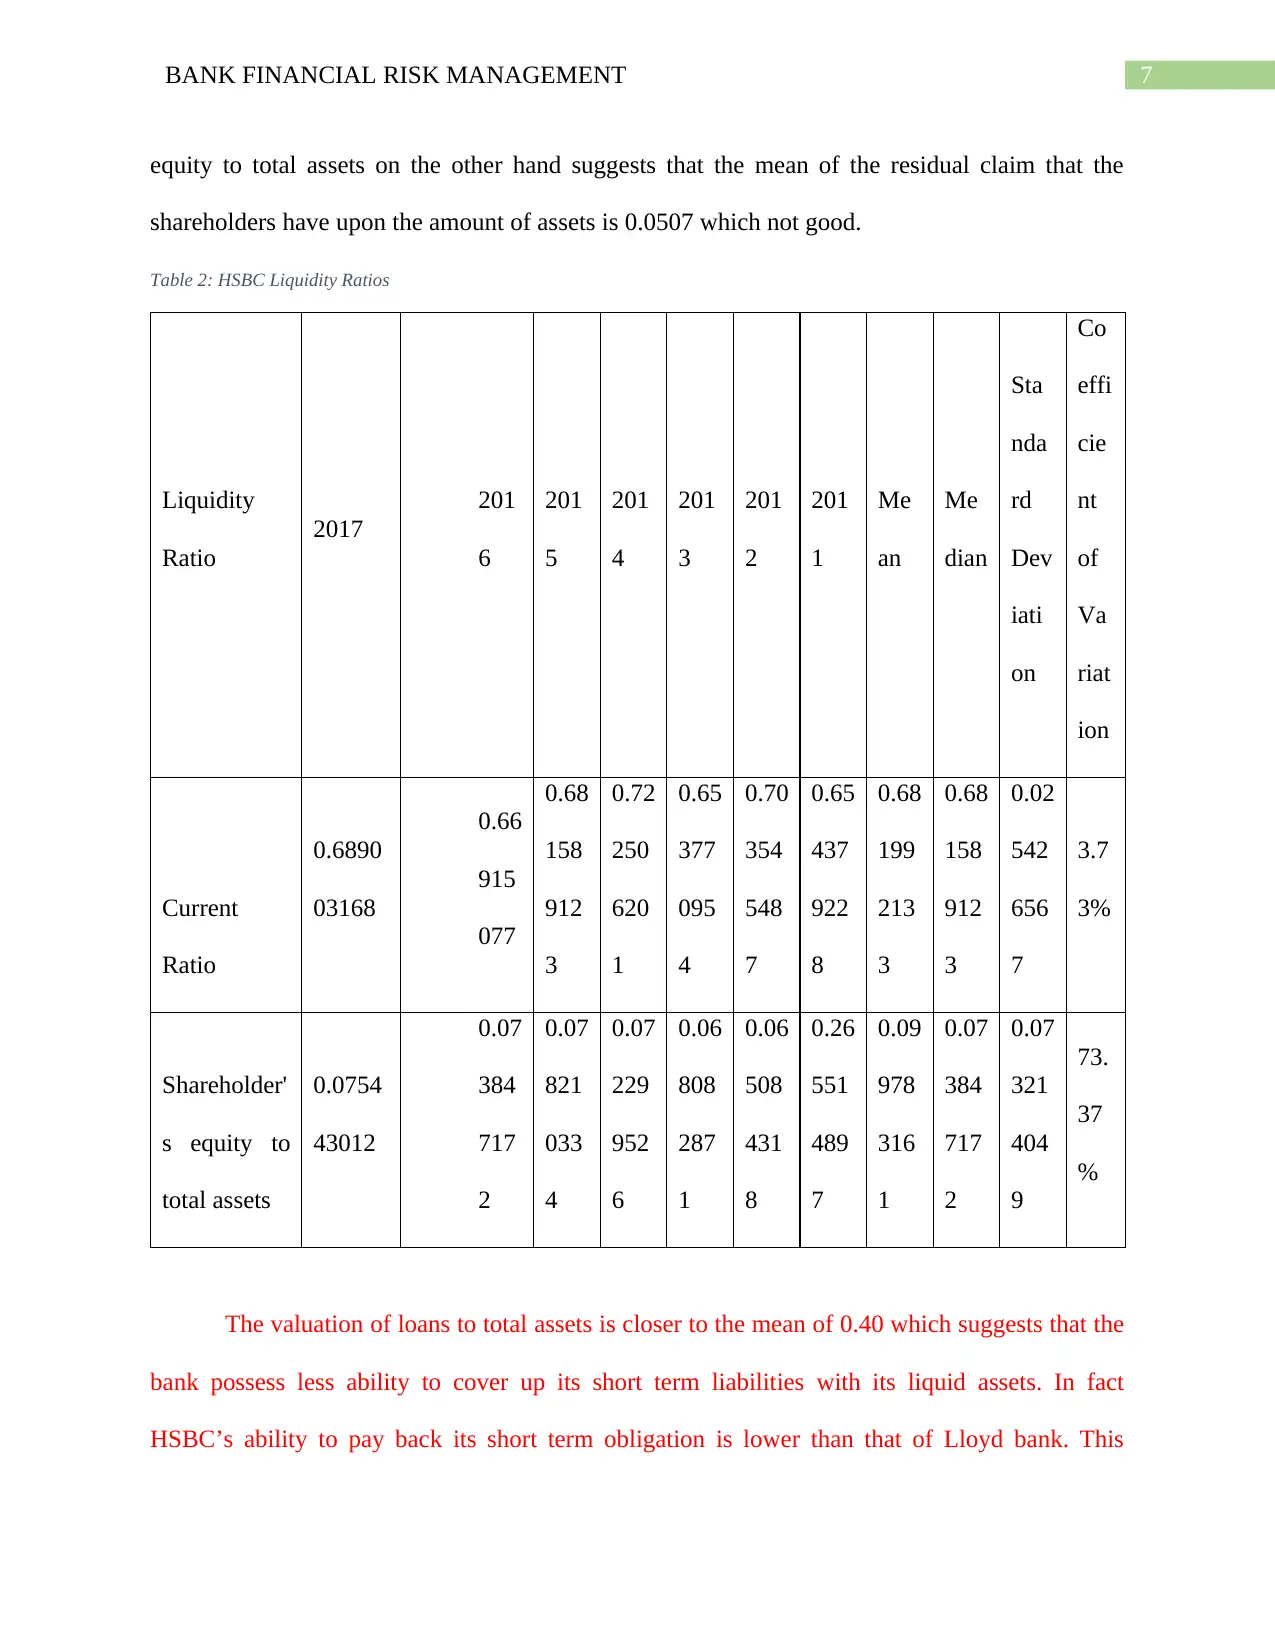
equity to total assets on the other hand suggests that the mean of the residual claim that the
shareholders have upon the amount of assets is 0.0507 which not good.
Table 2: HSBC Liquidity Ratios
Liquidity
Ratio
2017
201
6
201
5
201
4
201
3
201
2
201
1
Me
an
Me
dian
Sta
nda
rd
Dev
iati
on
Co
effi
cie
nt
of
Va
riat
ion
Current
Ratio
0.6890
03168
0.66
915
077
0.68
158
912
3
0.72
250
620
1
0.65
377
095
4
0.70
354
548
7
0.65
437
922
8
0.68
199
213
3
0.68
158
912
3
0.02
542
656
7
3.7
3%
Shareholder'
s equity to
total assets
0.0754
43012
0.07
384
717
2
0.07
821
033
4
0.07
229
952
6
0.06
808
287
1
0.06
508
431
8
0.26
551
489
7
0.09
978
316
1
0.07
384
717
2
0.07
321
404
9
73.
37
%
The valuation of loans to total assets is closer to the mean of 0.40 which suggests that the
bank possess less ability to cover up its short term liabilities with its liquid assets. In fact
HSBC’s ability to pay back its short term obligation is lower than that of Lloyd bank. This
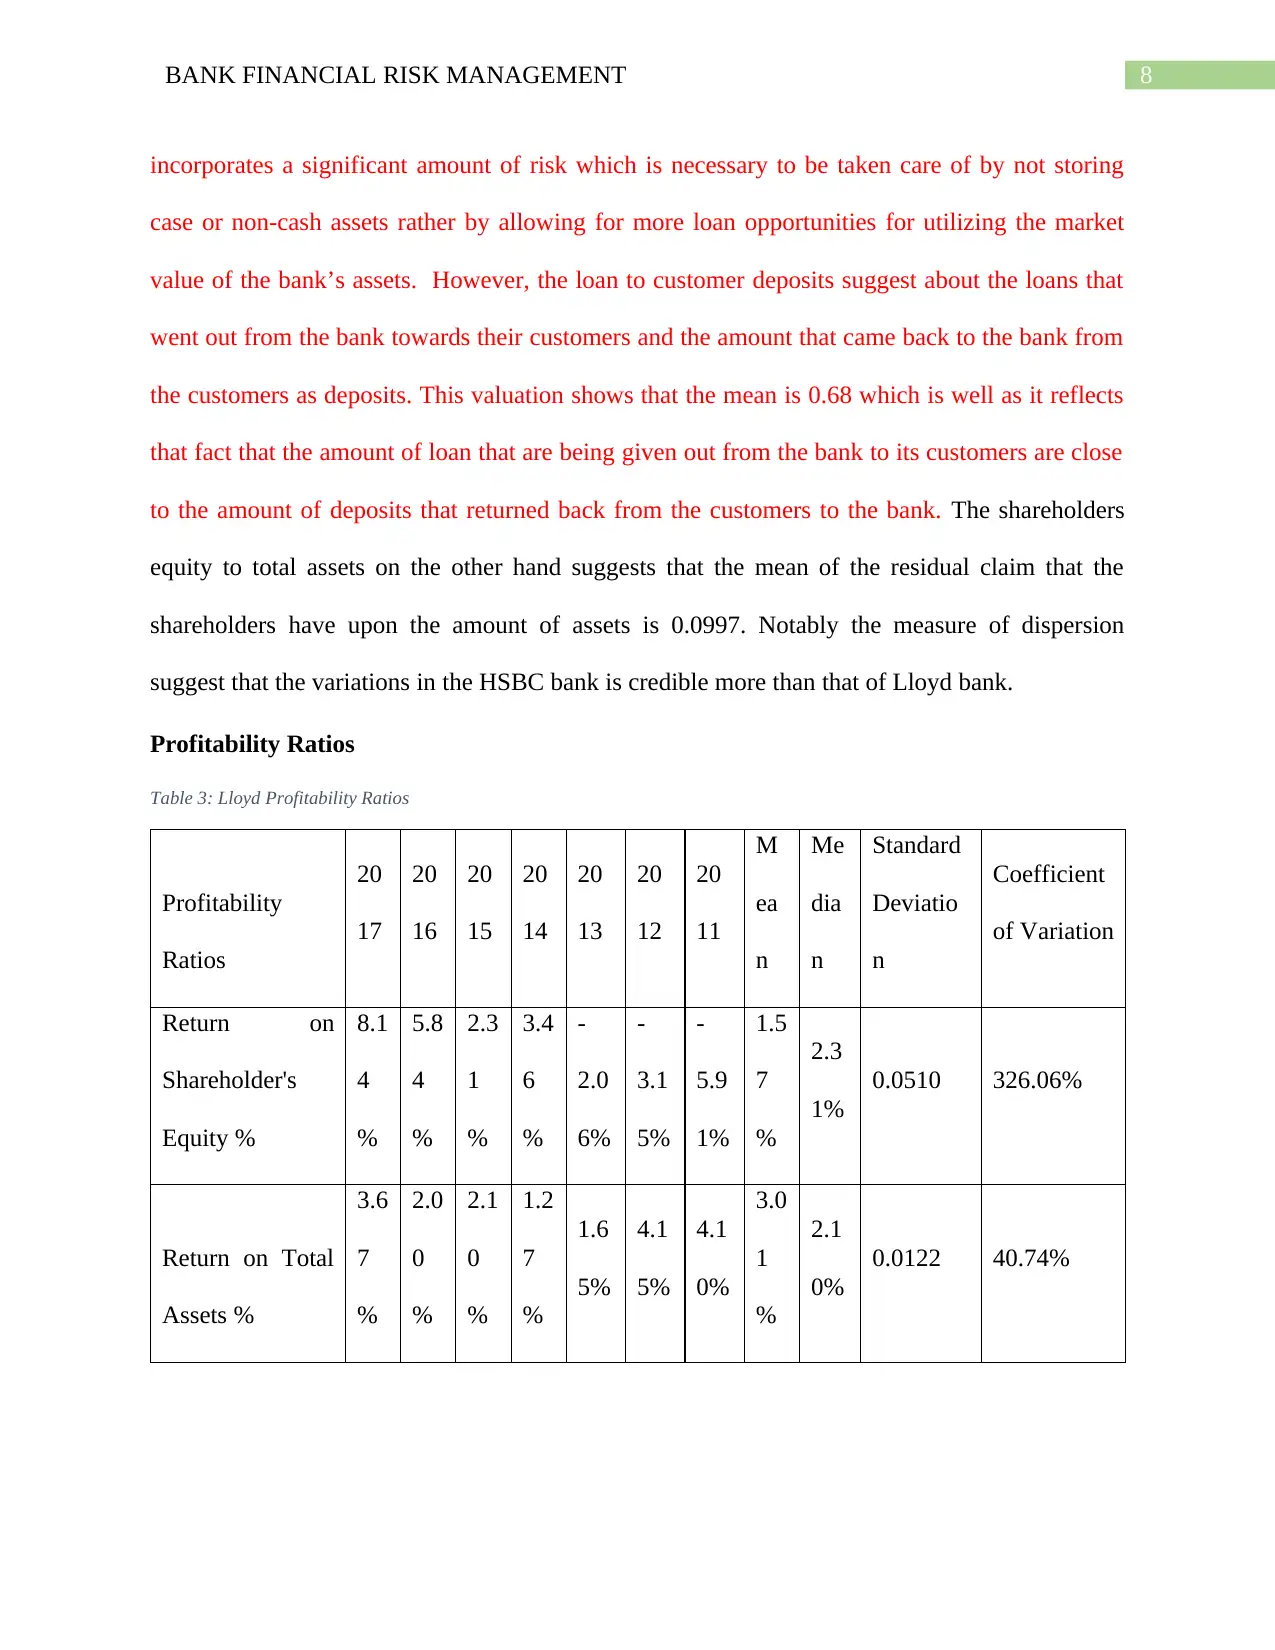
8BANK FINANCIAL RISK MANAGEMENT
incorporates a significant amount of risk which is necessary to be taken care of by not storing
case or non-cash assets rather by allowing for more loan opportunities for utilizing the market
value of the bank’s assets. However, the loan to customer deposits suggest about the loans that
went out from the bank towards their customers and the amount that came back to the bank from
the customers as deposits. This valuation shows that the mean is 0.68 which is well as it reflects
that fact that the amount of loan that are being given out from the bank to its customers are close
to the amount of deposits that returned back from the customers to the bank. The shareholders
equity to total assets on the other hand suggests that the mean of the residual claim that the
shareholders have upon the amount of assets is 0.0997. Notably the measure of dispersion
suggest that the variations in the HSBC bank is credible more than that of Lloyd bank.
Profitability Ratios
Table 3: Lloyd Profitability Ratios
Profitability
Ratios
20
17
20
16
20
15
20
14
20
13
20
12
20
11
M
ea
n
Me
dia
n
Standard
Deviatio
n
Coefficient
of Variation
Return on
Shareholder's
Equity %
8.1
4
%
5.8
4
%
2.3
1
%
3.4
6
%
-
2.0
6%
-
3.1
5%
-
5.9
1%
1.5
7
%
2.3
1%
0.0510 326.06%
Return on Total
Assets %
3.6
7
%
2.0
0
%
2.1
0
%
1.2
7
%
1.6
5%
4.1
5%
4.1
0%
3.0
1
%
2.1
0%
0.0122 40.74%
⊘ This is a preview!⊘
Do you want full access?
Subscribe today to unlock all pages.
Trusted by 1+ million students worldwide
9BANK FINANCIAL RISK MANAGEMENT
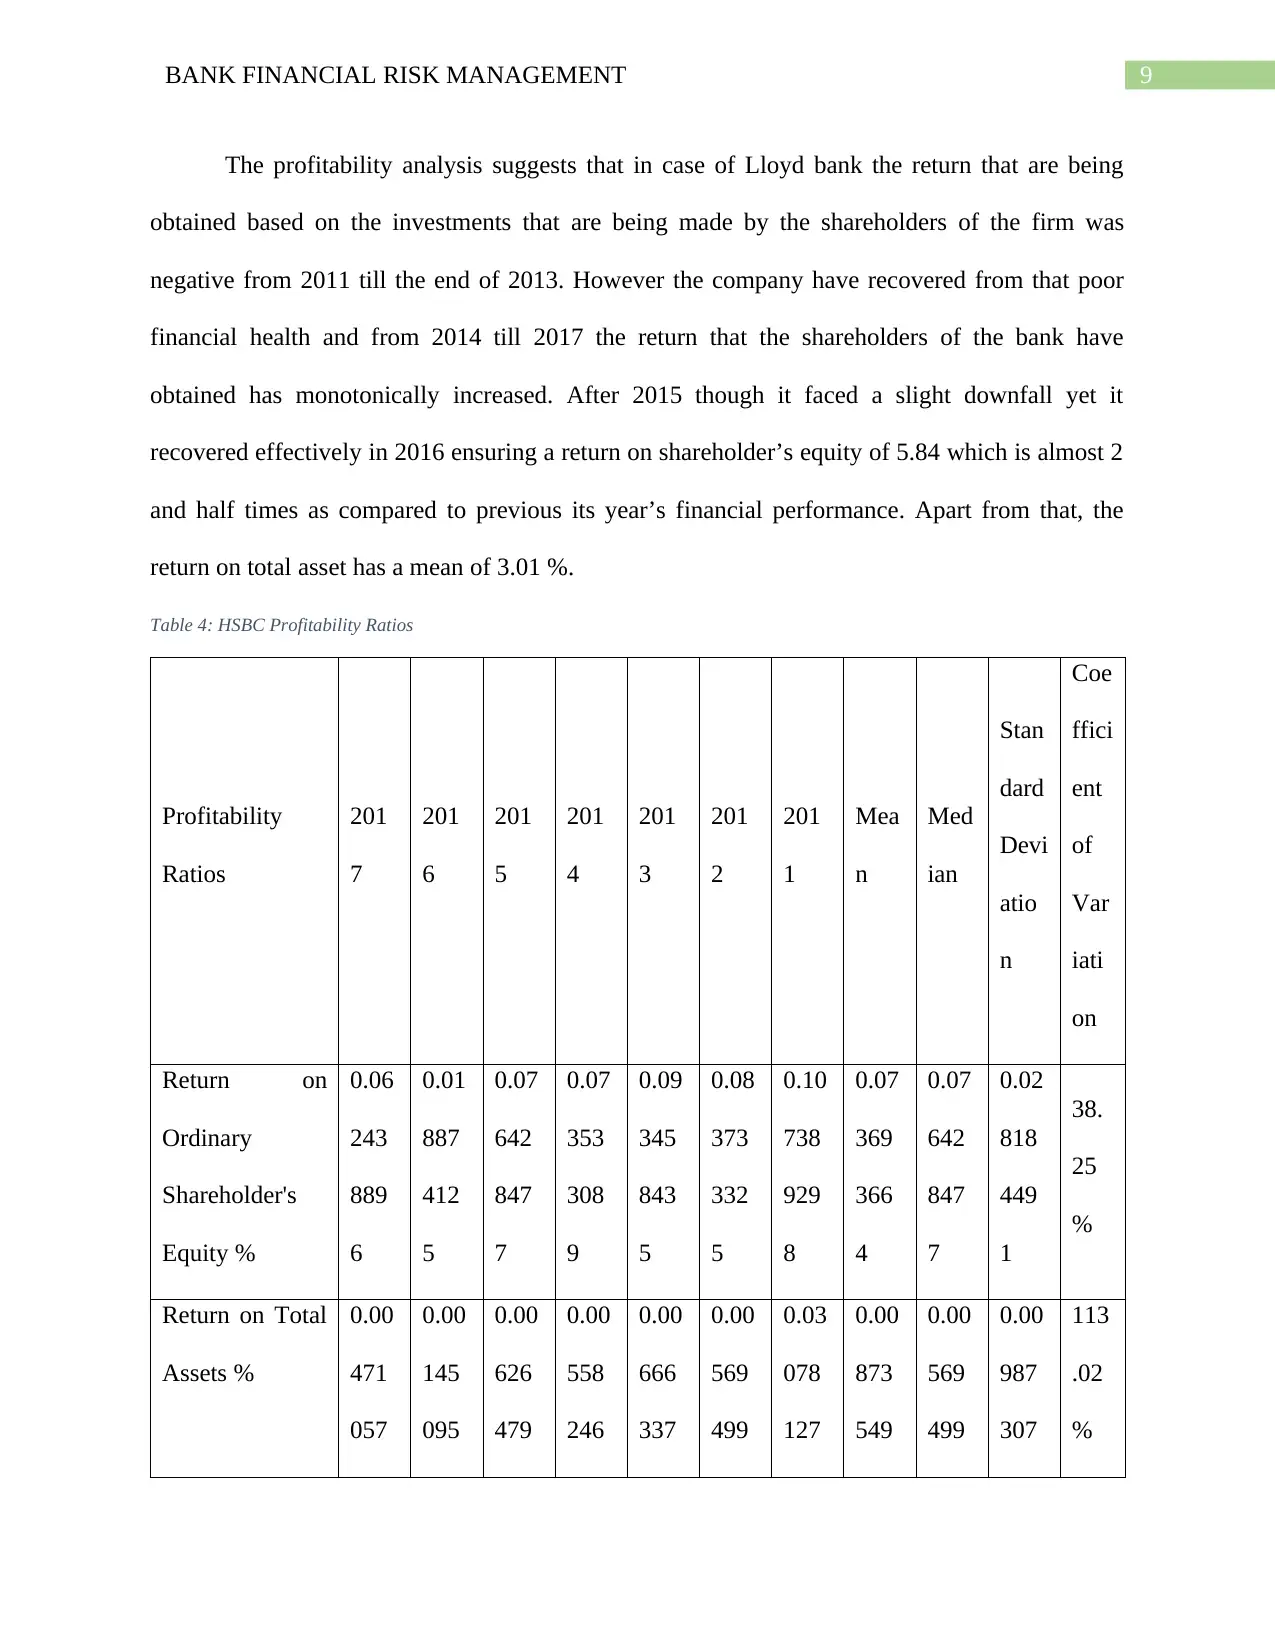
The profitability analysis suggests that in case of Lloyd bank the return that are being
obtained based on the investments that are being made by the shareholders of the firm was
negative from 2011 till the end of 2013. However the company have recovered from that poor
financial health and from 2014 till 2017 the return that the shareholders of the bank have
obtained has monotonically increased. After 2015 though it faced a slight downfall yet it
recovered effectively in 2016 ensuring a return on shareholder’s equity of 5.84 which is almost 2
and half times as compared to previous its year’s financial performance. Apart from that, the
return on total asset has a mean of 3.01 %.
Table 4: HSBC Profitability Ratios
Profitability
Ratios
201
7
201
6
201
5
201
4
201
3
201
2
201
1
Mea
n
Med
ian
Stan
dard
Devi
atio
n
Coe
ffici
ent
of
Var
iati
on
Return on
Ordinary
Shareholder's
Equity %
0.06
243
889
6
0.01
887
412
5
0.07
642
847
7
0.07
353
308
9
0.09
345
843
5
0.08
373
332
5
0.10
738
929
8
0.07
369
366
4
0.07
642
847
7
0.02
818
449
1
38.
25
%
Return on Total
Assets %
0.00
471
057
0.00
145
095
0.00
626
479
0.00
558
246
0.00
666
337
0.00
569
499
0.03
078
127
0.00
873
549
0.00
569
499
0.00
987
307
113
.02
%
Paraphrase This Document
Need a fresh take? Get an instant paraphrase of this document with our AI Paraphraser
10BANK FINANCIAL RISK MANAGEMENT
8 6 5 9 7 9 6 3 9 1
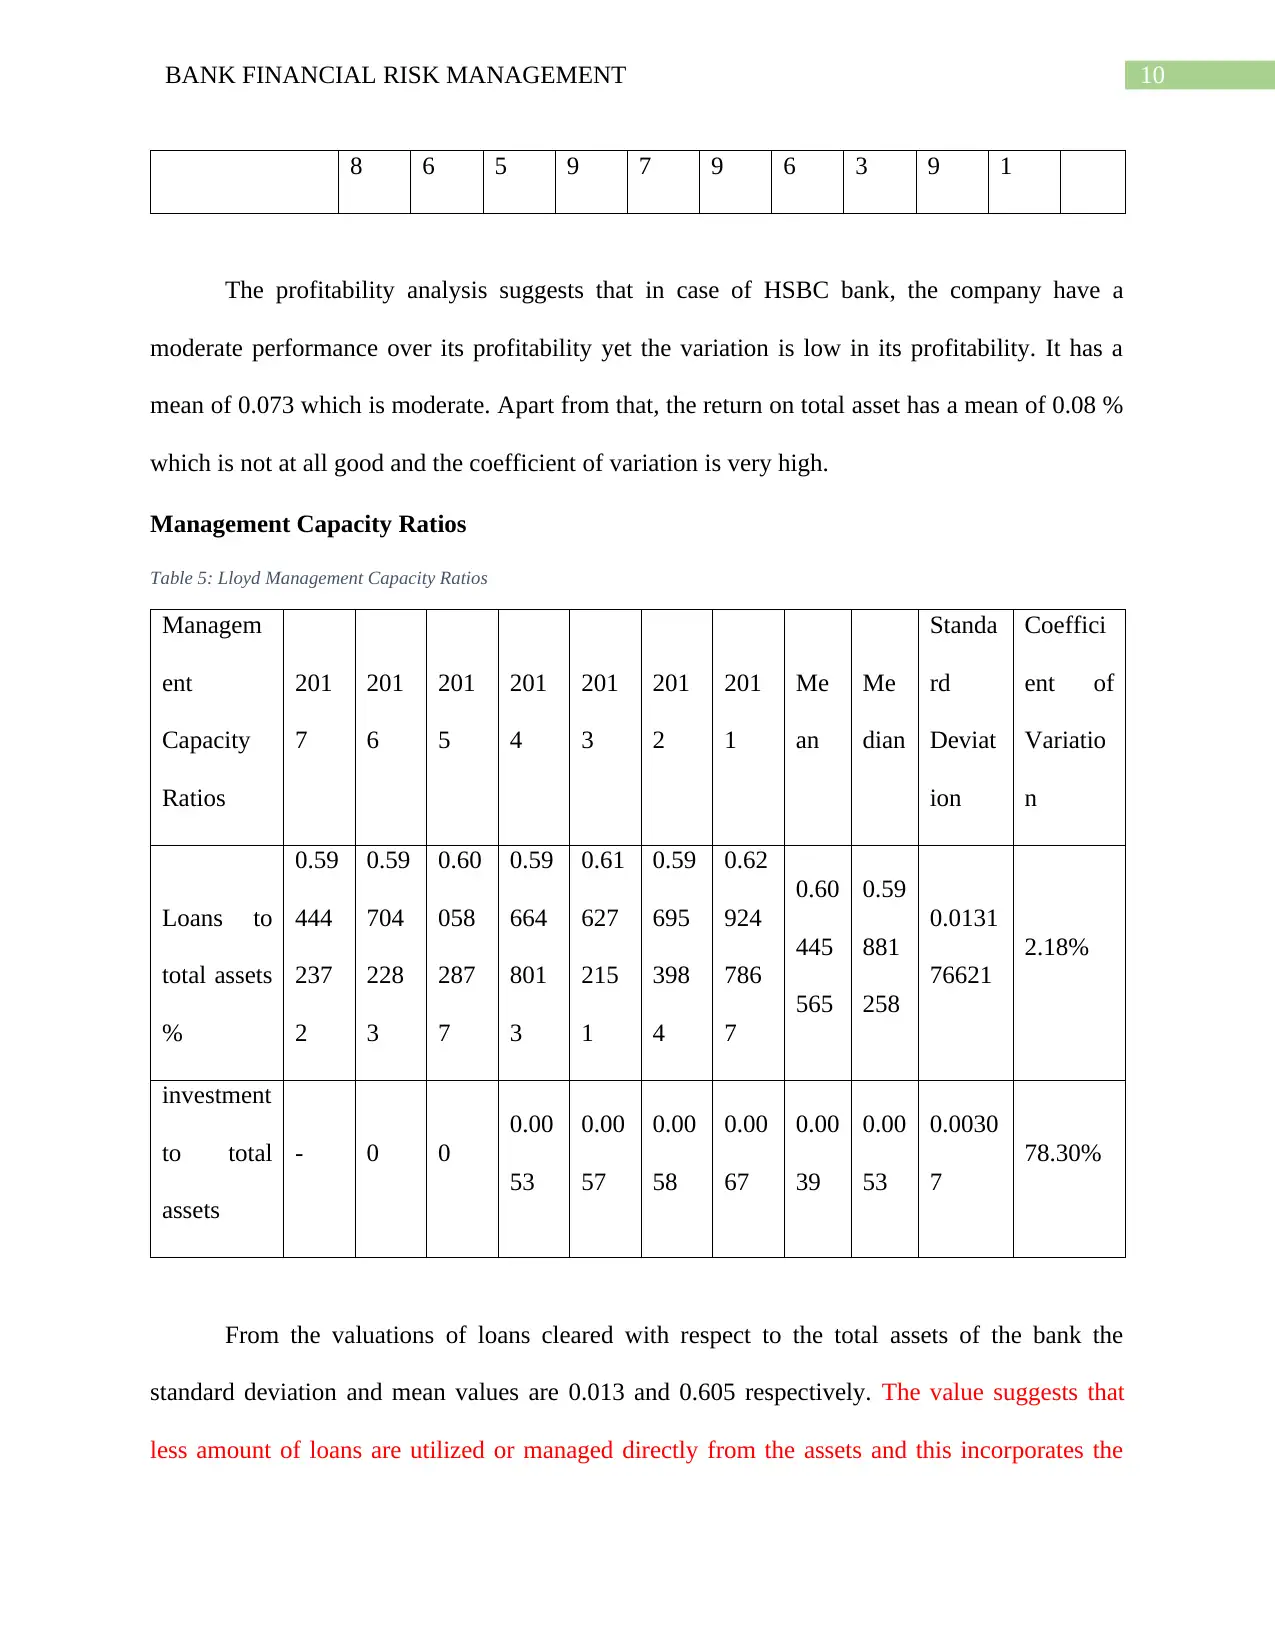
The profitability analysis suggests that in case of HSBC bank, the company have a
moderate performance over its profitability yet the variation is low in its profitability. It has a
mean of 0.073 which is moderate. Apart from that, the return on total asset has a mean of 0.08 %
which is not at all good and the coefficient of variation is very high.
Management Capacity Ratios
Table 5: Lloyd Management Capacity Ratios
Managem
ent
Capacity
Ratios
201
7
201
6
201
5
201
4
201
3
201
2
201
1
Me
an
Me
dian
Standa
rd
Deviat
ion
Coeffici
ent of
Variatio
n
Loans to
total assets
%
0.59
444
237
2
0.59
704
228
3
0.60
058
287
7
0.59
664
801
3
0.61
627
215
1
0.59
695
398
4
0.62
924
786
7
0.60
445
565
0.59
881
258
0.0131
76621
2.18%
investment
to total
assets
- 0 0
0.00
53
0.00
57
0.00
58
0.00
67
0.00
39
0.00
53
0.0030
7
78.30%
From the valuations of loans cleared with respect to the total assets of the bank the
standard deviation and mean values are 0.013 and 0.605 respectively. The value suggests that
less amount of loans are utilized or managed directly from the assets and this incorporates the
8 6 5 9 7 9 6 3 9 1
The profitability analysis suggests that in case of HSBC bank, the company have a
moderate performance over its profitability yet the variation is low in its profitability. It has a
mean of 0.073 which is moderate. Apart from that, the return on total asset has a mean of 0.08 %
which is not at all good and the coefficient of variation is very high.
Management Capacity Ratios
Table 5: Lloyd Management Capacity Ratios
Managem
ent
Capacity
Ratios
201
7
201
6
201
5
201
4
201
3
201
2
201
1
Me
an
Me
dian
Standa
rd
Deviat
ion
Coeffici
ent of
Variatio
n
Loans to
total assets
%
0.59
444
237
2
0.59
704
228
3
0.60
058
287
7
0.59
664
801
3
0.61
627
215
1
0.59
695
398
4
0.62
924
786
7
0.60
445
565
0.59
881
258
0.0131
76621
2.18%
investment
to total
assets
- 0 0
0.00
53
0.00
57
0.00
58
0.00
67
0.00
39
0.00
53
0.0030
7
78.30%
From the valuations of loans cleared with respect to the total assets of the bank the
standard deviation and mean values are 0.013 and 0.605 respectively. The value suggests that
less amount of loans are utilized or managed directly from the assets and this incorporates the
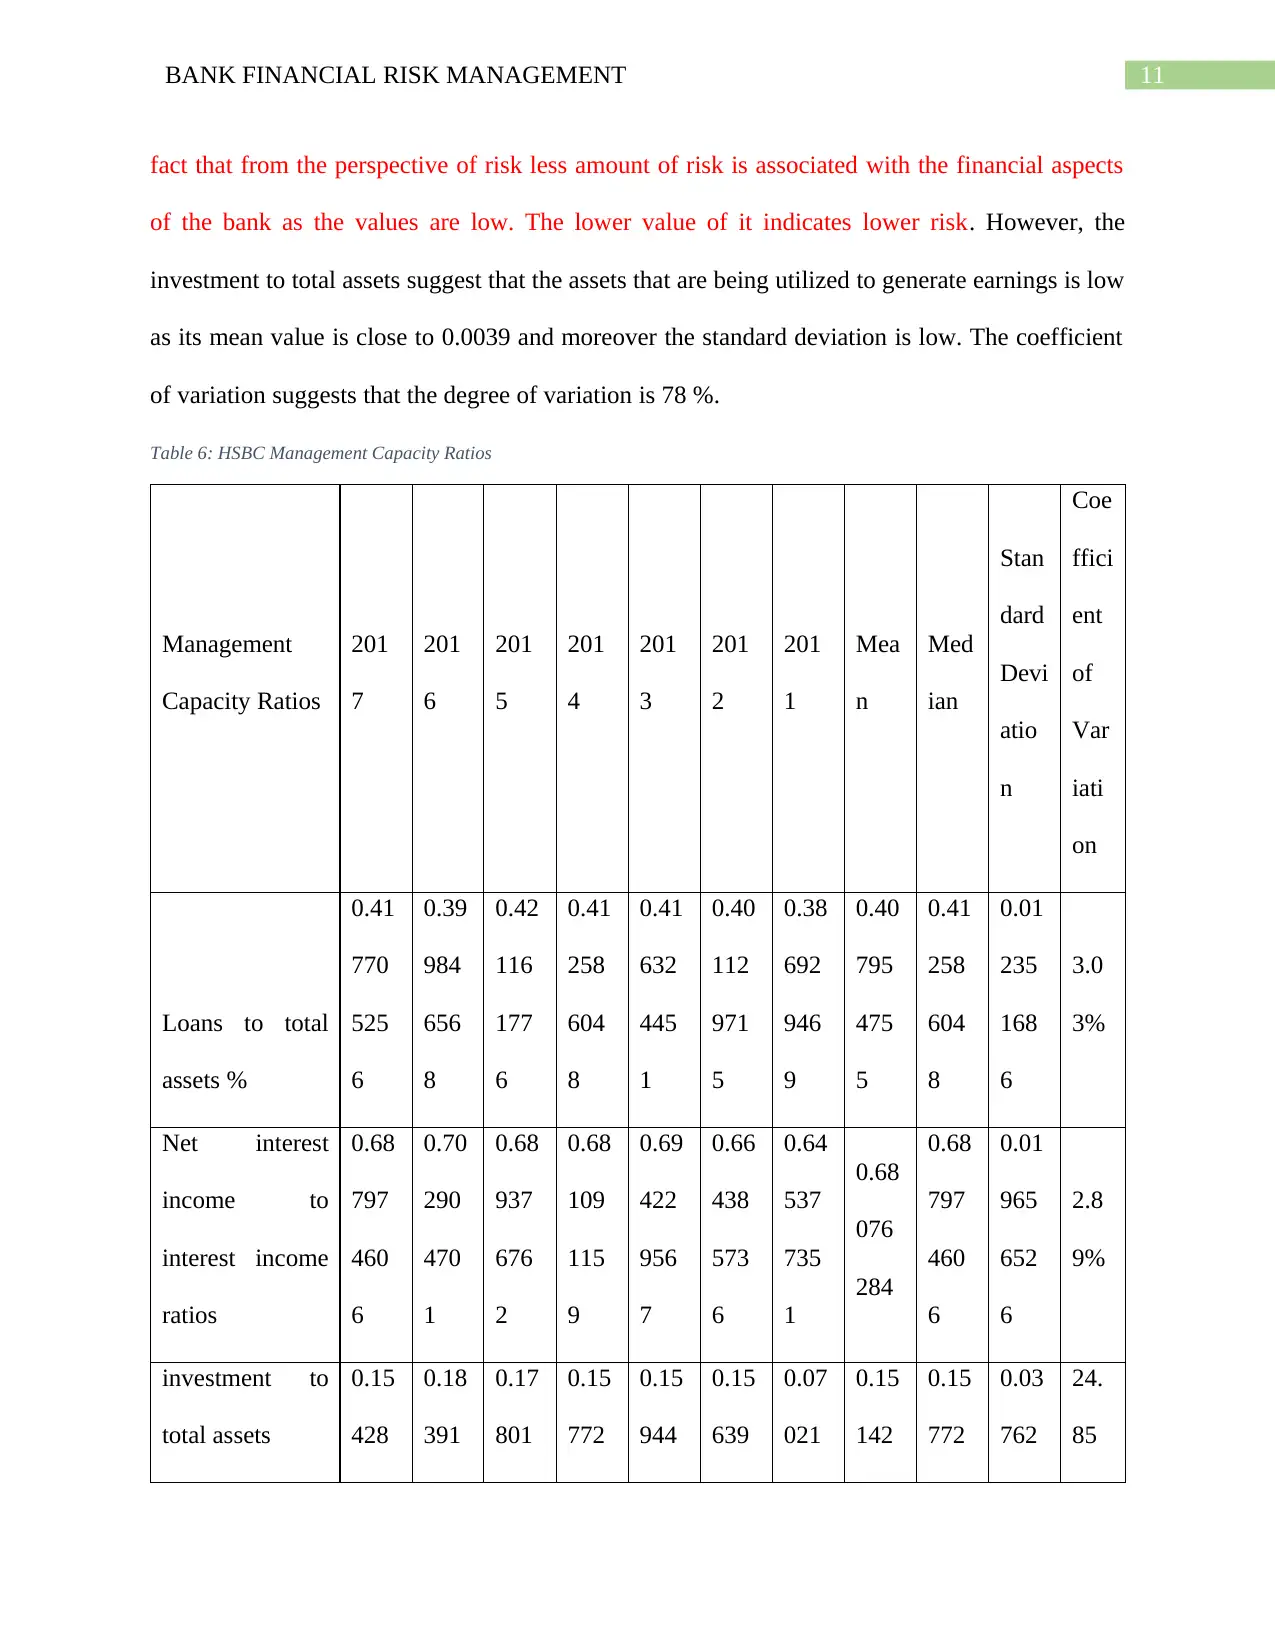
11BANK FINANCIAL RISK MANAGEMENT
fact that from the perspective of risk less amount of risk is associated with the financial aspects
of the bank as the values are low. The lower value of it indicates lower risk. However, the
investment to total assets suggest that the assets that are being utilized to generate earnings is low
as its mean value is close to 0.0039 and moreover the standard deviation is low. The coefficient
of variation suggests that the degree of variation is 78 %.
Table 6: HSBC Management Capacity Ratios
Management
Capacity Ratios
201
7
201
6
201
5
201
4
201
3
201
2
201
1
Mea
n
Med
ian
Stan
dard
Devi
atio
n
Coe
ffici
ent
of
Var
iati
on
Loans to total
assets %
0.41
770
525
6
0.39
984
656
8
0.42
116
177
6
0.41
258
604
8
0.41
632
445
1
0.40
112
971
5
0.38
692
946
9
0.40
795
475
5
0.41
258
604
8
0.01
235
168
6
3.0
3%
Net interest
income to
interest income
ratios
0.68
797
460
6
0.70
290
470
1
0.68
937
676
2
0.68
109
115
9
0.69
422
956
7
0.66
438
573
6
0.64
537
735
1
0.68
076
284
0.68
797
460
6
0.01
965
652
6
2.8
9%
investment to
total assets
0.15
428
0.18
391
0.17
801
0.15
772
0.15
944
0.15
639
0.07
021
0.15
142
0.15
772
0.03
762
24.
85
⊘ This is a preview!⊘
Do you want full access?
Subscribe today to unlock all pages.
Trusted by 1+ million students worldwide
1 out of 18
Related Documents


Your All-in-One AI-Powered Toolkit for Academic Success.
+13062052269
info@desklib.com
Available 24*7 on WhatsApp / Email
![[object Object]](/_next/static/media/star-bottom.7253800d.svg)
Unlock your academic potential
Copyright © 2020–2026 A2Z Services. All Rights Reserved. Developed and managed by ZUCOL.