Comparative Financial Risk Analysis: HSBC and Lloyds Bank Report
VerifiedAdded on 2021/12/13
|17
|1792
|65
Report
AI Summary
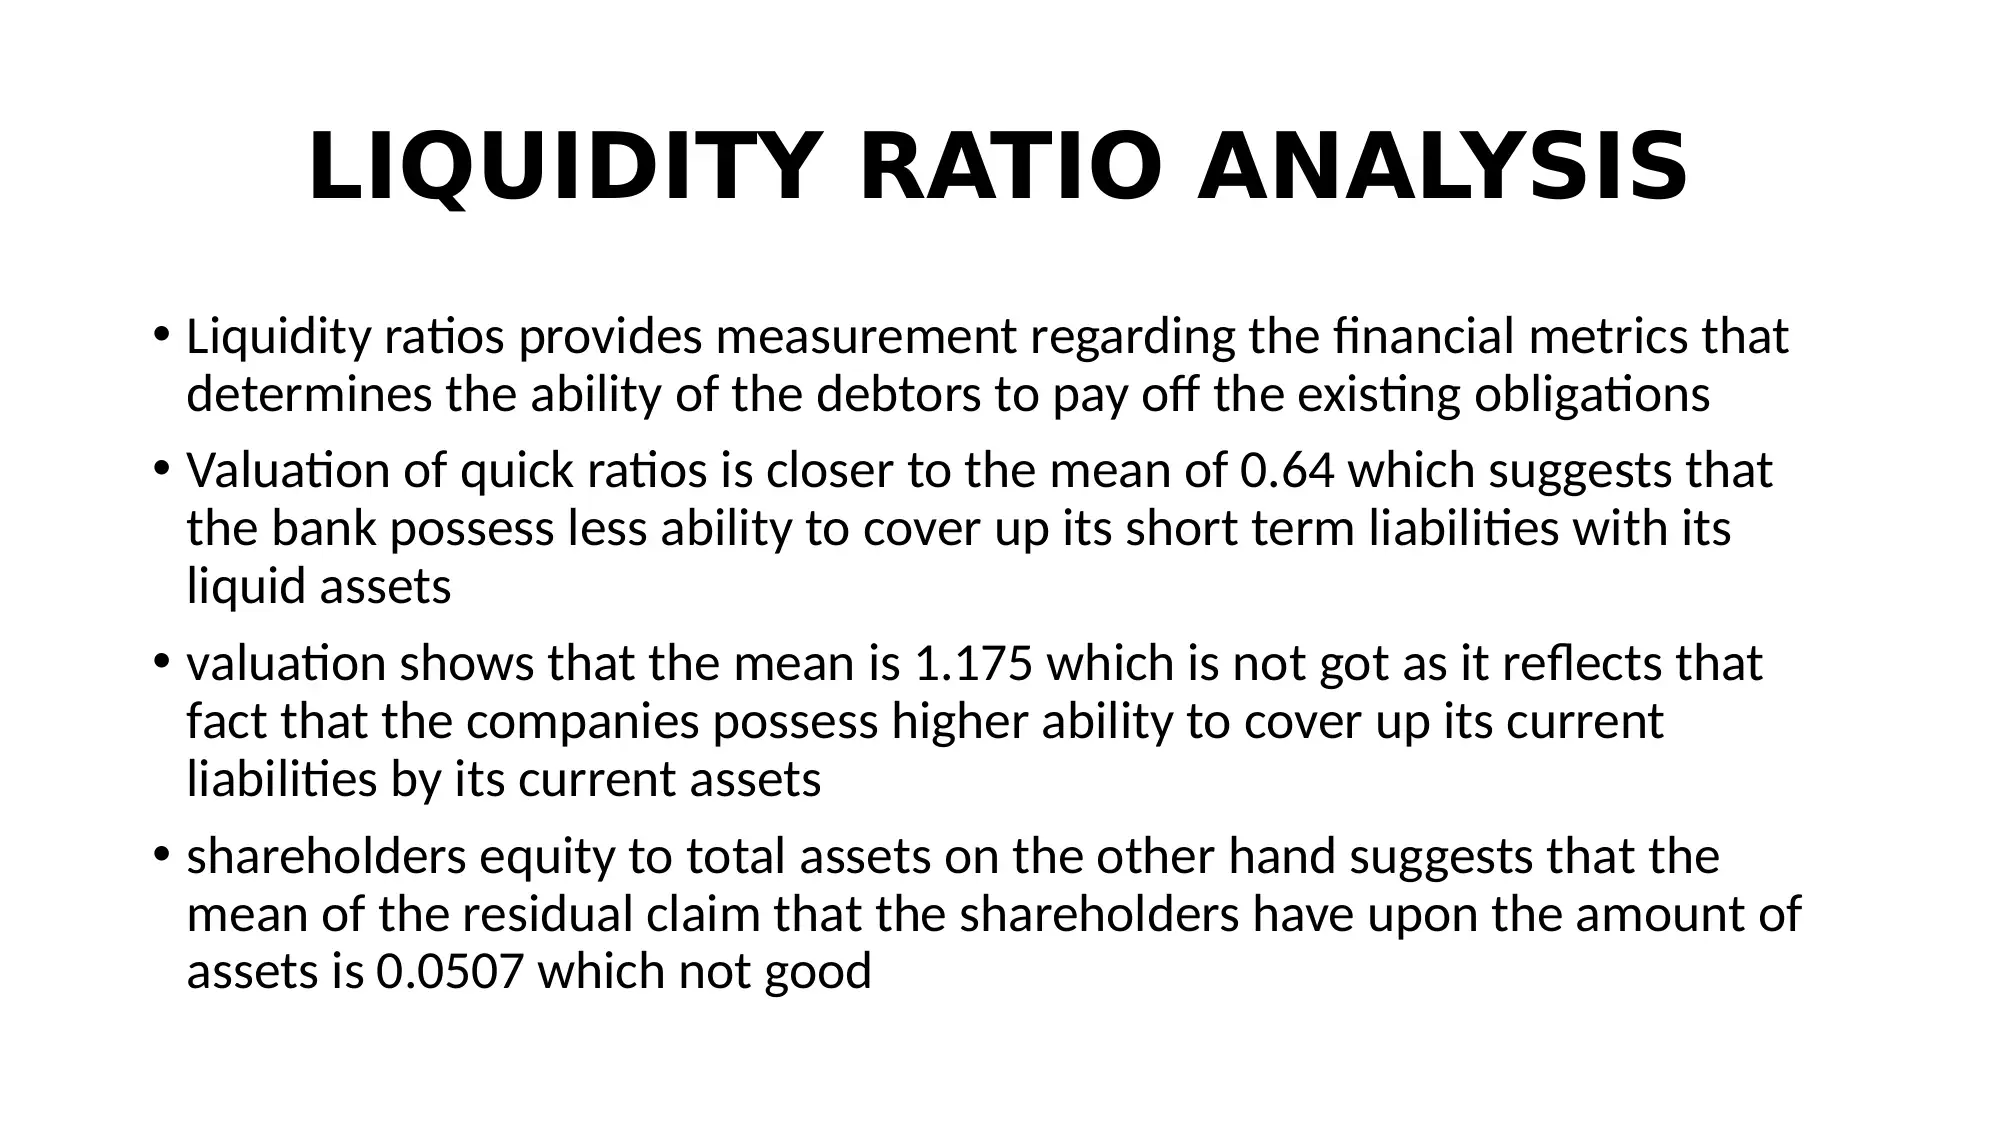
This report provides a comparative analysis of financial risk management in HSBC and Lloyds banks from 2011 to 2017. The study utilizes a descriptive research design and a deductive approach, analyzing secondary data from the banks' annual reports. Financial ratios, including liquidity, profitability, management capacity, capital structure, and growth ratios, are computed and compared. The analysis reveals that both banks face various financial risks, with HSBC demonstrating a stronger capital structure and better risk mitigation abilities compared to Lloyds Bank. The report highlights key findings on liquidity positions, asset quality, and earnings, offering insights into the banks' financial health and performance over the studied period. The conclusion emphasizes the variability in HSBC's financial metrics compared to Lloyds, suggesting a more credible dispersion in HSBC's performance. The study also incorporates a review of existing literature on financial risk, providing a comprehensive overview of the topic. The report concludes by summarizing the key differences in capital structure and relative variability between the two banks.

BANK FINANCIAL RISK
MANAGEMENT
Name of the Student –
Name of the University -
MANAGEMENT
Name of the Student –
Name of the University -
Paraphrase This Document
Need a fresh take? Get an instant paraphrase of this document with our AI Paraphraser

INTRODUCTION
• Purpose of risk management in case of Lloyd bank & HSBC bank is to
detect the financial problems before they takes place & handle the
uncertainties that exists in the industry
• Effective risk management invokes strategic approach in these banks
that will mitigate adverse impacts yet will be able to optimize the
objectives of the firms
• Financial ratios help the banks to examine the state of efficiency,
liquidity as well as gaps in financial performance of the banks and in
segments where it can improve its functionality

BACKGROUND INFORMATION
• Being a multinational company HSBC bank is the 7th largest banking and
financial service group that was established in 1865 in British Hong Kong
• HSBC expanded its business worldwide and currently have its presence in
73 countries
• With more than 6100 offices and its global headquarter in London, HSBC
encompasses nearby 216000 shareholders possessing 228687 employees
• HSBC’s market capitalization of 182 billion US dollars by 2017 followed
by having a total number of assets of $ 2.521 trillion, total equity of
190.24 billion US dollars
• operating income of the company is close to $ 14.792 billion and the net
income is of $ 11.879 billion by 2017.
⊘ This is a preview!⊘
Do you want full access?
Subscribe today to unlock all pages.

Trusted by 1+ million students worldwide

• Operating income of HSBC is $ 14.792 billion and the net income is of
$ 11.879 billion by 2017
• HSBC is involved in retail banking, mortgage loans, insurance, wealth
management, private banking, investment as well as corporate
banking and has a customer base of 51 million worldwide
• . Lloyd bank on the other hand is headquartered in London, and is
among the big four clearing banks involved in retail and commercial
banking
• Lloyd bank provides insurance services and by 2016 possessed an
employee strength of 45856
• The operating income of Lloyd bank is 17.5 billion, followed by net
income of 16.6 billion and average income earning banking assets of
436 billion
Paraphrase This Document
Need a fresh take? Get an instant paraphrase of this document with our AI Paraphraser

RESEARCH OBJECTIVE
• The objective of the research encompasses the aspect of determining
the financial ratios of HSBC and Lloyd banks
• To compare the financial development and ability to manage financial
risks of the banks for the period 2011-2017
• The objective of the research encompasses the aspect of determining
the financial ratios of HSBC and Lloyd banks
• To compare the financial development and ability to manage financial
risks of the banks for the period 2011-2017

RESEARCH METHODOLOGY
• Methodology of the research is done through descriptive research
design and maintaining a deductive research approach
• Data of 2011-2017 are gathered from the annual reports of the
respective banks
• Secondary data are collected and interpreted after comparison
between the banks of the obtained computations of the financial
ratios
• Financial information thus obtained are further being analyzed
through quantitative measurements
⊘ This is a preview!⊘
Do you want full access?
Subscribe today to unlock all pages.

Trusted by 1+ million students worldwide

LITERATURE REVIEW
• According to Yan et al. (2017), adaptive analysis of the pass trends of the financial
ratios can provide a predictive measures that needs to be undertaken for reducing
the financial risks involved
• Beside operational risk, reputational risk, the banks faces liquidity risks to cover up
its liabilities with its assets as well as market risks which are nothing but systematic
risks in the business
• In accordance with Black et al. (2016), it assessed the performance of banks
financially and depicted that financial ratios are effective estimators of the
responsive of firms to understand its performance overtime
• Wealth management, liquidity positions, asset quality, earning ability
measurements are found to be important parameters that determine financial
health of the ban
Paraphrase This Document
Need a fresh take? Get an instant paraphrase of this document with our AI Paraphraser

FINANCIAL RATIO ANALYSIS
•Liquidity Ratio Analysis
•Profitability Ratio Analysis
•Management Capacity Ratio Analysis
•Capital Structure ratio Analysis
•Growth Ratio Analysis
•Liquidity Ratio Analysis
•Profitability Ratio Analysis
•Management Capacity Ratio Analysis
•Capital Structure ratio Analysis
•Growth Ratio Analysis

LIQUIDITY RATIO ANALYSIS
• Liquidity ratios provides measurement regarding the financial metrics that
determines the ability of the debtors to pay off the existing obligations
• Valuation of quick ratios is closer to the mean of 0.64 which suggests that
the bank possess less ability to cover up its short term liabilities with its
liquid assets
• valuation shows that the mean is 1.175 which is not got as it reflects that
fact that the companies possess higher ability to cover up its current
liabilities by its current assets
• shareholders equity to total assets on the other hand suggests that the
mean of the residual claim that the shareholders have upon the amount of
assets is 0.0507 which not good
⊘ This is a preview!⊘
Do you want full access?
Subscribe today to unlock all pages.

Trusted by 1+ million students worldwide

PROFITIBALITY RATIO
• Lloyd bank has negative returns from 2011 till the end of 2013
• However it have recovered from that poor financial health and from
2014 till 2017 the return that the shareholders of the bank have obtained
has monotonically increased
• 2015 though it faced a slight downfall yet it recovered effectively in 2016
ensuring a return on shareholder’s equity of 5.84 which is almost 2 and
half times as compared to previous its year’s financial performance
• For HSBC the return on total asset the profitability ratio reveals that the
mean of 0.08 % which is not at all good and the coefficient of variation is
very high
Paraphrase This Document
Need a fresh take? Get an instant paraphrase of this document with our AI Paraphraser

MANAGEMENT CAPACITY RATIO
• From the valuations of loans cleared with respect to the total assets of the
bank the standard deviation and mean values are 0.013 and 0.605
respectively for Lloyd
• The lower value of it indicates lower risk
• investment to total assets suggest that the assets that are being utilized to
generate earnings is low as its mean value is close to 0.0039
• coefficient of variation suggests that the degree of variation is 78 %.
• Notably, the investment to total assets suggest that the assets that are being
utilized to generate earnings is low as its mean value is close to 0.15 and the
standard deviation is low. The coefficient of variation suggests that the degree
of variation is 24.85 %.

CAPITAL STRUCTURE RATIO
• The coefficient of variation in case of Lloyd bank is 0.66 % where as
for HSBC it is 33.6 %
• The mean and standard deviation is high for Lloyd bank compared to
HSBC b
• investment to total assets suggest that the assets that are being
utilized to generate earnings is low as its mean value is close to 0.15
and the standard deviation is low
• Capital structure of Lloyd bank is much more feasible as compared to
HSBC bank
⊘ This is a preview!⊘
Do you want full access?
Subscribe today to unlock all pages.

Trusted by 1+ million students worldwide
1 out of 17
Related Documents

Your All-in-One AI-Powered Toolkit for Academic Success.
+13062052269
info@desklib.com
Available 24*7 on WhatsApp / Email
Unlock your academic potential
© 2024 | Zucol Services PVT LTD | All rights reserved.