Financial Analysis: Risk and Return for Market Index and Two Shares
VerifiedAdded on  2020/04/07
|3
|720
|40
Report
AI Summary
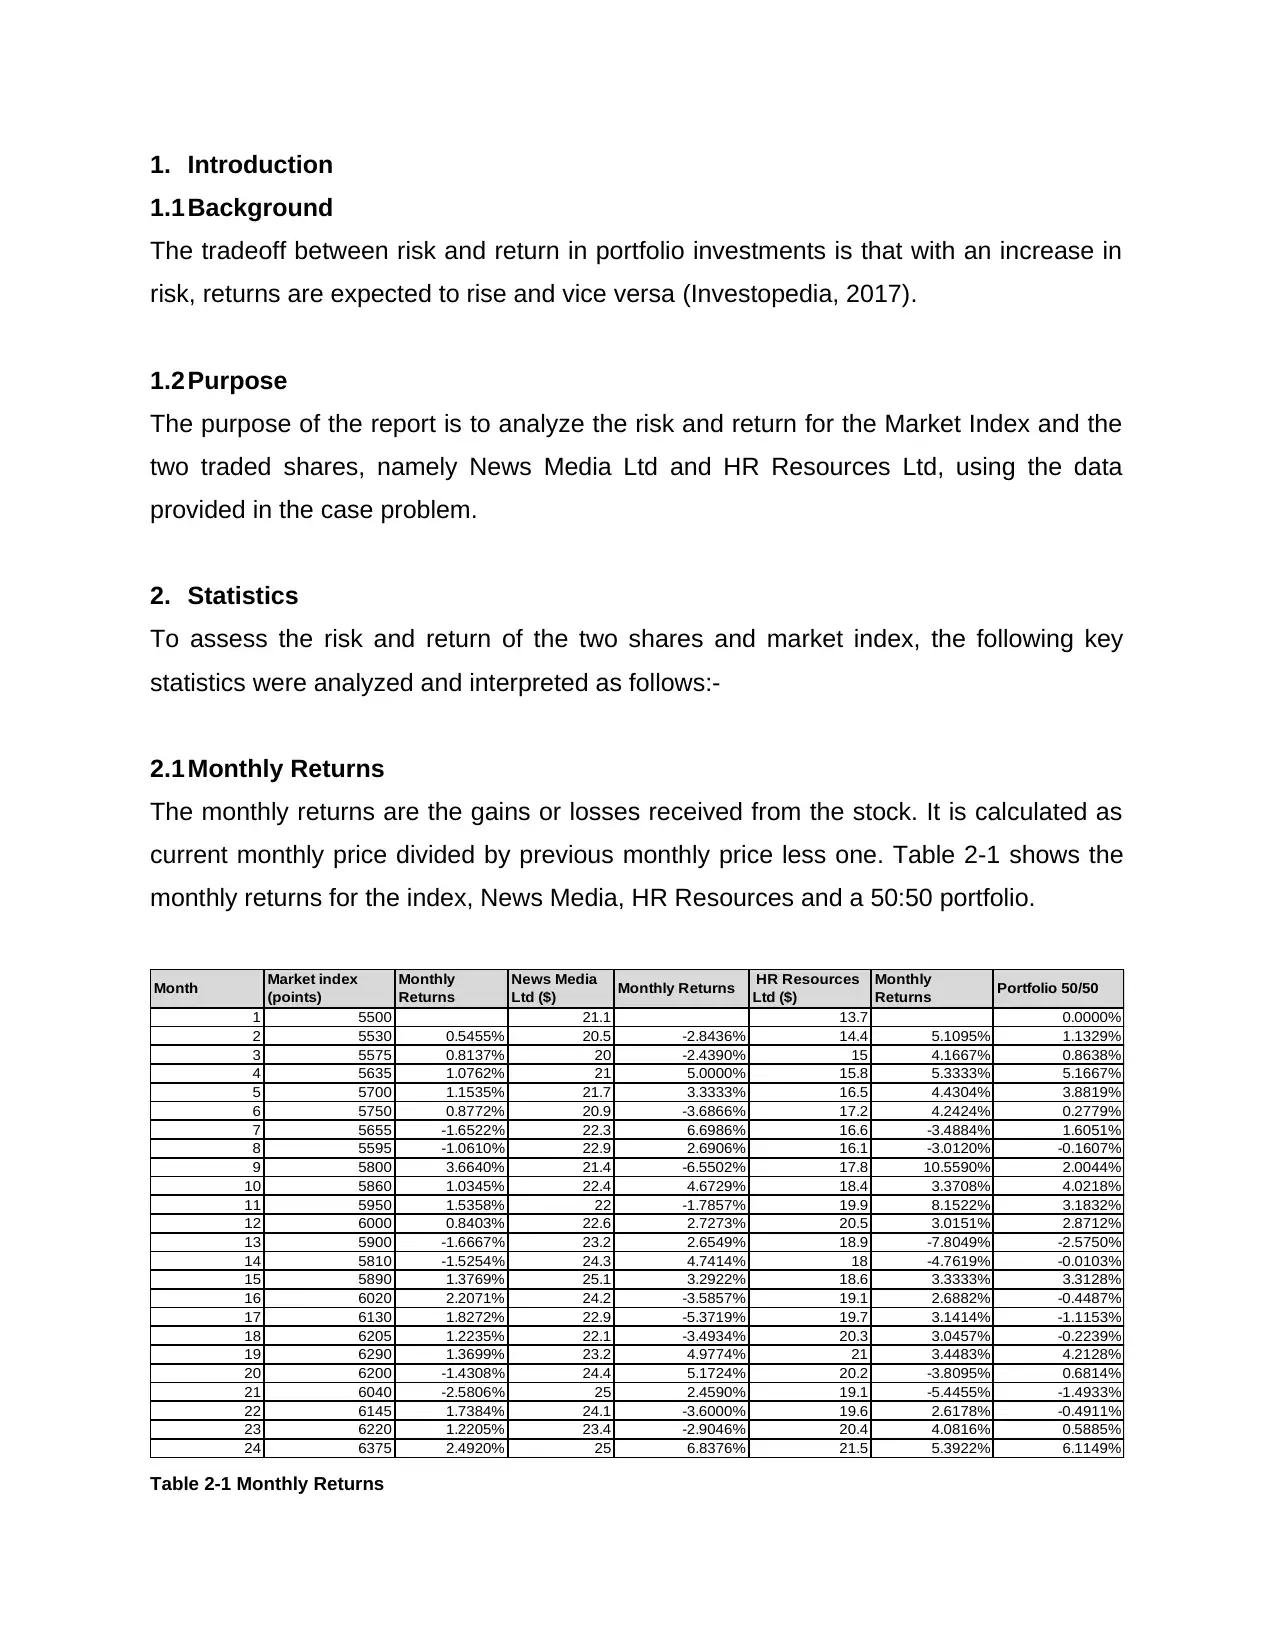
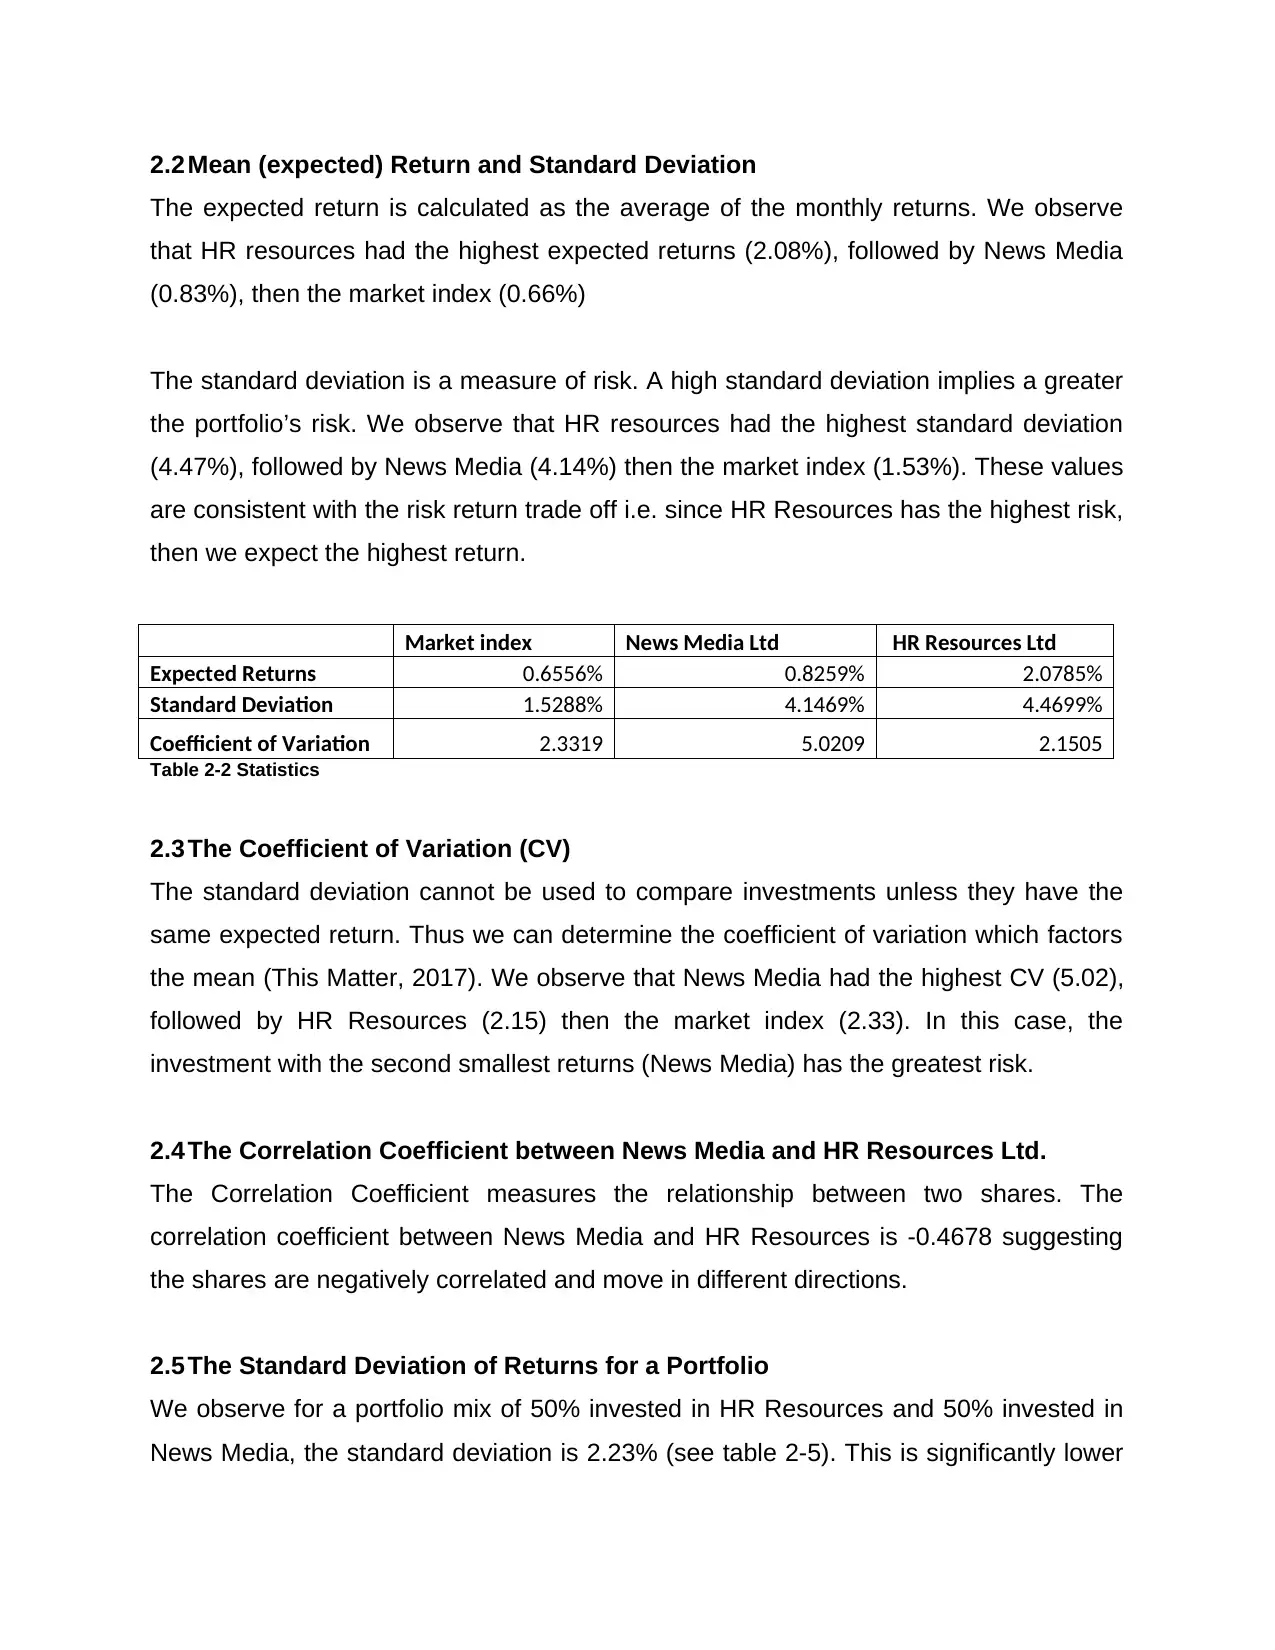
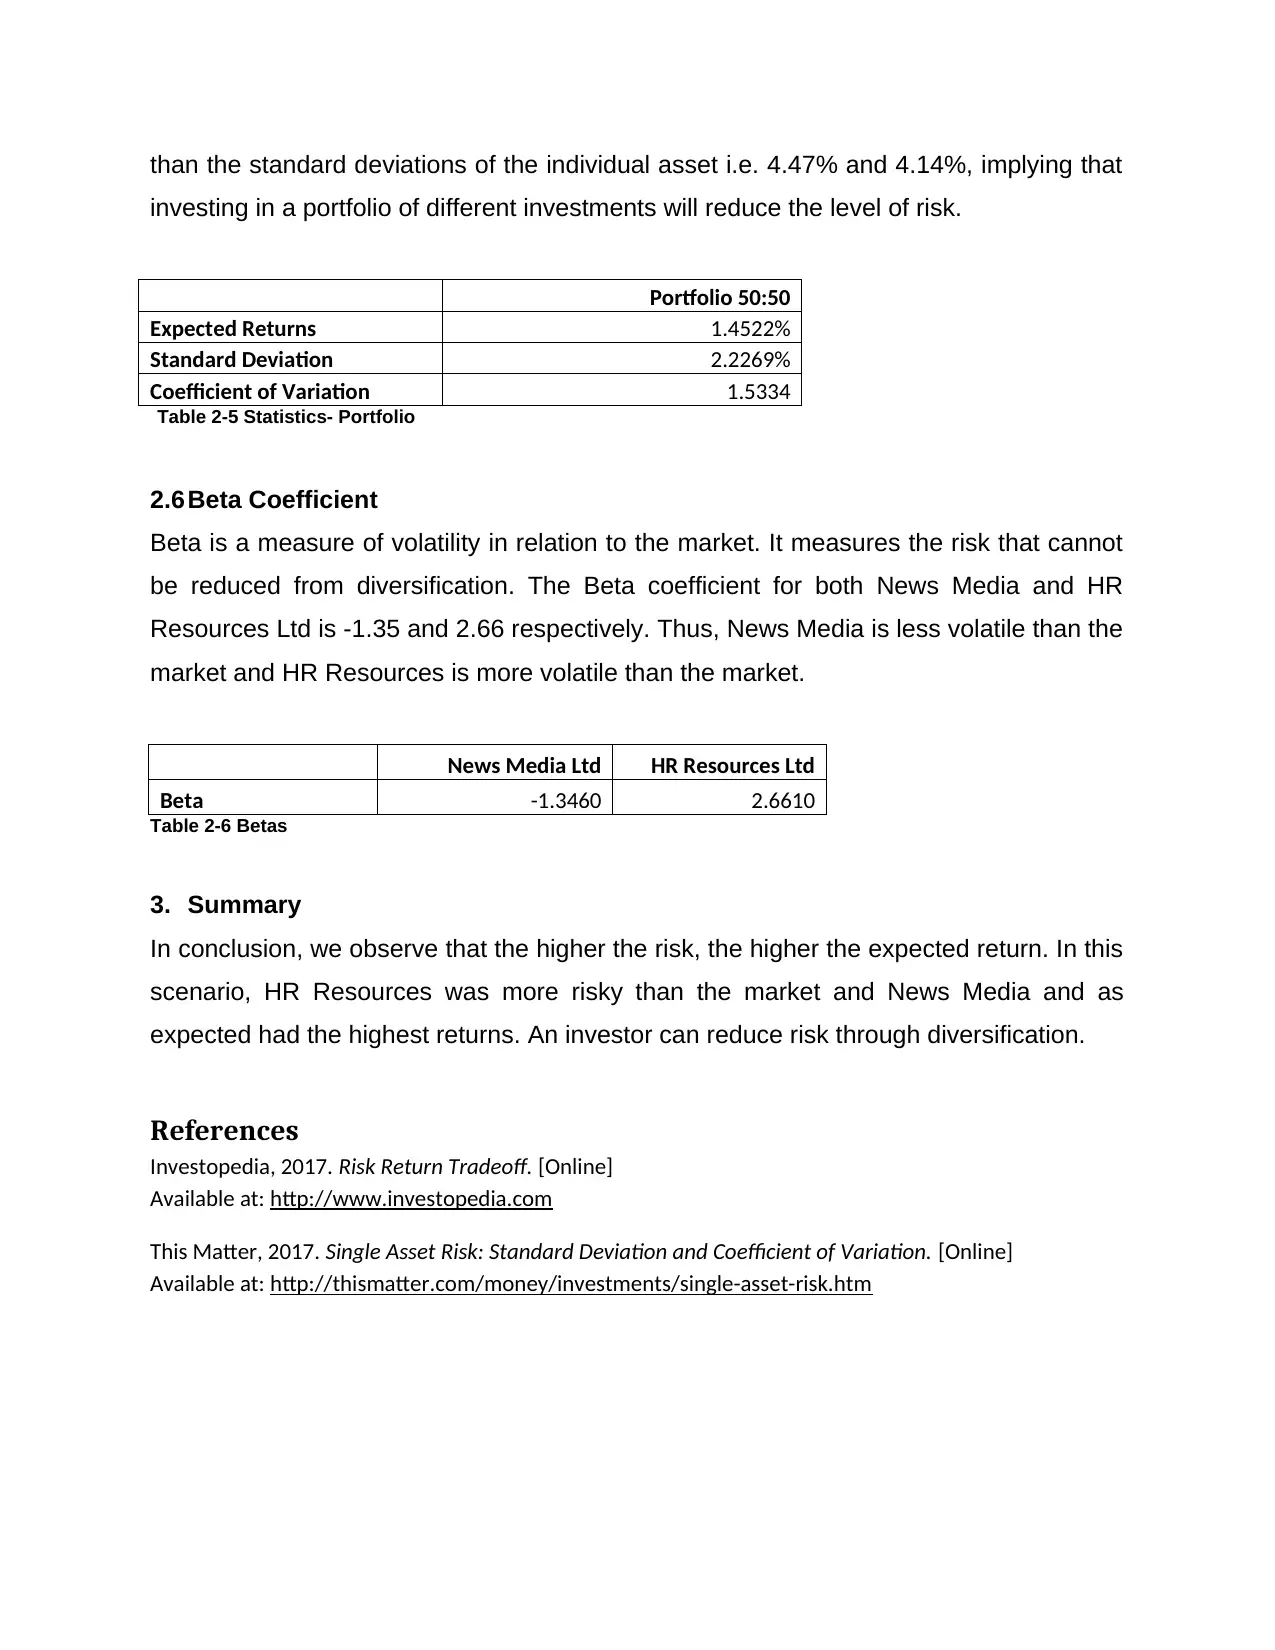
This report analyzes the risk and return of the Market Index, News Media Ltd, and HR Resources Ltd. It examines key financial statistics like monthly returns, expected returns, standard deviation, coefficient of variation, correlation coefficients, and beta coefficients to assess investment risk. The analysis reveals that HR Resources, with the highest standard deviation, also has the highest expected returns, supporting the risk-return tradeoff. The report also highlights how diversification through a 50:50 portfolio of HR Resources and News Media can reduce overall risk. The beta coefficients further illustrate the volatility of each share relative to the market. The report concludes that higher risk investments can provide higher returns and that diversification is a useful tool to manage risk.

1. Introduction
1.1 Background
The tradeoff between risk and return in portfolio investments is that with an increase in
risk, returns are expected to rise and vice versa (Investopedia, 2017).
1.2 Purpose
The purpose of the report is to analyze the risk and return for the Market Index and the
two traded shares, namely News Media Ltd and HR Resources Ltd, using the data
provided in the case problem.
2. Statistics
To assess the risk and return of the two shares and market index, the following key
statistics were analyzed and interpreted as follows:-
2.1 Monthly Returns
The monthly returns are the gains or losses received from the stock. It is calculated as
current monthly price divided by previous monthly price less one. Table 2-1 shows the
monthly returns for the index, News Media, HR Resources and a 50:50 portfolio.
Month Market index
(points)
Monthly
Returns
News Media
Ltd ($) Monthly Returns HR Resources
Ltd ($)
Monthly
Returns Portfolio 50/50
1 5500 21.1 13.7 0.0000%
2 5530 0.5455% 20.5 -2.8436% 14.4 5.1095% 1.1329%
3 5575 0.8137% 20 -2.4390% 15 4.1667% 0.8638%
4 5635 1.0762% 21 5.0000% 15.8 5.3333% 5.1667%
5 5700 1.1535% 21.7 3.3333% 16.5 4.4304% 3.8819%
6 5750 0.8772% 20.9 -3.6866% 17.2 4.2424% 0.2779%
7 5655 -1.6522% 22.3 6.6986% 16.6 -3.4884% 1.6051%
8 5595 -1.0610% 22.9 2.6906% 16.1 -3.0120% -0.1607%
9 5800 3.6640% 21.4 -6.5502% 17.8 10.5590% 2.0044%
10 5860 1.0345% 22.4 4.6729% 18.4 3.3708% 4.0218%
11 5950 1.5358% 22 -1.7857% 19.9 8.1522% 3.1832%
12 6000 0.8403% 22.6 2.7273% 20.5 3.0151% 2.8712%
13 5900 -1.6667% 23.2 2.6549% 18.9 -7.8049% -2.5750%
14 5810 -1.5254% 24.3 4.7414% 18 -4.7619% -0.0103%
15 5890 1.3769% 25.1 3.2922% 18.6 3.3333% 3.3128%
16 6020 2.2071% 24.2 -3.5857% 19.1 2.6882% -0.4487%
17 6130 1.8272% 22.9 -5.3719% 19.7 3.1414% -1.1153%
18 6205 1.2235% 22.1 -3.4934% 20.3 3.0457% -0.2239%
19 6290 1.3699% 23.2 4.9774% 21 3.4483% 4.2128%
20 6200 -1.4308% 24.4 5.1724% 20.2 -3.8095% 0.6814%
21 6040 -2.5806% 25 2.4590% 19.1 -5.4455% -1.4933%
22 6145 1.7384% 24.1 -3.6000% 19.6 2.6178% -0.4911%
23 6220 1.2205% 23.4 -2.9046% 20.4 4.0816% 0.5885%
24 6375 2.4920% 25 6.8376% 21.5 5.3922% 6.1149%
Table 2-1 Monthly Returns
Paraphrase This Document
Need a fresh take? Get an instant paraphrase of this document with our AI Paraphraser

2.2 Mean (expected) Return and Standard Deviation
The expected return is calculated as the average of the monthly returns. We observe
that HR resources had the highest expected returns (2.08%), followed by News Media
(0.83%), then the market index (0.66%)
The standard deviation is a measure of risk. A high standard deviation implies a greater
the portfolio’s risk. We observe that HR resources had the highest standard deviation
(4.47%), followed by News Media (4.14%) then the market index (1.53%). These values
are consistent with the risk return trade off i.e. since HR Resources has the highest risk,
then we expect the highest return.
Market index News Media Ltd HR Resources Ltd
Expected Returns 0.6556% 0.8259% 2.0785%
Standard Deviation 1.5288% 4.1469% 4.4699%
Coefficient of Variation 2.3319 5.0209 2.1505
Table 2-2 Statistics
2.3 The Coefficient of Variation (CV)
The standard deviation cannot be used to compare investments unless they have the
same expected return. Thus we can determine the coefficient of variation which factors
the mean (This Matter, 2017). We observe that News Media had the highest CV (5.02),
followed by HR Resources (2.15) then the market index (2.33). In this case, the
investment with the second smallest returns (News Media) has the greatest risk.
2.4 The Correlation Coefficient between News Media and HR Resources Ltd.
The Correlation Coefficient measures the relationship between two shares. The
correlation coefficient between News Media and HR Resources is -0.4678 suggesting
the shares are negatively correlated and move in different directions.
2.5 The Standard Deviation of Returns for a Portfolio
We observe for a portfolio mix of 50% invested in HR Resources and 50% invested in
News Media, the standard deviation is 2.23% (see table 2-5). This is significantly lower

than the standard deviations of the individual asset i.e. 4.47% and 4.14%, implying that
investing in a portfolio of different investments will reduce the level of risk.
Portfolio 50:50
Expected Returns 1.4522%
Standard Deviation 2.2269%
Coefficient of Variation 1.5334
Table 2-5 Statistics- Portfolio
2.6 Beta Coefficient
Beta is a measure of volatility in relation to the market. It measures the risk that cannot
be reduced from diversification. The Beta coefficient for both News Media and HR
Resources Ltd is -1.35 and 2.66 respectively. Thus, News Media is less volatile than the
market and HR Resources is more volatile than the market.
News Media Ltd HR Resources Ltd
Beta -1.3460 2.6610
Table 2-6 Betas
3. Summary
In conclusion, we observe that the higher the risk, the higher the expected return. In this
scenario, HR Resources was more risky than the market and News Media and as
expected had the highest returns. An investor can reduce risk through diversification.
References
Investopedia, 2017. Risk Return Tradeoff. [Online]
Available at: http://www.investopedia.com
This Matter, 2017. Single Asset Risk: Standard Deviation and Coefficient of Variation. [Online]
Available at: http://thismatter.com/money/investments/single-asset-risk.htm
⊘ This is a preview!⊘
Do you want full access?
Subscribe today to unlock all pages.

Trusted by 1+ million students worldwide
1 out of 3
Related Documents

Your All-in-One AI-Powered Toolkit for Academic Success.
 +13062052269
info@desklib.com
Available 24*7 on WhatsApp / Email
Unlock your academic potential
Copyright © 2020–2025 A2Z Services. All Rights Reserved. Developed and managed by ZUCOL.