Financial Analysis Report: Share Valuation of Diverse Companies
VerifiedAdded on  2021/05/30
|21
|2738
|191
Report
AI Summary
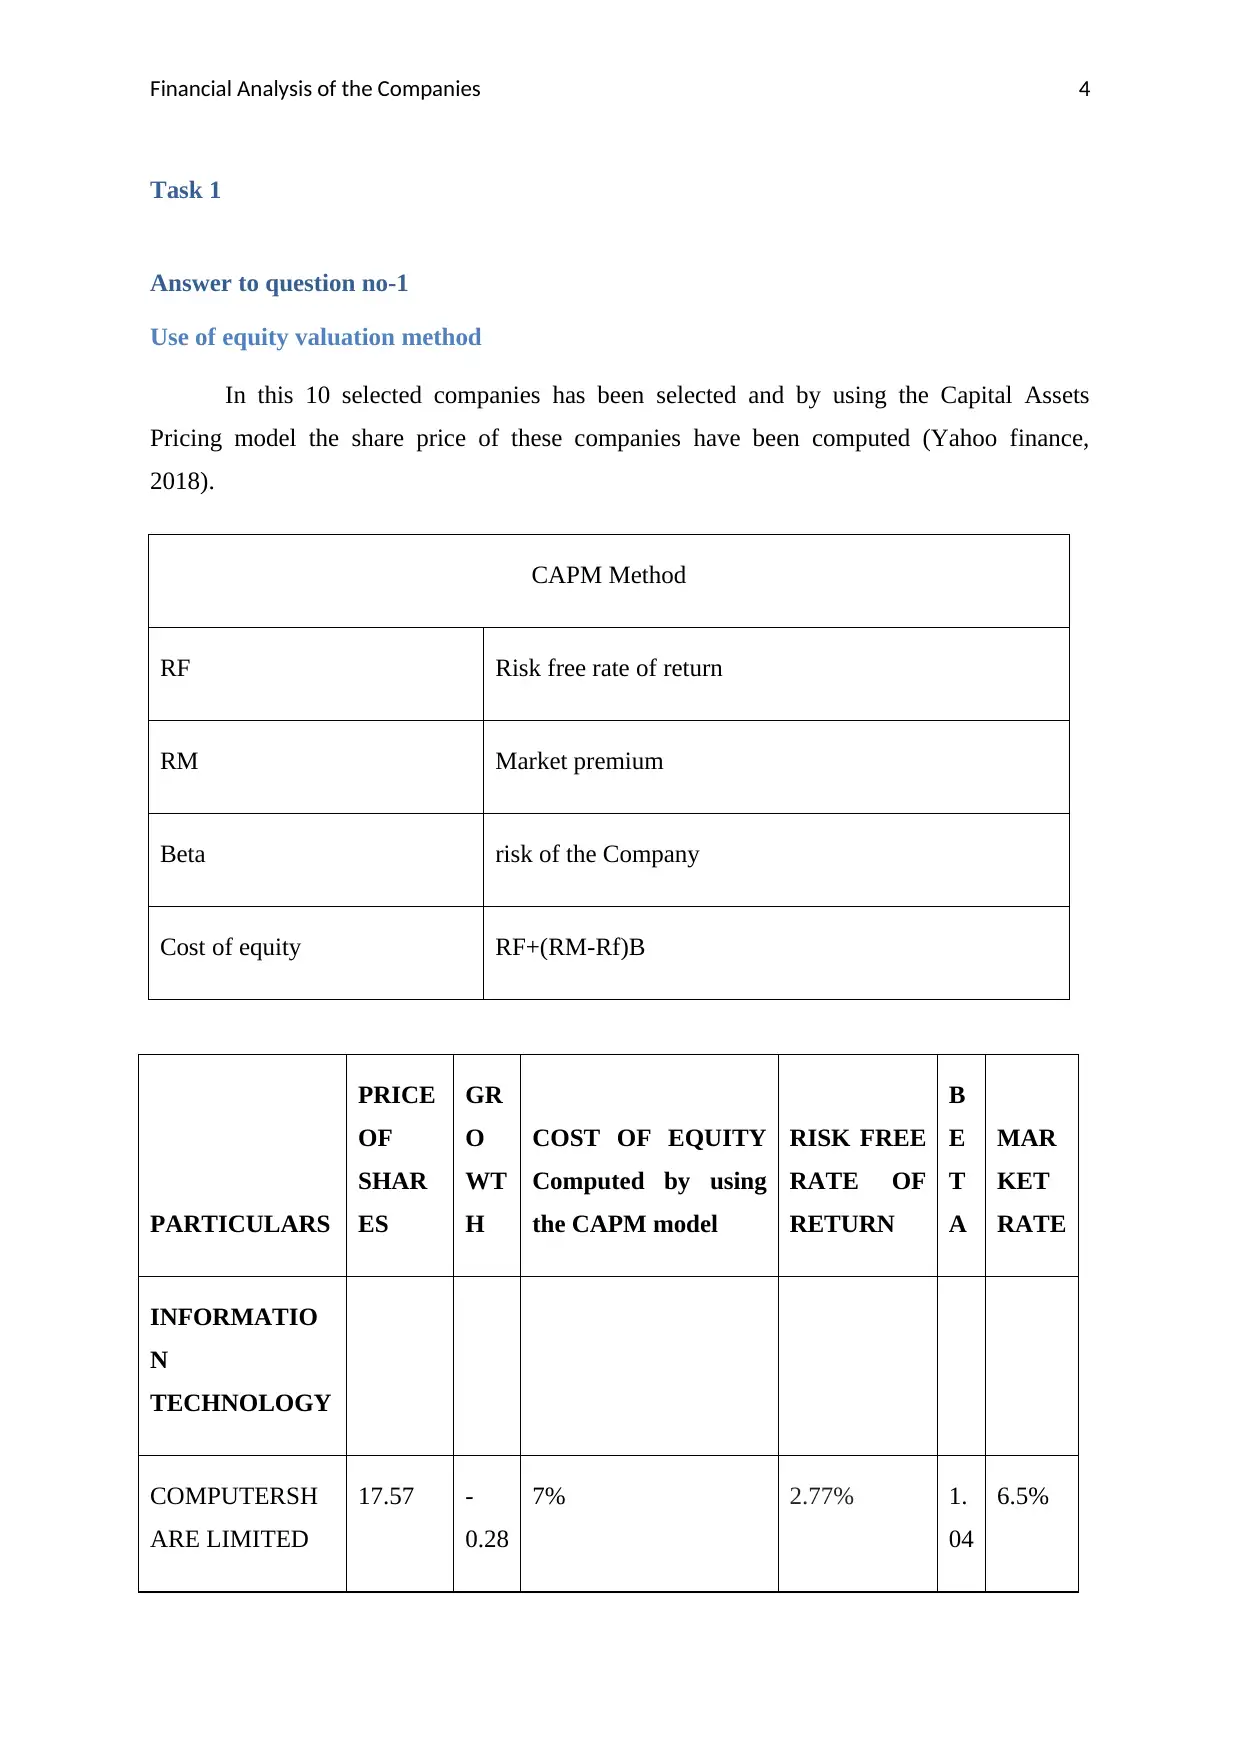
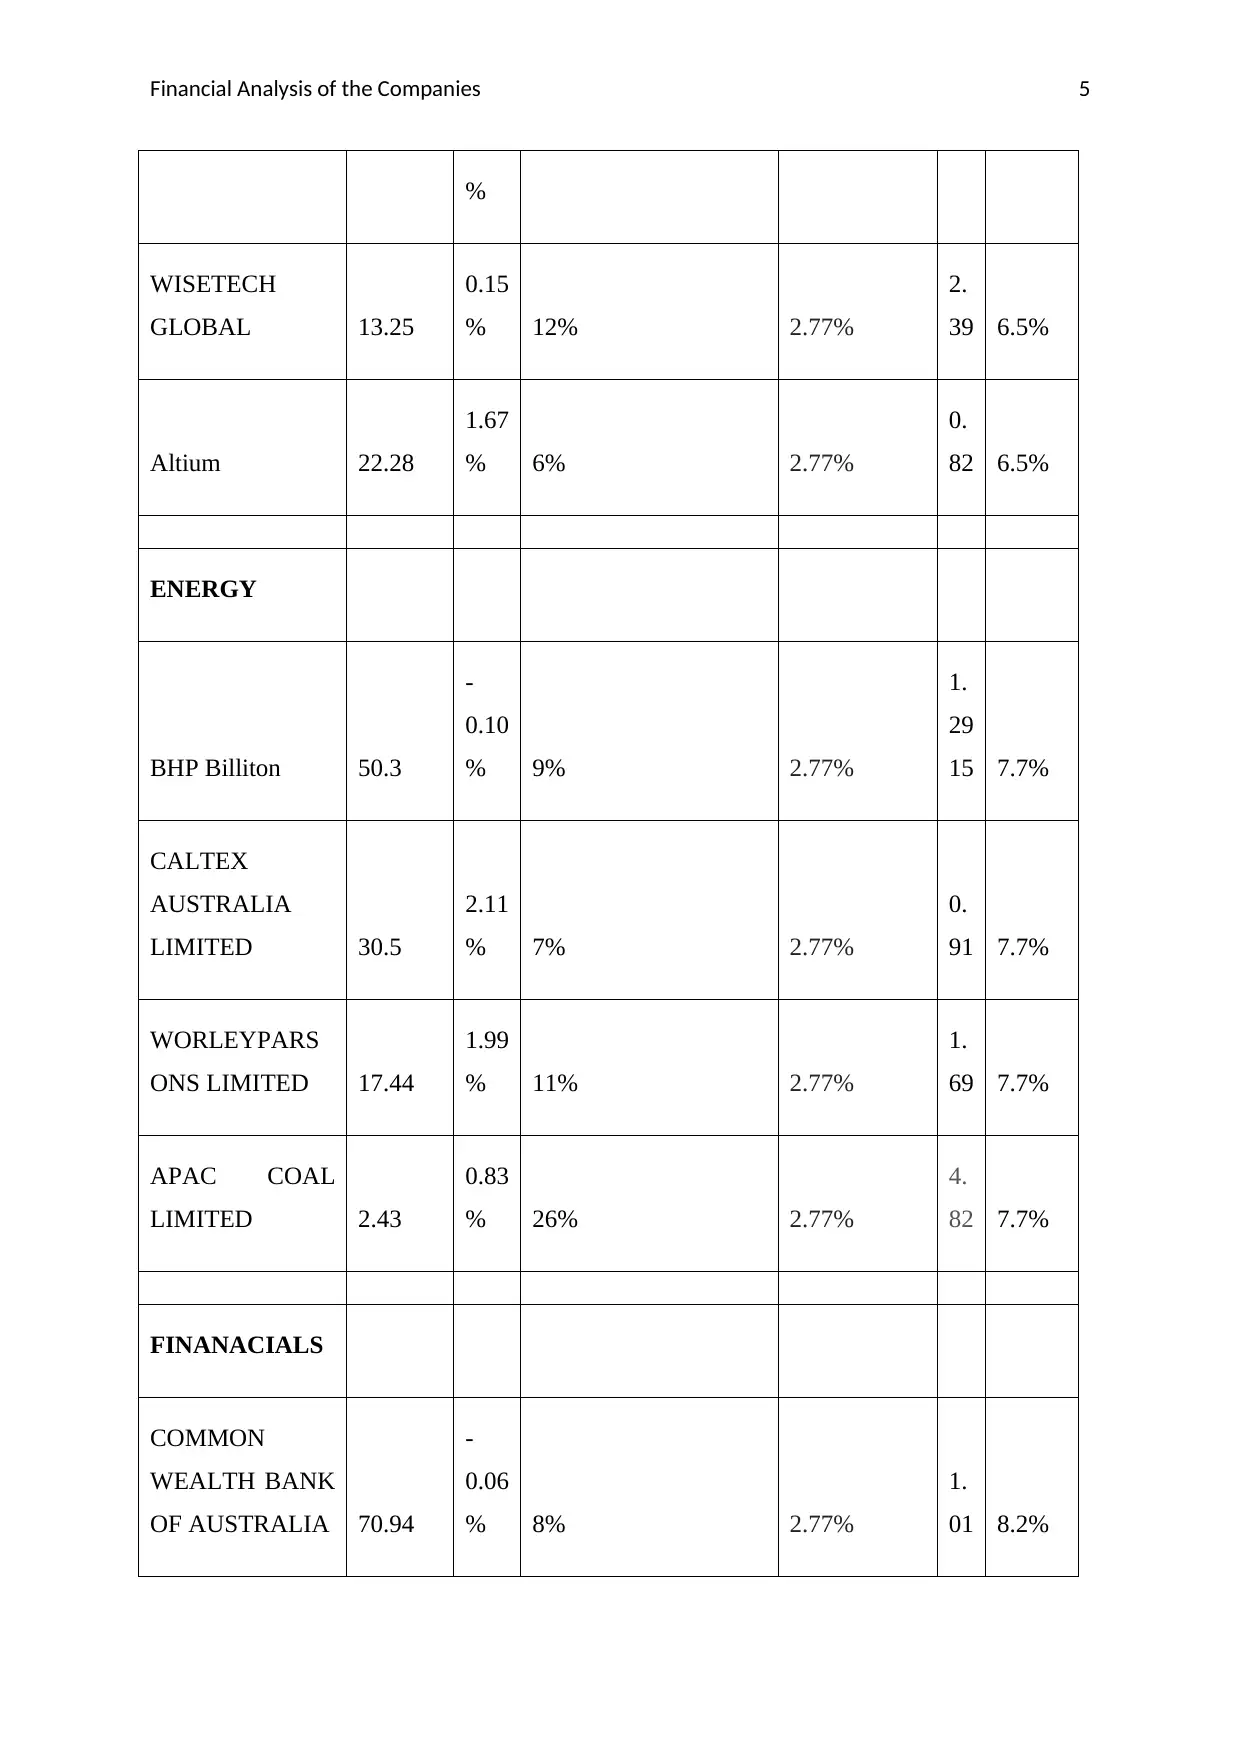
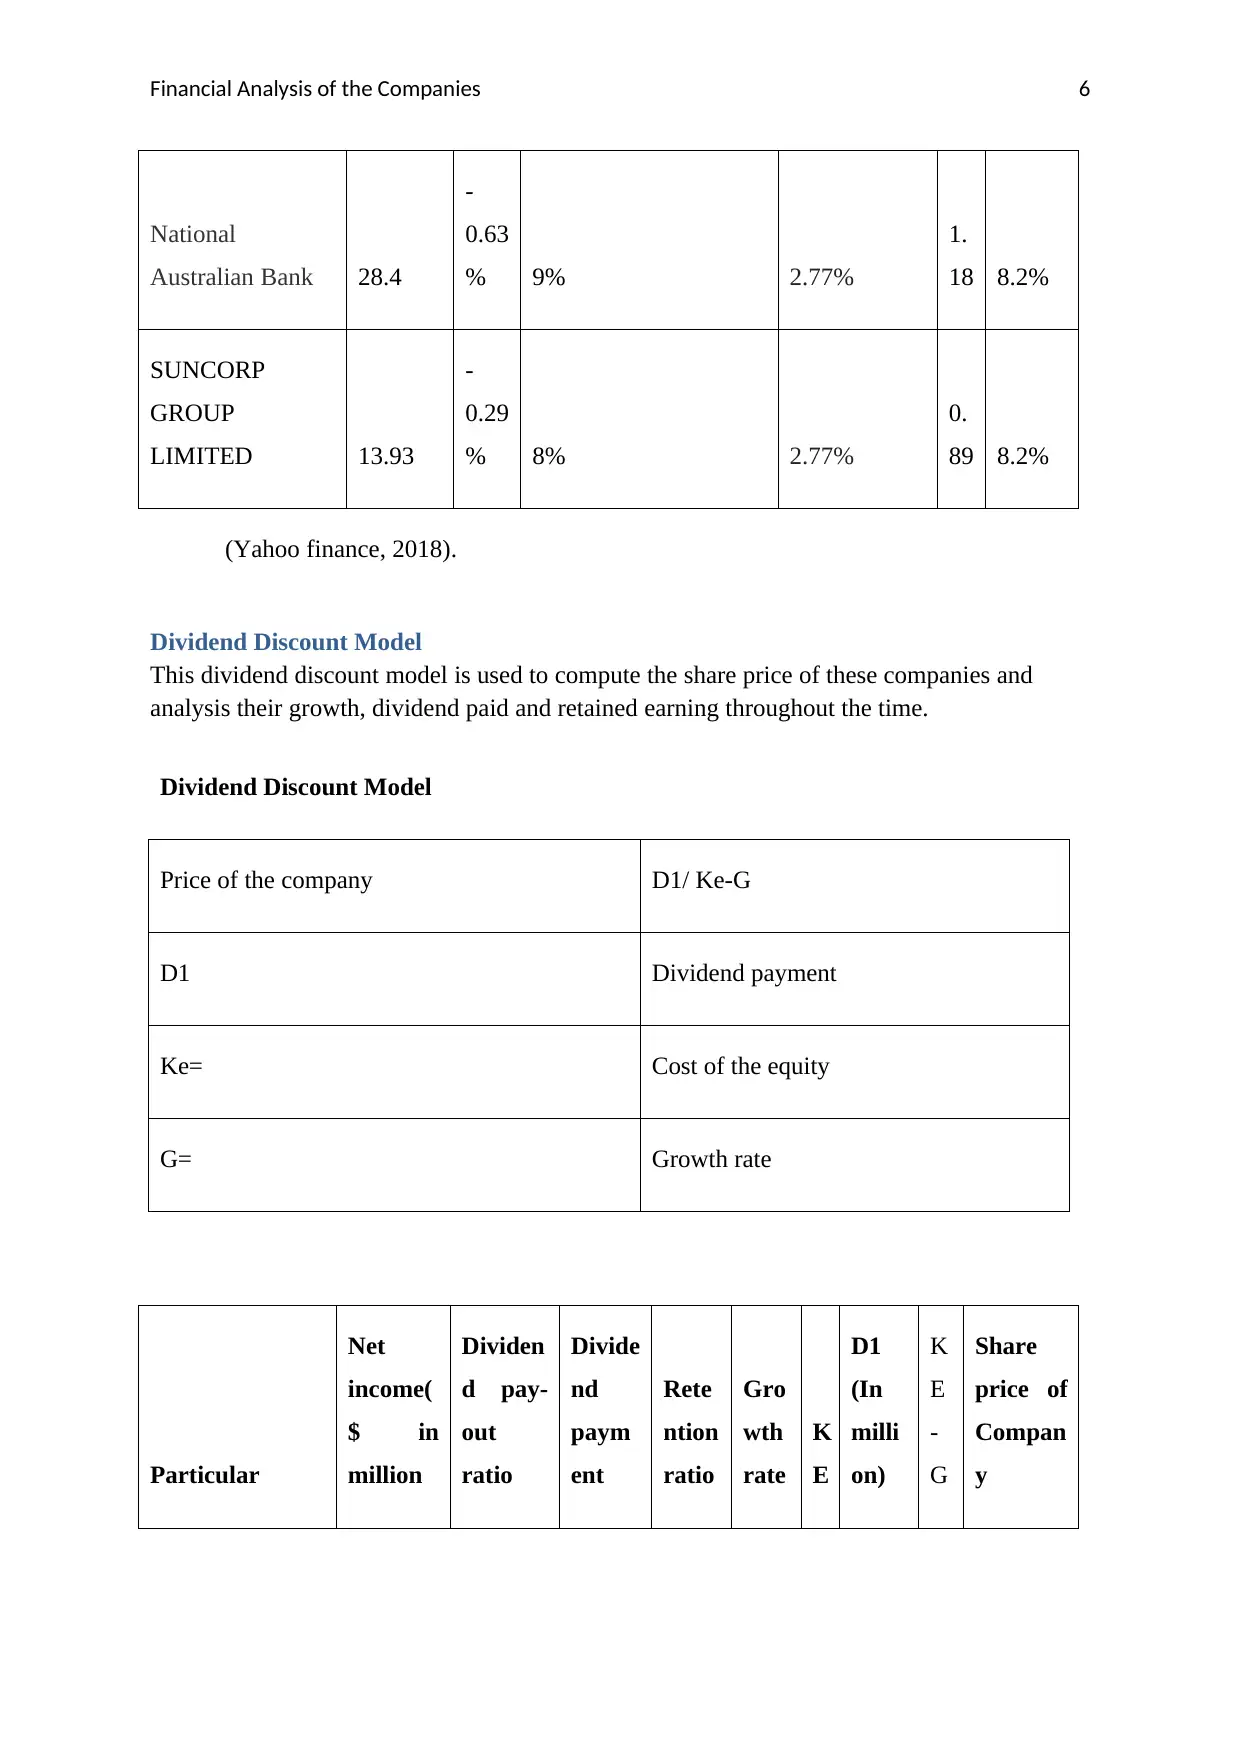
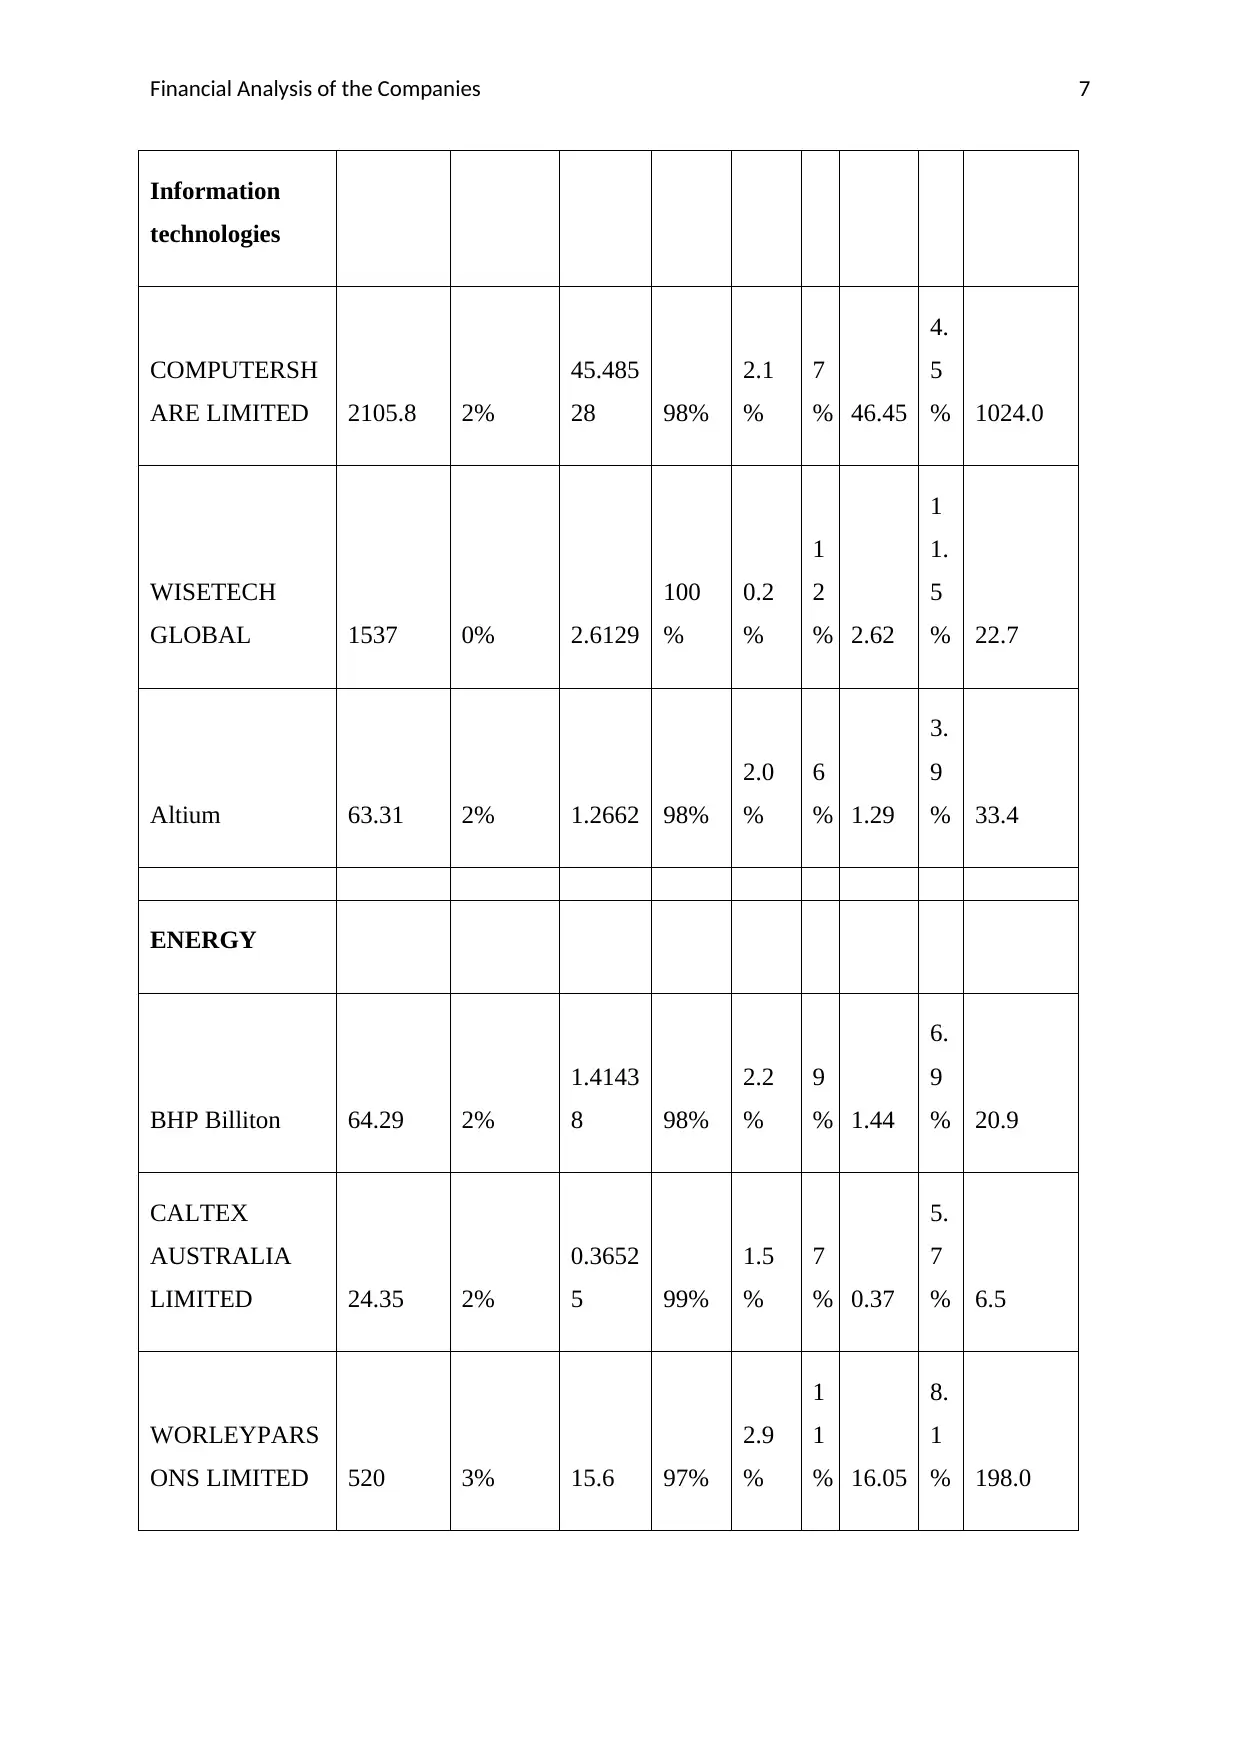
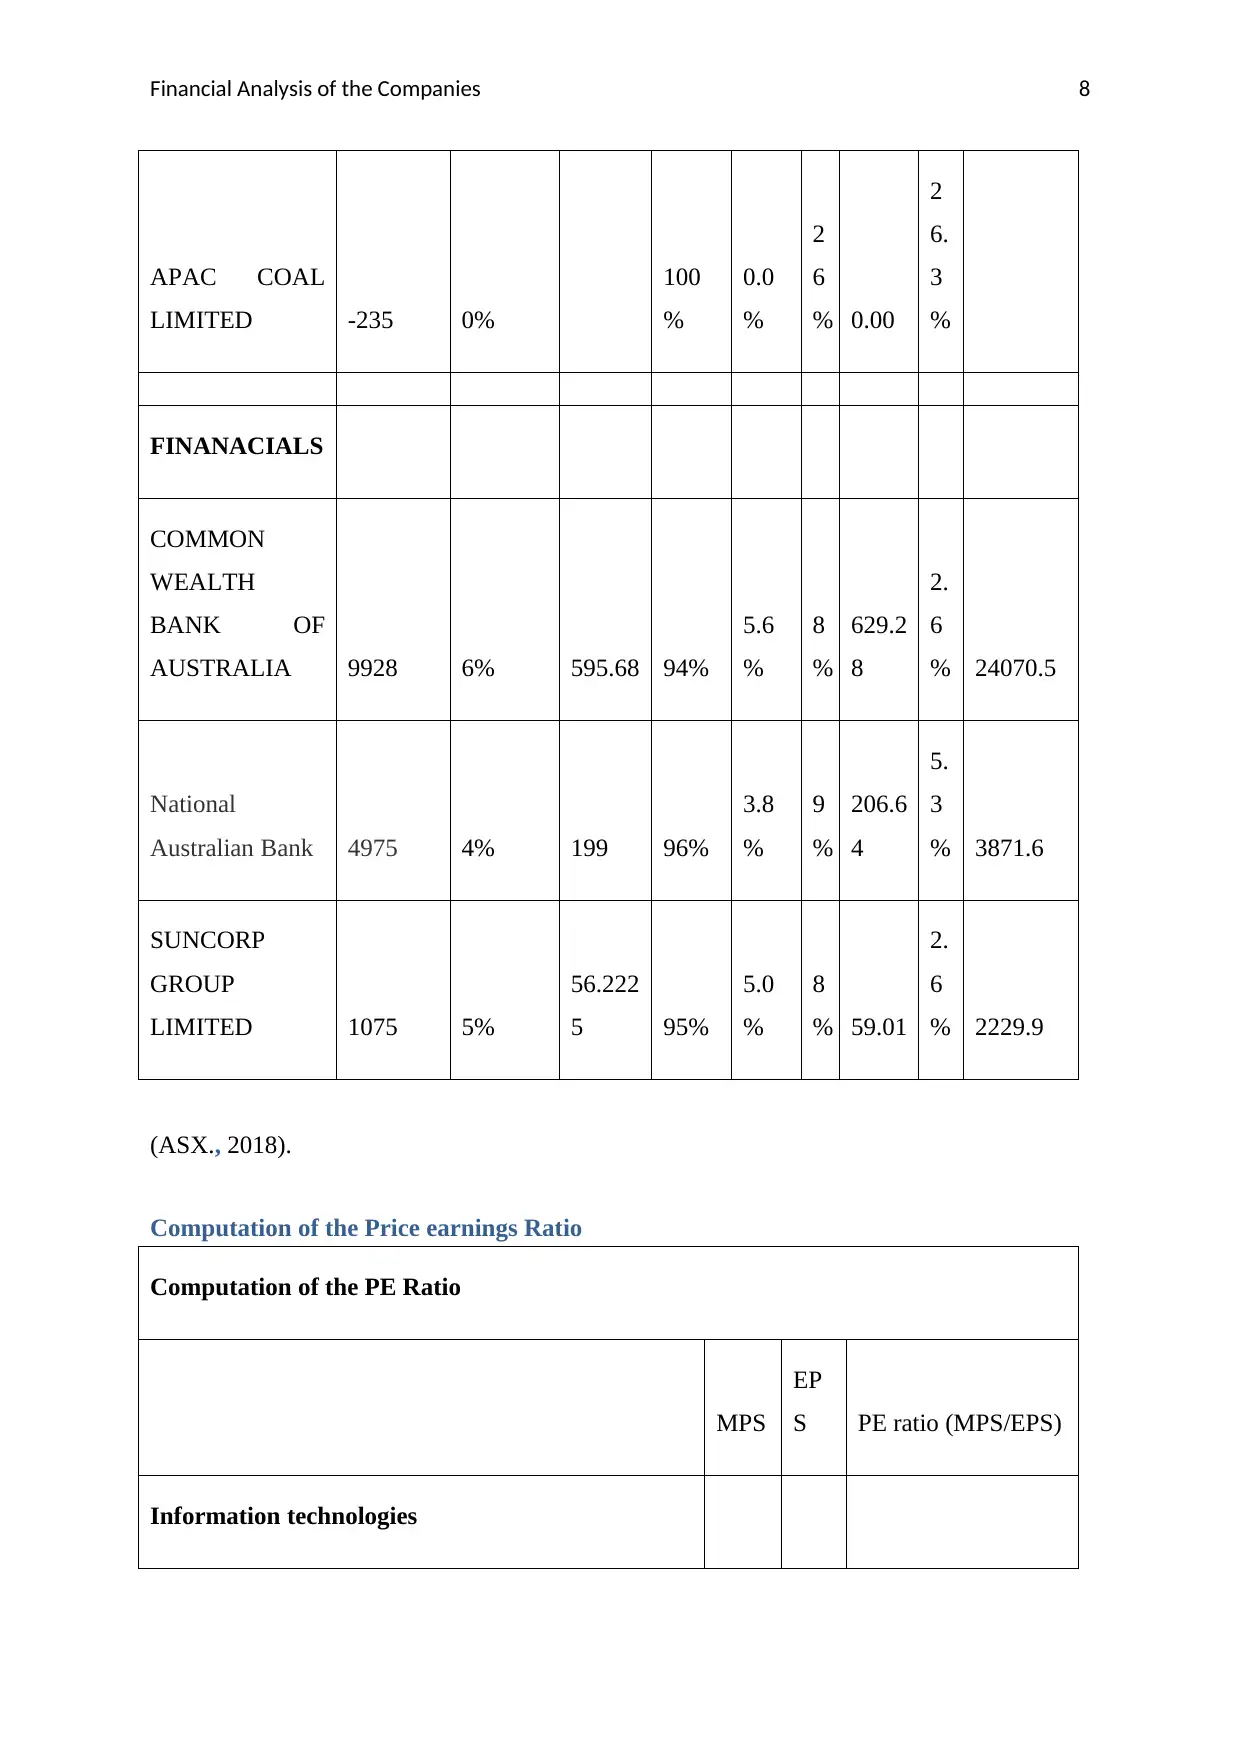
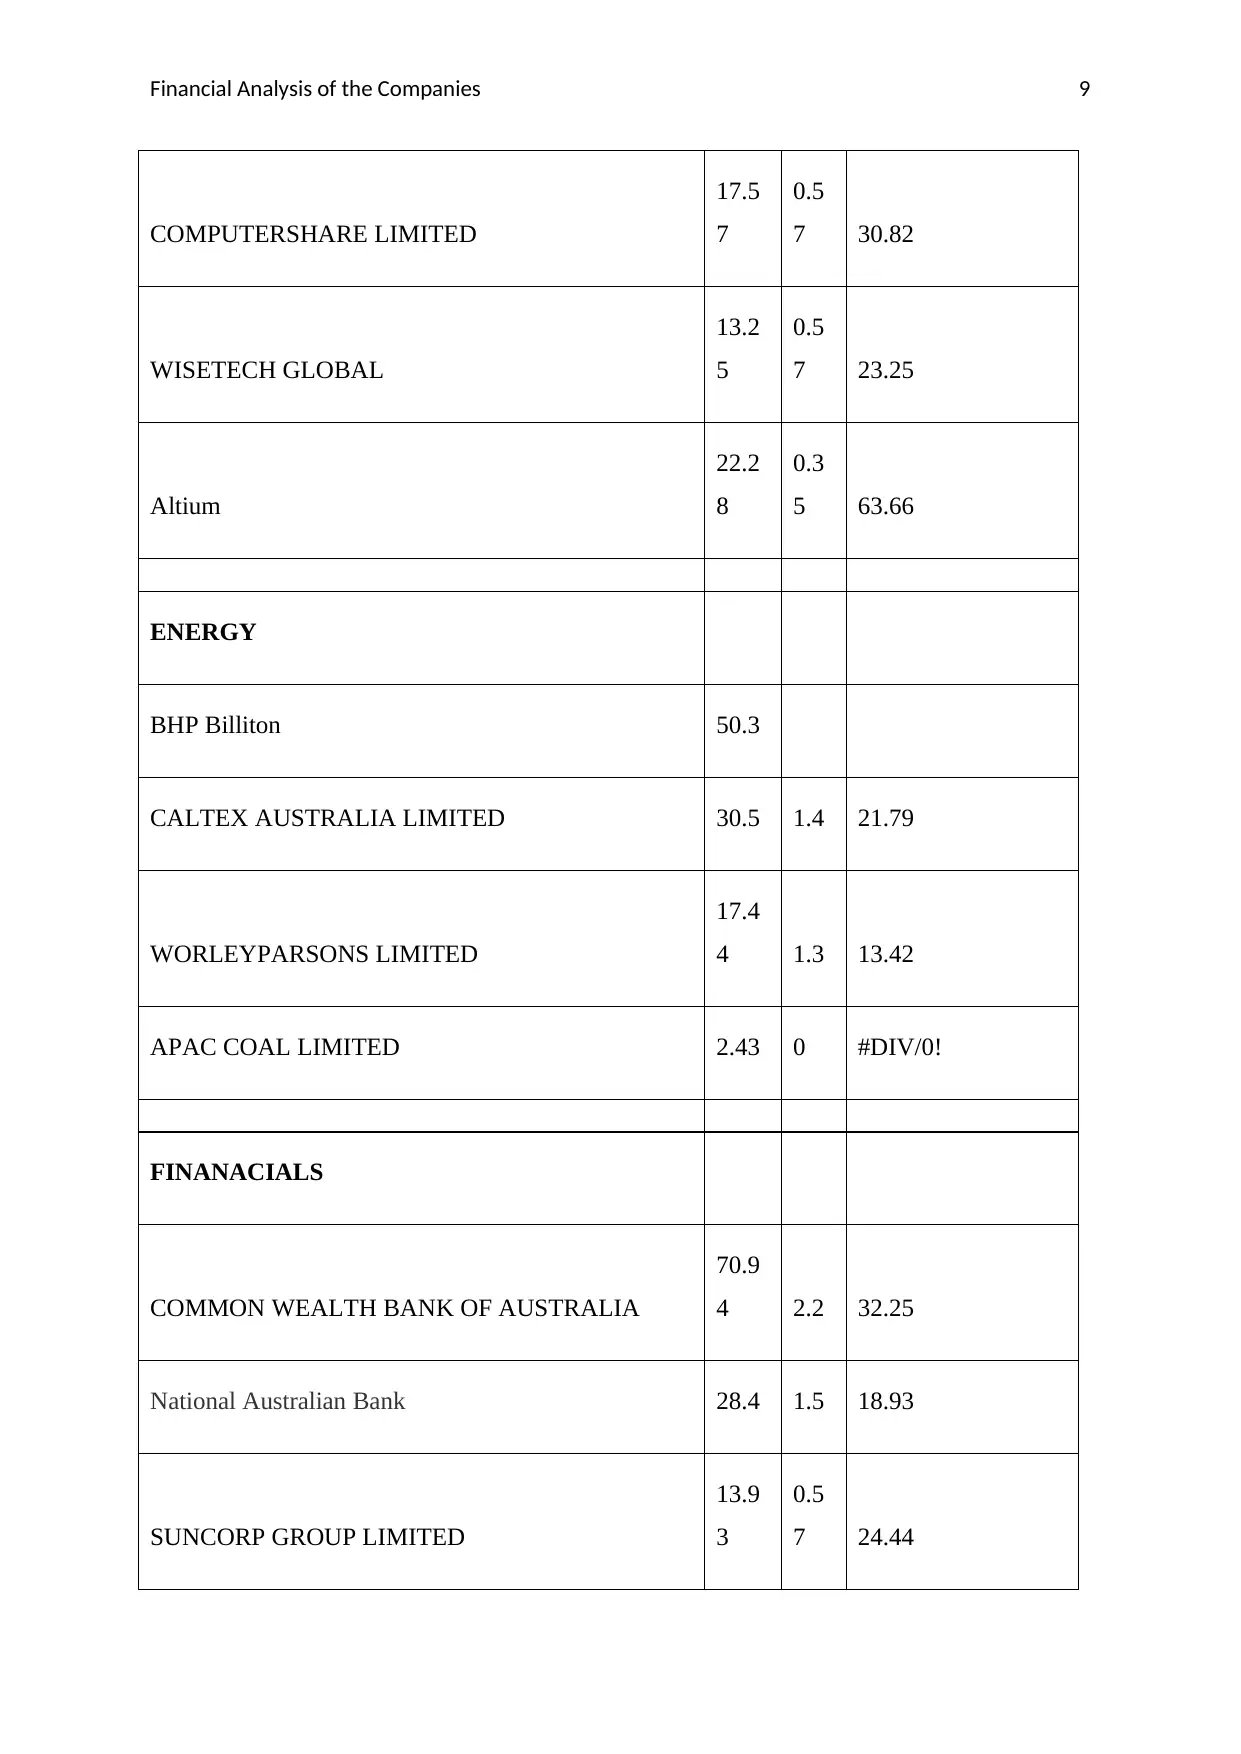
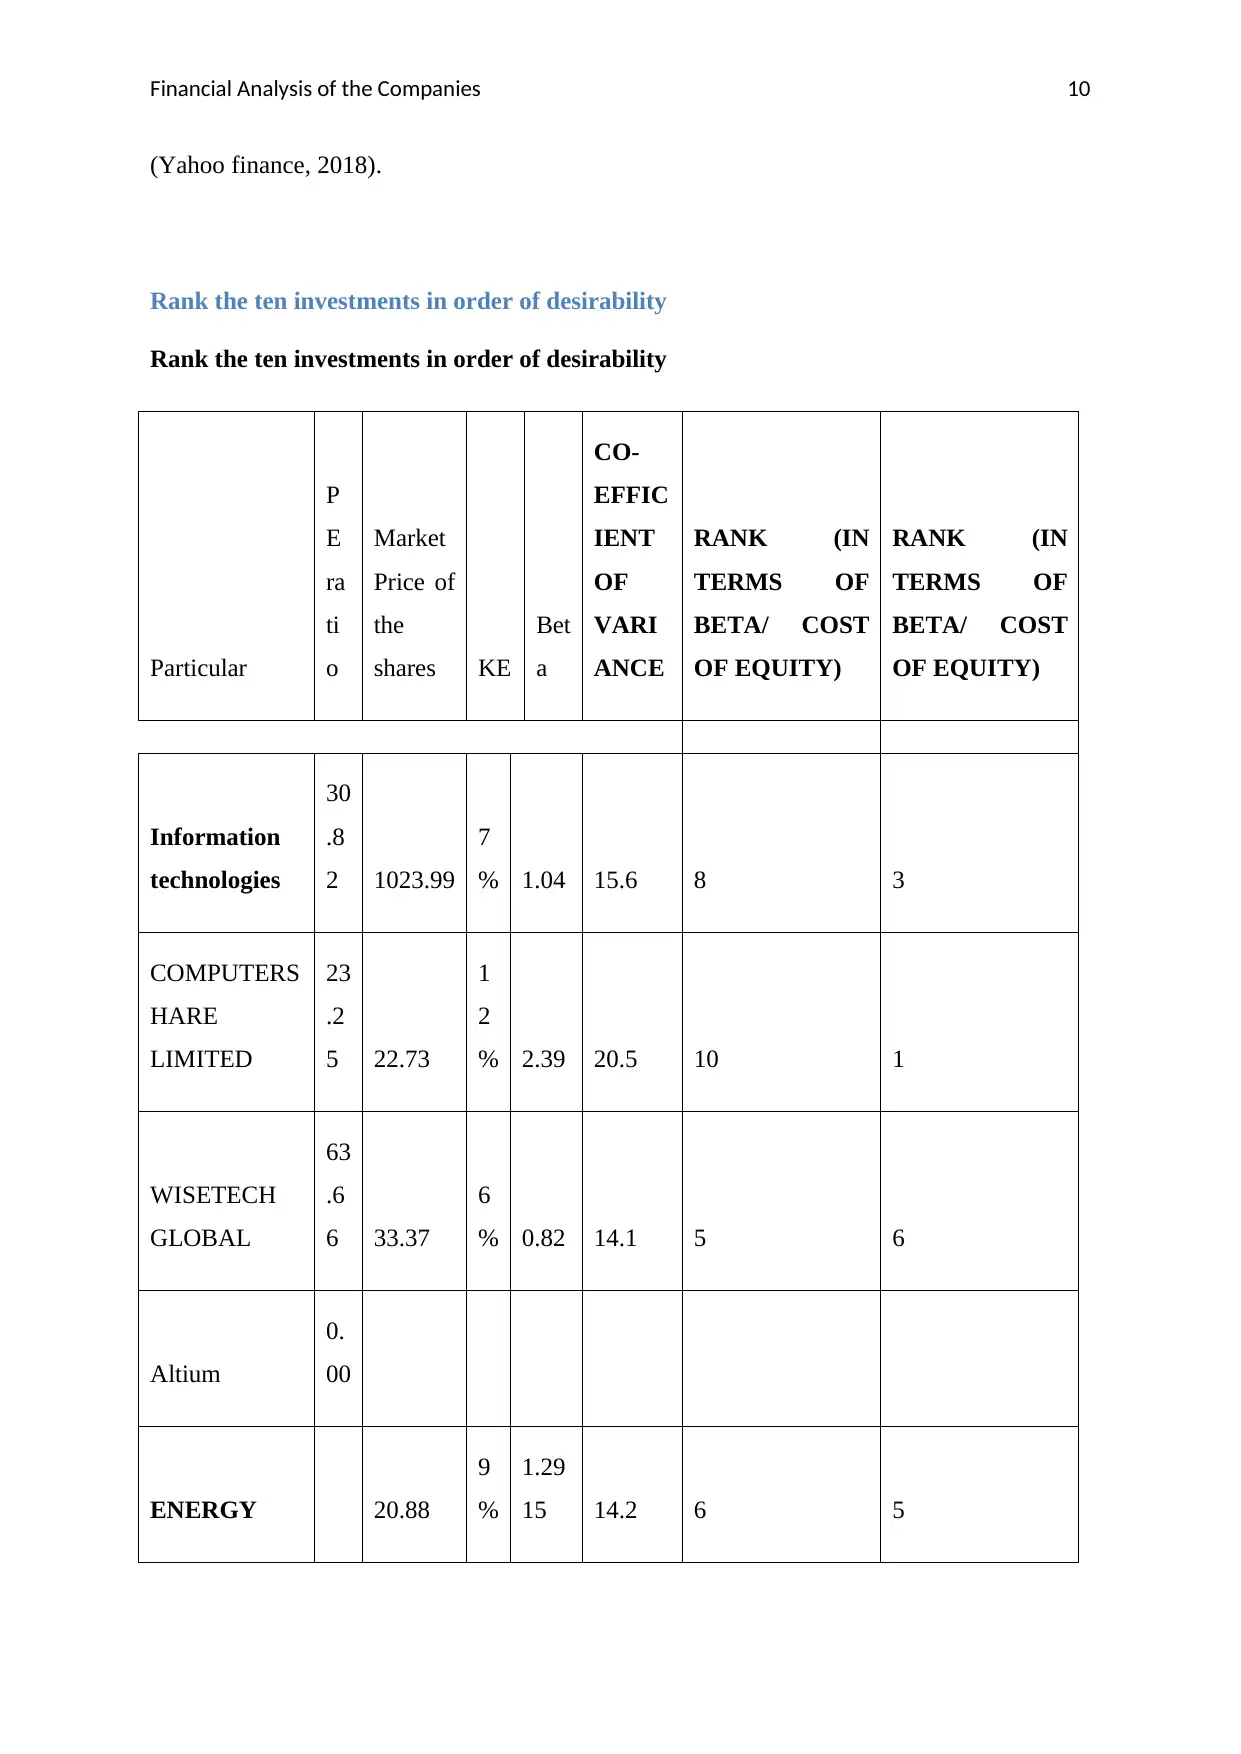
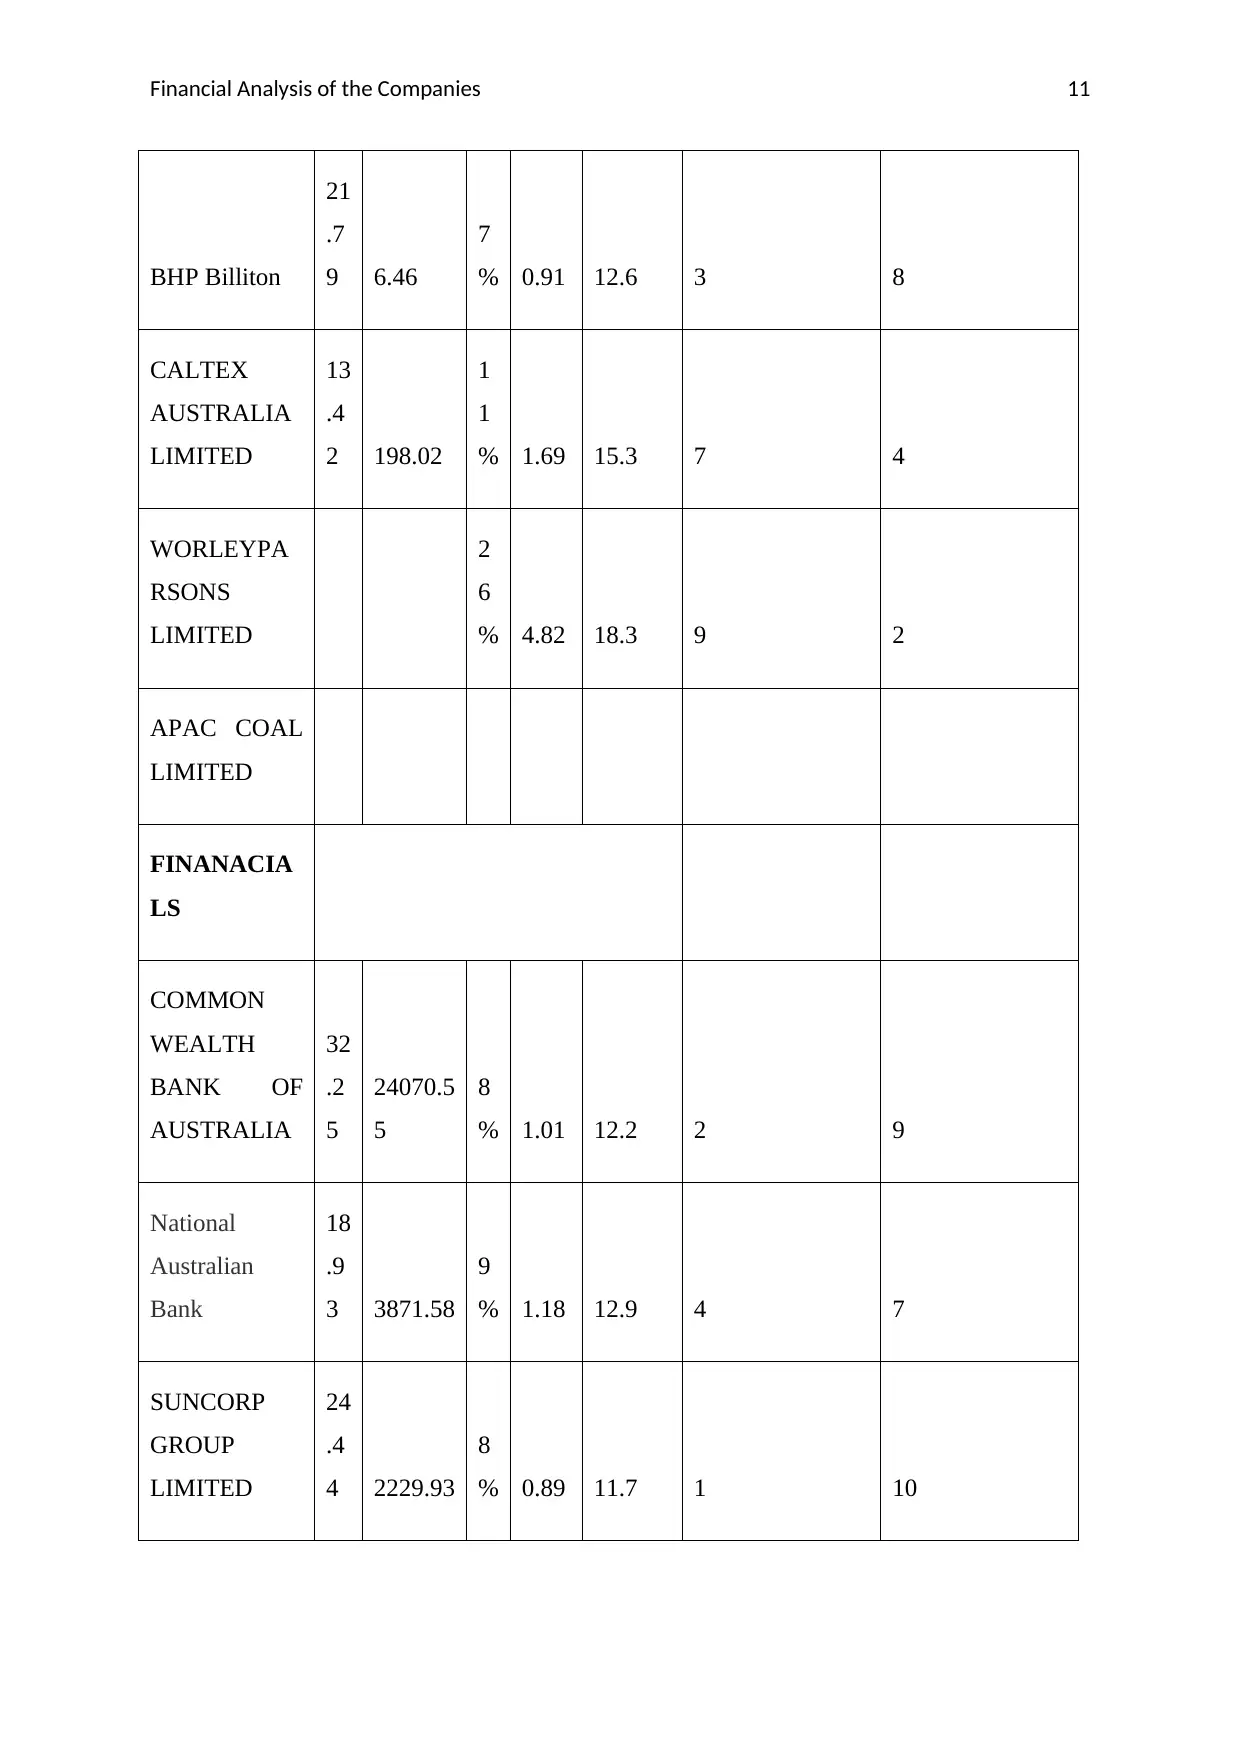
This report presents a comprehensive financial analysis of selected companies, primarily within the information technology, energy, and financial sectors. It employs various share valuation methods, including the Capital Asset Pricing Model (CAPM), Dividend Discount Model (DDM), and Price-Earnings (P/E) ratio, to assess the market value of each company's shares. The analysis involves calculating key financial metrics like cost of equity, growth rates, and beta coefficients to determine the desirability of investments. Furthermore, the report incorporates Warren Buffett's valuation theory, comparing it with the employed methodologies and summarizing interesting facts about his investment approach. The findings are then used to rank the investment options, culminating in a recommendation for the most suitable investment based on risk and return considerations. The report provides a detailed comparison of different valuation techniques, offering valuable insights into investment decision-making.

Running Head: Valuation of the shares of the Companies
0
Valuation of the shares of the Companies
0
Valuation of the shares of the Companies
Paraphrase This Document
Need a fresh take? Get an instant paraphrase of this document with our AI Paraphraser

Financial Analysis of the Companies 1
Executive Summary
In this report, share price valuation methods and technique have been used to evaluate
the market value of the companies. By using the different valuation methods, share price
calculated by one value method could be analyzed by using other valuation method. In this
report valuation theory of the Warren Buffet and other valuation methods have been taken
into consideration. Investors will be inclined to invest only in those companies in which they
will have higher return and less risk.

Financial Analysis of the Companies 2
Table of Contents
Executive Summary...............................................................................................................................1
Introduction...........................................................................................................................................3
Task 1....................................................................................................................................................4
Answer to question no-1........................................................................................................................4
Use of equity valuation method.........................................................................................................4
Dividend Discount Model.....................................................................................................................6
(ASX., 2018).........................................................................................................................................8
Computation of the Price earnings Ratio...............................................................................................8
Rank the ten investments in order of desirability.............................................................................10
Which investment of the ten would you select................................................................................13
Why the investment option selected................................................................................................13
Task-2..................................................................................................................................................13
Research and summarise some interesting facts about Warren Buffet.................................................13
Task 3..................................................................................................................................................16
Compare Warren Buffet’s approach to share valuation and the share valuation methodology............16
Share valuation Methodology..........................................................................................................17
Conclusion...........................................................................................................................................17
References...........................................................................................................................................18
Appendix.............................................................................................................................................20
⊘ This is a preview!⊘
Do you want full access?
Subscribe today to unlock all pages.

Trusted by 1+ million students worldwide

Financial Analysis of the Companies 3
Introduction
Investors are the persons who invest their capital in company with a view to create
value on their investment. The main factors which are considered by investors are the return
available on the invested capital and risk associated with the same. In this report, different
valuation methods have been used to evaluate the share price of different companies. All the
companies have been selected from the information technologies business sector, energy
sector and financial market sector. In the end, comparisons between the Warrant buffet
valuation theory and dividend discount model and PE ratio has been done.
Paraphrase This Document
Need a fresh take? Get an instant paraphrase of this document with our AI Paraphraser

Financial Analysis of the Companies 4
Task 1
Answer to question no-1
Use of equity valuation method
In this 10 selected companies has been selected and by using the Capital Assets
Pricing model the share price of these companies have been computed (Yahoo finance,
2018).
CAPM Method
RF Risk free rate of return
RM Market premium
Beta risk of the Company
Cost of equity RF+(RM-Rf)B
PARTICULARS
PRICE
OF
SHAR
ES
GR
O
WT
H
COST OF EQUITY
Computed by using
the CAPM model
RISK FREE
RATE OF
RETURN
B
E
T
A
MAR
KET
RATE
INFORMATIO
N
TECHNOLOGY
COMPUTERSH
ARE LIMITED
17.57 -
0.28
7% 2.77% 1.
04
6.5%

Financial Analysis of the Companies 5
%
WISETECH
GLOBAL 13.25
0.15
% 12% 2.77%
2.
39 6.5%
Altium 22.28
1.67
% 6% 2.77%
0.
82 6.5%
ENERGY
BHP Billiton 50.3
-
0.10
% 9% 2.77%
1.
29
15 7.7%
CALTEX
AUSTRALIA
LIMITED 30.5
2.11
% 7% 2.77%
0.
91 7.7%
WORLEYPARS
ONS LIMITED 17.44
1.99
% 11% 2.77%
1.
69 7.7%
APAC COAL
LIMITED 2.43
0.83
% 26% 2.77%
4.
82 7.7%
FINANACIALS
COMMON
WEALTH BANK
OF AUSTRALIA 70.94
-
0.06
% 8% 2.77%
1.
01 8.2%
⊘ This is a preview!⊘
Do you want full access?
Subscribe today to unlock all pages.

Trusted by 1+ million students worldwide

Financial Analysis of the Companies 6
National
Australian Bank 28.4
-
0.63
% 9% 2.77%
1.
18 8.2%
SUNCORP
GROUP
LIMITED 13.93
-
0.29
% 8% 2.77%
0.
89 8.2%
(Yahoo finance, 2018).
Dividend Discount Model
This dividend discount model is used to compute the share price of these companies and
analysis their growth, dividend paid and retained earning throughout the time.
Dividend Discount Model
Price of the company D1/ Ke-G
D1 Dividend payment
Ke= Cost of the equity
G= Growth rate
Particular
Net
income(
$ in
million
Dividen
d pay-
out
ratio
Divide
nd
paym
ent
Rete
ntion
ratio
Gro
wth
rate
K
E
D1
(In
milli
on)
K
E
-
G
Share
price of
Compan
y
Paraphrase This Document
Need a fresh take? Get an instant paraphrase of this document with our AI Paraphraser

Financial Analysis of the Companies 7
Information
technologies
COMPUTERSH
ARE LIMITED 2105.8 2%
45.485
28 98%
2.1
%
7
% 46.45
4.
5
% 1024.0
WISETECH
GLOBAL 1537 0% 2.6129
100
%
0.2
%
1
2
% 2.62
1
1.
5
% 22.7
Altium 63.31 2% 1.2662 98%
2.0
%
6
% 1.29
3.
9
% 33.4
ENERGY
BHP Billiton 64.29 2%
1.4143
8 98%
2.2
%
9
% 1.44
6.
9
% 20.9
CALTEX
AUSTRALIA
LIMITED 24.35 2%
0.3652
5 99%
1.5
%
7
% 0.37
5.
7
% 6.5
WORLEYPARS
ONS LIMITED 520 3% 15.6 97%
2.9
%
1
1
% 16.05
8.
1
% 198.0

Financial Analysis of the Companies 8
APAC COAL
LIMITED -235 0%
100
%
0.0
%
2
6
% 0.00
2
6.
3
%
FINANACIALS
COMMON
WEALTH
BANK OF
AUSTRALIA 9928 6% 595.68 94%
5.6
%
8
%
629.2
8
2.
6
% 24070.5
National
Australian Bank 4975 4% 199 96%
3.8
%
9
%
206.6
4
5.
3
% 3871.6
SUNCORP
GROUP
LIMITED 1075 5%
56.222
5 95%
5.0
%
8
% 59.01
2.
6
% 2229.9
(ASX., 2018).
Computation of the Price earnings Ratio
Computation of the PE Ratio
MPS
EP
S PE ratio (MPS/EPS)
Information technologies
⊘ This is a preview!⊘
Do you want full access?
Subscribe today to unlock all pages.

Trusted by 1+ million students worldwide

Financial Analysis of the Companies 9
COMPUTERSHARE LIMITED
17.5
7
0.5
7 30.82
WISETECH GLOBAL
13.2
5
0.5
7 23.25
Altium
22.2
8
0.3
5 63.66
ENERGY
BHP Billiton 50.3
CALTEX AUSTRALIA LIMITED 30.5 1.4 21.79
WORLEYPARSONS LIMITED
17.4
4 1.3 13.42
APAC COAL LIMITED 2.43 0 #DIV/0!
FINANACIALS
COMMON WEALTH BANK OF AUSTRALIA
70.9
4 2.2 32.25
National Australian Bank 28.4 1.5 18.93
SUNCORP GROUP LIMITED
13.9
3
0.5
7 24.44
Paraphrase This Document
Need a fresh take? Get an instant paraphrase of this document with our AI Paraphraser

Financial Analysis of the Companies 10
(Yahoo finance, 2018).
Rank the ten investments in order of desirability
Particular
P
E
ra
ti
o
Market
Price of
the
shares KE
Bet
a
CO-
EFFIC
IENT
OF
VARI
ANCE
RANK (IN
TERMS OF
BETA/ COST
OF EQUITY)
RANK (IN
TERMS OF
BETA/ COST
OF EQUITY)
Information
technologies
30
.8
2 1023.99
7
% 1.04 15.6 8 3
COMPUTERS
HARE
LIMITED
23
.2
5 22.73
1
2
% 2.39 20.5 10 1
WISETECH
GLOBAL
63
.6
6 33.37
6
% 0.82 14.1 5 6
Altium
0.
00
ENERGY 20.88
9
%
1.29
15 14.2 6 5

Financial Analysis of the Companies 11
BHP Billiton
21
.7
9 6.46
7
% 0.91 12.6 3 8
CALTEX
AUSTRALIA
LIMITED
13
.4
2 198.02
1
1
% 1.69 15.3 7 4
WORLEYPA
RSONS
LIMITED
2
6
% 4.82 18.3 9 2
APAC COAL
LIMITED
FINANACIA
LS
COMMON
WEALTH
BANK OF
AUSTRALIA
32
.2
5
24070.5
5
8
% 1.01 12.2 2 9
National
Australian
Bank
18
.9
3 3871.58
9
% 1.18 12.9 4 7
SUNCORP
GROUP
LIMITED
24
.4
4 2229.93
8
% 0.89 11.7 1 10
⊘ This is a preview!⊘
Do you want full access?
Subscribe today to unlock all pages.

Trusted by 1+ million students worldwide
1 out of 21
Related Documents

Your All-in-One AI-Powered Toolkit for Academic Success.
 +13062052269
info@desklib.com
Available 24*7 on WhatsApp / Email
Unlock your academic potential
Copyright © 2020–2025 A2Z Services. All Rights Reserved. Developed and managed by ZUCOL.