Report on Ratio Analysis: Serco PLC, Capita PLC, and Carillion PLC
VerifiedAdded on 2023/01/16
|25
|5820
|33
Report
AI Summary
This report undertakes a comprehensive financial analysis of Serco PLC, Capita PLC, and Carillion PLC, focusing on ratio analysis to assess their financial stability and performance. The analysis includes a detailed examination of liquidity, profitability, and debt management ratios for each company, with a particular focus on Capita PLC and Serco PLC in the context of securing a contract from the NHS. The report also addresses the financial collapse of Carillion PLC, exploring the factors that led to its insolvency and the implications for stakeholders, including the role of financial risk and ethical considerations. The study emphasizes the importance of evidence-based decision-making in procurement and the appreciation of counterparty risk, providing a valuable perspective on financial management within the public sector and the significance of robust financial assessments in awarding contracts.
Running head: Report on the Ratio Analysis of Serco PLC, Capita PLC and Carillion PLC
Report on the Ratio Analysis of Serco PLC, Capita PLC and Carillion PLC
Name of the Student:
Name of the University:
Author’s Note:
Course ID:
Report on the Ratio Analysis of Serco PLC, Capita PLC and Carillion PLC
Name of the Student:
Name of the University:
Author’s Note:
Course ID:
Paraphrase This Document
Need a fresh take? Get an instant paraphrase of this document with our AI Paraphraser
1
Report on the Ratio Analysis of Serco PLC, Capita PLC and Carillion PLC
Executive Summary:
This project is done to understand the concerns related to financial stability of all the 3
companies like Serco PLC, Capita PLC and Carillion PLC these are one of the biggest
company and the accountability of these companies impact the process in UK. The effect of
the insolvency filing of the Carillion PLC was a major disaster for the 40000 employees and
suppliers. They were affected by the liquidation. It is considered as the biggest financial
disaster in the history of UK. The amount of loss that this company impacted on all the
stakeholders was around 2 billion dollar. Thus an analysis of the debt and equity that the
company was having in the course of the action is analysis through this project.
The other two company is Serco Plc and Capita Plc that are used to analysis the financial
soundness for the a contract form NHS. The financial soundness shall be calculated by the
ratio analysis. The ratio analysis looks into factors that may make the decision making
process for the company easy.
2
Report on the Ratio Analysis of Serco PLC, Capita PLC and Carillion PLC
Table of Contents
Introduction................................................................................................................................3
Discussion..................................................................................................................................4
Section A....................................................................................................................................4
Evidence based decision to ensure value for money:.............................................................4
Appreciation of counterparty risk in the procurement function:............................................5
Ratio analysis of Capita Plc:..................................................................................................6
Ratio analysis of Serco Plc...................................................................................................10
Decision to award the Contract............................................................................................13
Section B..................................................................................................................................13
About Carillion PLC:...........................................................................................................13
Funding Sources for the Carillion:.......................................................................................14
Financial Risk:.....................................................................................................................14
Ratio analysis of Carillion....................................................................................................16
Conclusion:..............................................................................................................................20
Referencing:.............................................................................................................................22
⊘ This is a preview!⊘
Do you want full access?
Subscribe today to unlock all pages.
Trusted by 1+ million students worldwide
3
Report on the Ratio Analysis of Serco PLC, Capita PLC and Carillion PLC
Introduction
The report is about the analysis of the ratios to understand the financial stability of the
company. The contract of NHS is to be awarded to the company with the best ratio
performance. There are two company betting for the contract Serco Plc and Capita Plc. The
contract will be given to the company that can manage the contract with least disturbance of
the finance.
The report also consists of the analysis of a giant company whose loss created a huge
impact on the whole country and specially the stakeholder. Carillion has recently filled for
liquidation (Altman 2000). The company is a construction and service based organization that
is specialized into field of Health, Transport, Justice, Immigration, Defense, and Citizens
Services. The company was not able to manage the cash inflow and outflow which led to
state of liquidation. The debt was almost around 2 billion which was the highest amount of
debt any company must have had in the history of UK. The report focuses on how the
situation led to liquefy the company and filled for insolvency (Ahmed Et al. 2016)
The report has been prepared to understand the lacks in the financial assessment and
the loss that the management done to the company due mis-management. The two company
capita and Serco is trying to get a contract that of NHS. So here the financial stability will be
analyzed.
Paraphrase This Document
Need a fresh take? Get an instant paraphrase of this document with our AI Paraphraser
4
Report on the Ratio Analysis of Serco PLC, Capita PLC and Carillion PLC
Discussion
Section A
Evidence based decision to ensure value for money:
Value for money is a term that describes how nicely the return in investment is done.
The goods bought are for some value and the return that they might get will be equal or less
or more. Same goes for any governmental projects. The contract is an opportunity for private
and public companies to bid for this may give them a chance to expand and earn profit. It
involves major decision making for the public procurement of the contract. The research is all
about the formulation of the questions based on the project decision making. The forecasted
cost, return over the period of year and the duration to complete the project is also an
important factor for the estimation of the task.
The evidence based decision makings nothing but the procedure of back checking the
performance and credibility of the company. The ratio analysis is a method where the
companies ratios value over a period of years are compared and check. The comparison can
be done across the peer companies also. The ratio analysis is one method to do the evidence
based decision making. The other methodology that is by checking the past contract
completion reports and remarks. The evaluation of the contractor, supplier’s performance and
also the relationship between contractor and the supplier are evaluated (Jewell 2005).
NHS is a medical service system that has a procedure to mitigate the risk in the
contractual system. It is England based service provider that is affiliated to HSC that was
established in 1948. Each UK service system is operated independently and is politically
accountable to the relevant government. Thus it becomes the responsibility of the
government to check the contracts given to the companies. The contracts may be for
5
Report on the Ratio Analysis of Serco PLC, Capita PLC and Carillion PLC
different purpose and it is of huge amount. Thus, the evidence based decision making is very
important.
Appreciation of counterparty risk in the procurement function:
Procurement risk is potential where the failure of a task process which is designed to
purchase services, product or resources may not be completed properly in the time frame
mentioned. The risk is of the loss of the confidence of the giver. Common types of risk are
fraud, cost, quality compromised, and time frame or delivery risk. So some times the risk of
procurement is considered as the compliance risk. The contract has a process of procurement
and thus the contracts are prone to risk. There is a risk of counter party appreciation are the
possibility of clients and sub-contractor not fulfilling their commitments. The subsidiaries
have the assess to the credit standing of the clients by accessing the financial position, past
experience and other factors that are relevant. The accountability of their advance payment,
credit letter and third party guarantees are a kind to mitigate the credit risk. The maximum
credit risk that can be allowed depends on the value of the trade and other receivables
(Edmister 2002).
To mitigate the risk of the supply chain management there is a best way:
Diversify the suppliers
Switching the suppliers
Pile up
Pre-payment.
All the method is used to cover the risk and mitigate the chances of faulty performance. This
is methodology to ensure a robust supply chain resilience for an accurate business process.
Sometimes the counterparty risk may arise from the financial transactions that takes place
⊘ This is a preview!⊘
Do you want full access?
Subscribe today to unlock all pages.
Trusted by 1+ million students worldwide
6
Report on the Ratio Analysis of Serco PLC, Capita PLC and Carillion PLC
from the bank and other financial institution. The risk is managed carefully by selecting the
right institution for the financial support (Otani 1990).
Ratio analysis of Capita Plc:
Capita Plc is a business process that works on outsourcing. It deals in governmental
and private contract procurement. The head quarter is in London. It is considered as the
biggest outsourcing process company. The company earns revenue from the business process
of governmental and private sector. It was established in 1987 and today the company has
overcame all hurdles and became so successful with 70000 employees. Here the company is
trying to take a contract from NHS and there shall be ratio analysis to understand the stability
and capacity of Capita Plc (Capita PLC 2019).
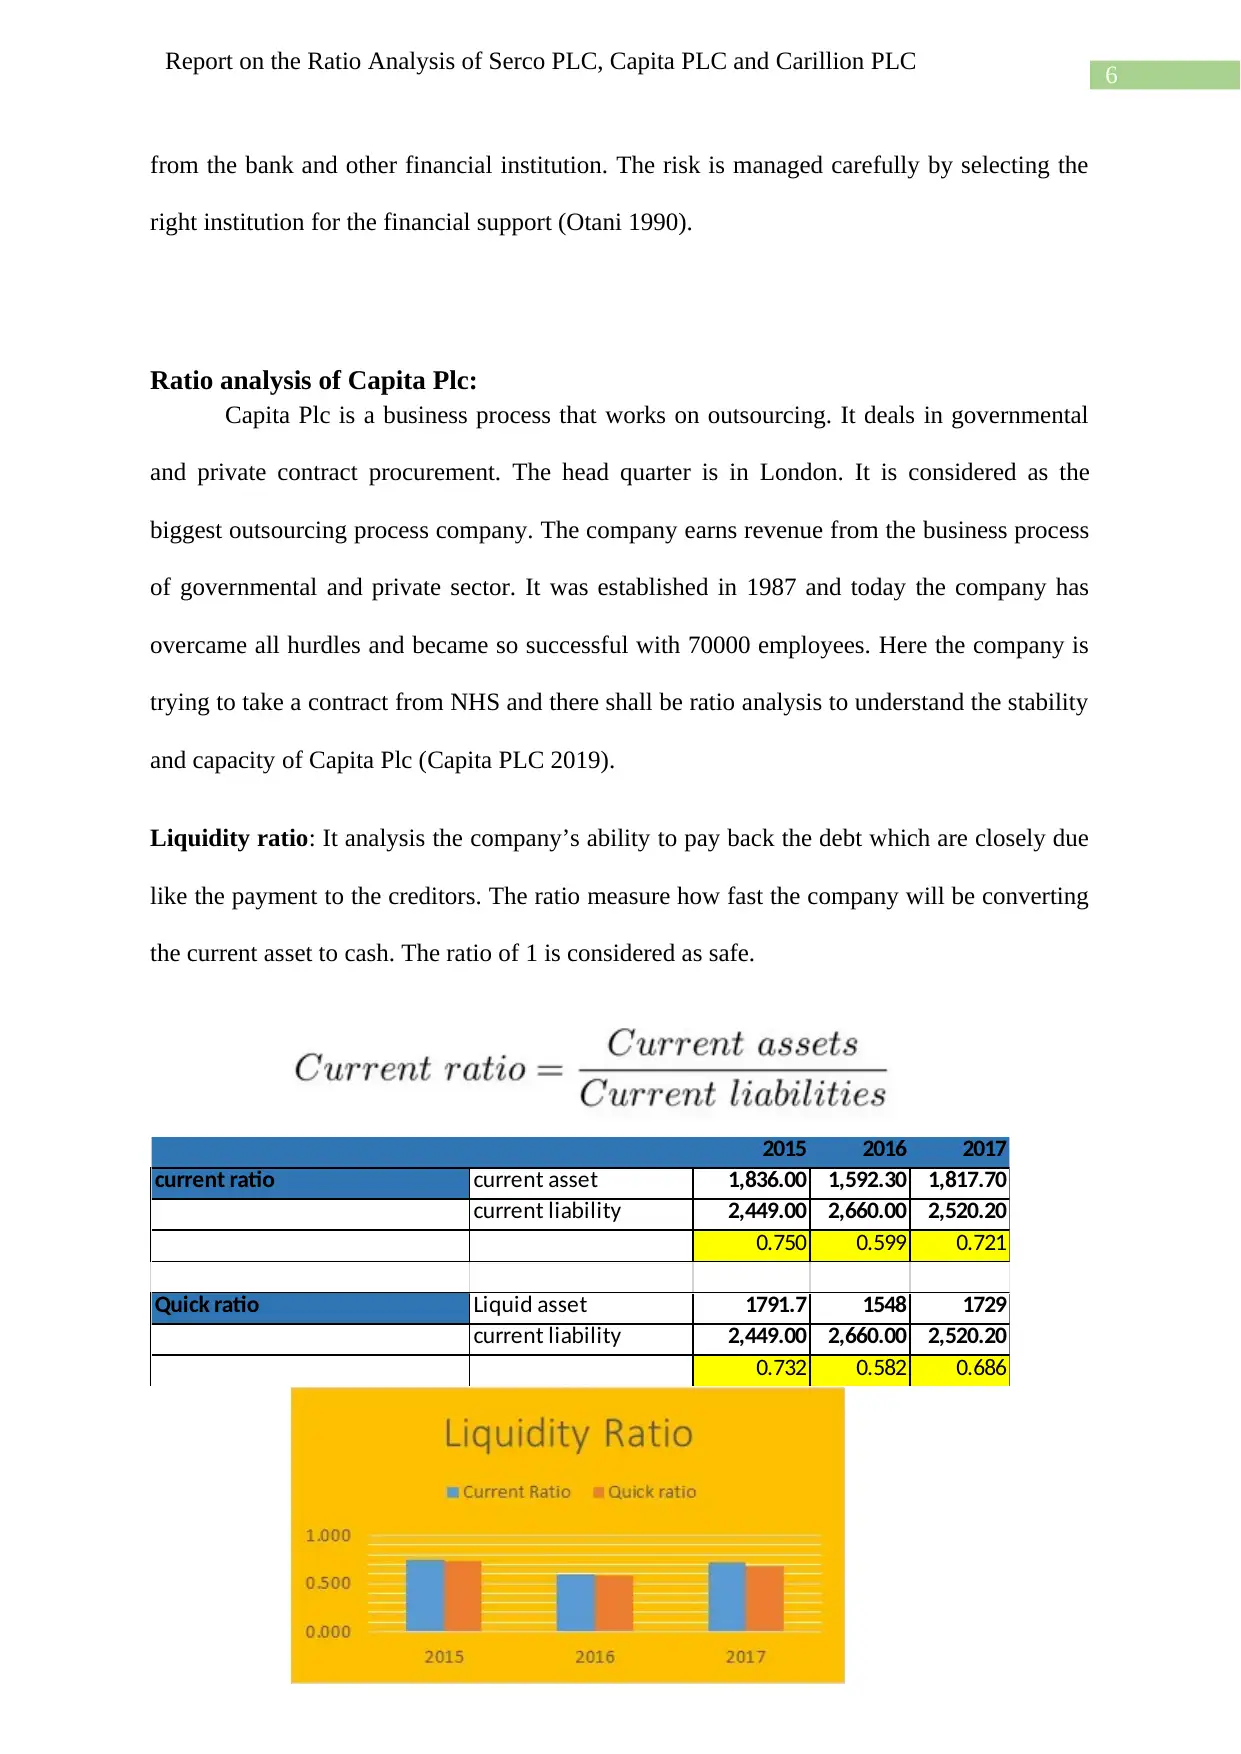
Liquidity ratio: It analysis the company’s ability to pay back the debt which are closely due
like the payment to the creditors. The ratio measure how fast the company will be converting
the current asset to cash. The ratio of 1 is considered as safe.
2015 2016 2017
current ratio current asset 1,836.00 1,592.30 1,817.70
current liability 2,449.00 2,660.00 2,520.20
0.750 0.599 0.721
Quick ratio Liquid asset 1791.7 1548 1729
current liability 2,449.00 2,660.00 2,520.20
0.732 0.582 0.686
Report on the Ratio Analysis of Serco PLC, Capita PLC and Carillion PLC
from the bank and other financial institution. The risk is managed carefully by selecting the
right institution for the financial support (Otani 1990).
Ratio analysis of Capita Plc:
Capita Plc is a business process that works on outsourcing. It deals in governmental
and private contract procurement. The head quarter is in London. It is considered as the
biggest outsourcing process company. The company earns revenue from the business process
of governmental and private sector. It was established in 1987 and today the company has
overcame all hurdles and became so successful with 70000 employees. Here the company is
trying to take a contract from NHS and there shall be ratio analysis to understand the stability
and capacity of Capita Plc (Capita PLC 2019).
Liquidity ratio: It analysis the company’s ability to pay back the debt which are closely due
like the payment to the creditors. The ratio measure how fast the company will be converting
the current asset to cash. The ratio of 1 is considered as safe.
2015 2016 2017
current ratio current asset 1,836.00 1,592.30 1,817.70
current liability 2,449.00 2,660.00 2,520.20
0.750 0.599 0.721
Quick ratio Liquid asset 1791.7 1548 1729
current liability 2,449.00 2,660.00 2,520.20
0.732 0.582 0.686
Paraphrase This Document
Need a fresh take? Get an instant paraphrase of this document with our AI Paraphraser
7
Report on the Ratio Analysis of Serco PLC, Capita PLC and Carillion PLC
The graph is about the current ratio and quick ratio for company Capita PLC. The
company maintains a good ratio trend by keeping the ratio above the minimum level. The
ratio is comparative same and mentioned at the same level by paying the short term debt. The
liquidity is maintained constantly mitigating any financial risk.
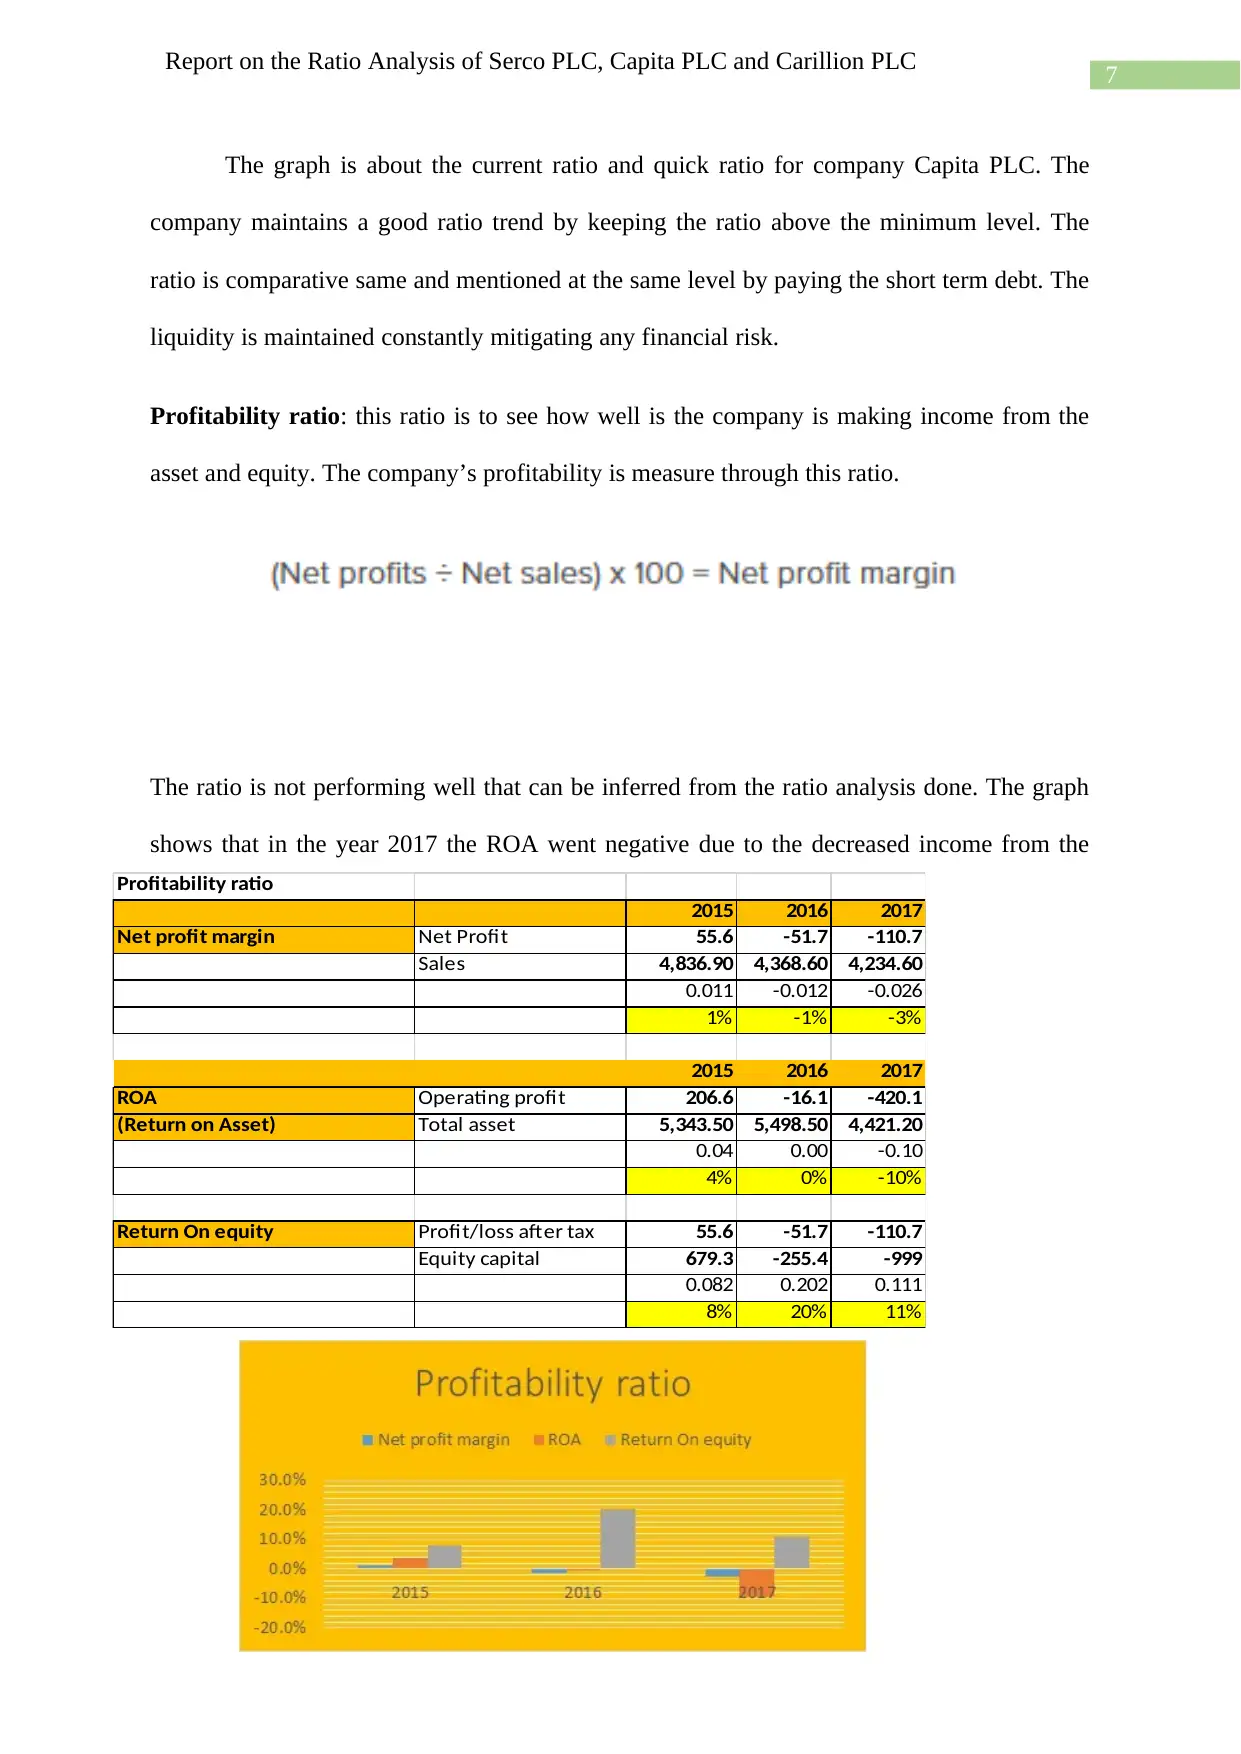
Profitability ratio: this ratio is to see how well is the company is making income from the
asset and equity. The company’s profitability is measure through this ratio.
The ratio is not performing well that can be inferred from the ratio analysis done. The graph
shows that in the year 2017 the ROA went negative due to the decreased income from the
Profitability ratio
2015 2016 2017
Net profit margin Net Profit 55.6 -51.7 -110.7
Sales 4,836.90 4,368.60 4,234.60
0.011 -0.012 -0.026
1% -1% -3%
2015 2016 2017
ROA Operating profit 206.6 -16.1 -420.1
(Return on Asset) Total asset 5,343.50 5,498.50 4,421.20
0.04 0.00 -0.10
4% 0% -10%
Return On equity Profit/loss after tax 55.6 -51.7 -110.7
Equity capital 679.3 -255.4 -999
0.082 0.202 0.111
8% 20% 11%
Report on the Ratio Analysis of Serco PLC, Capita PLC and Carillion PLC
The graph is about the current ratio and quick ratio for company Capita PLC. The
company maintains a good ratio trend by keeping the ratio above the minimum level. The
ratio is comparative same and mentioned at the same level by paying the short term debt. The
liquidity is maintained constantly mitigating any financial risk.
Profitability ratio: this ratio is to see how well is the company is making income from the
asset and equity. The company’s profitability is measure through this ratio.
The ratio is not performing well that can be inferred from the ratio analysis done. The graph
shows that in the year 2017 the ROA went negative due to the decreased income from the
Profitability ratio
2015 2016 2017
Net profit margin Net Profit 55.6 -51.7 -110.7
Sales 4,836.90 4,368.60 4,234.60
0.011 -0.012 -0.026
1% -1% -3%
2015 2016 2017
ROA Operating profit 206.6 -16.1 -420.1
(Return on Asset) Total asset 5,343.50 5,498.50 4,421.20
0.04 0.00 -0.10
4% 0% -10%
Return On equity Profit/loss after tax 55.6 -51.7 -110.7
Equity capital 679.3 -255.4 -999
0.082 0.202 0.111
8% 20% 11%
8
Report on the Ratio Analysis of Serco PLC, Capita PLC and Carillion PLC
operations. The ROA represents the Return on asset. This indicates that the company is
having huge amount of unused asset. The return on equity is not attractive this is due to the
low profit the company is making. The company has plan to become a B2G company in the
year 2014. The company made some changes that faced some loss due to the diversification
(Leiper Et al 2003.
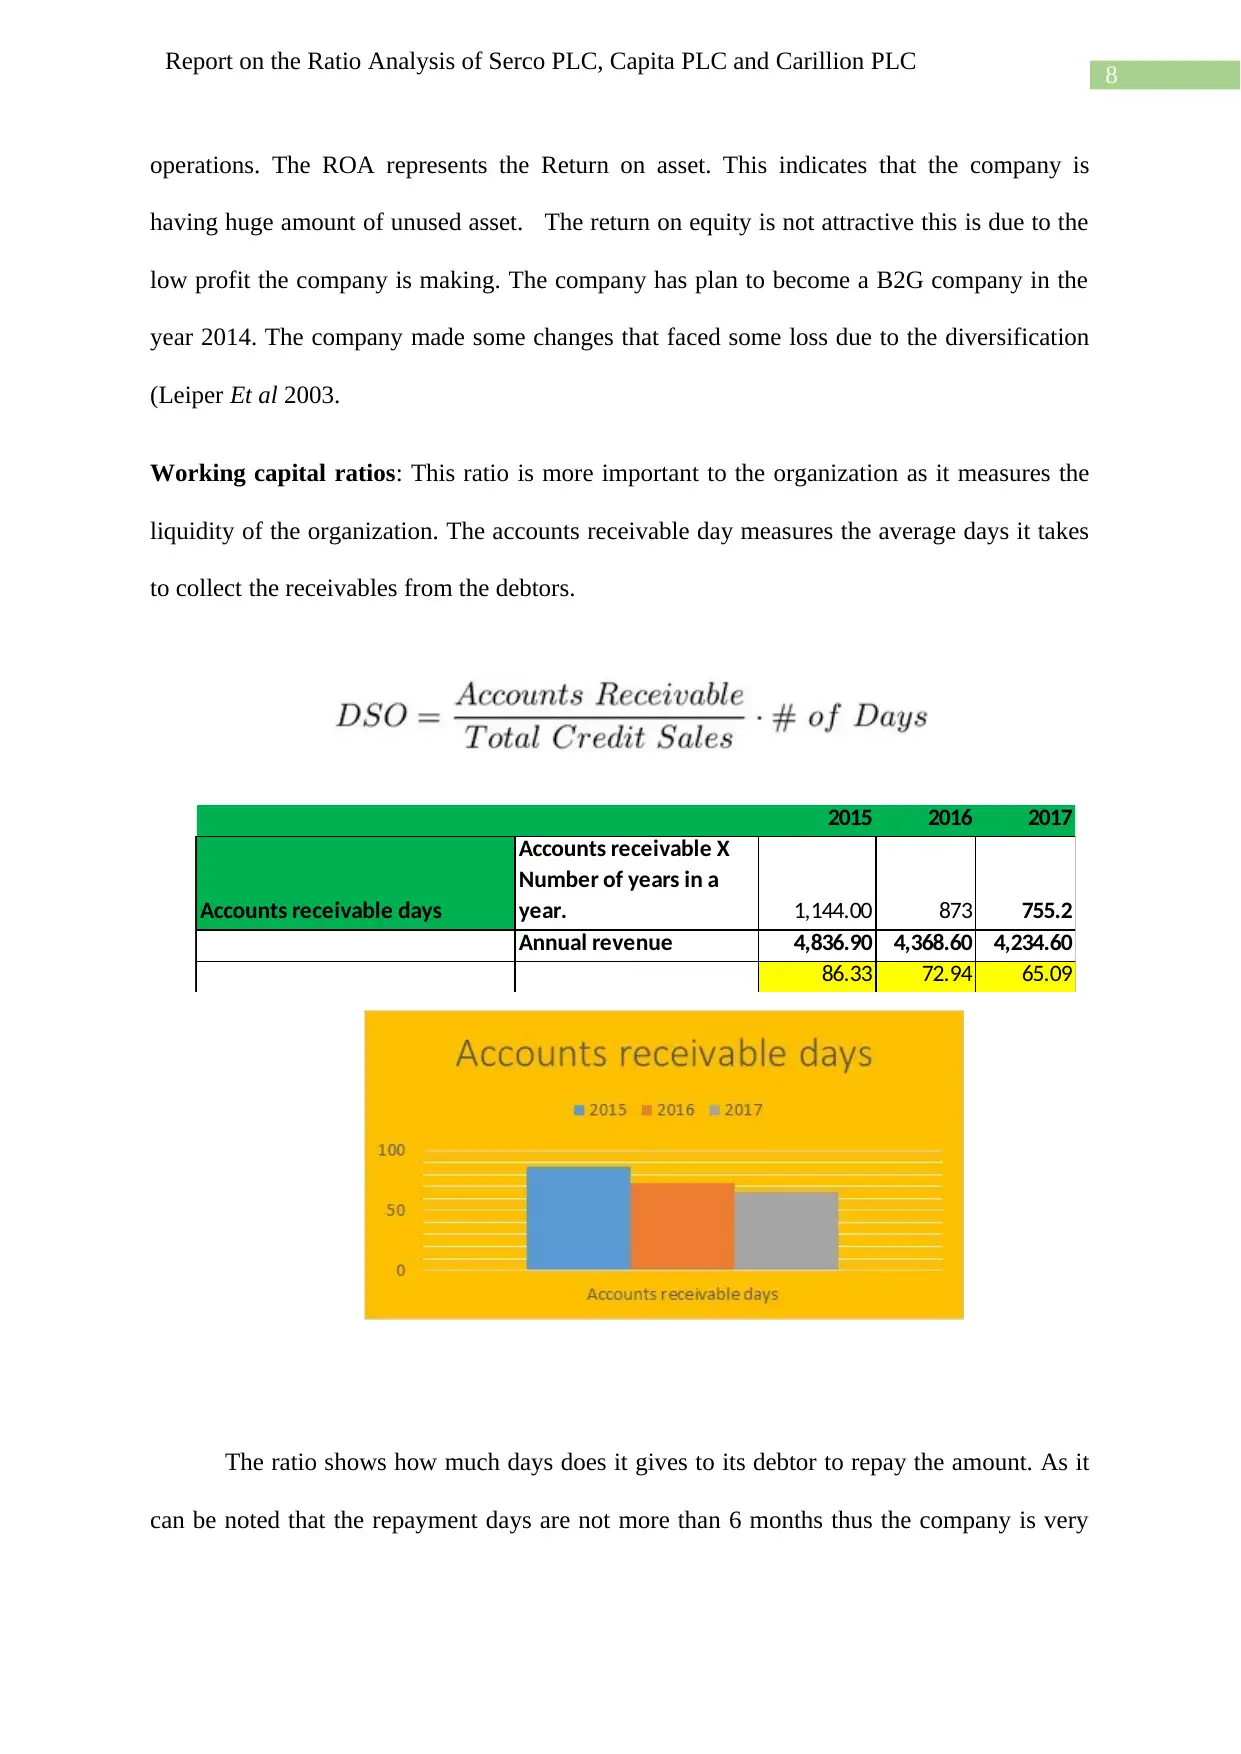
Working capital ratios: This ratio is more important to the organization as it measures the
liquidity of the organization. The accounts receivable day measures the average days it takes
to collect the receivables from the debtors.
The ratio shows how much days does it gives to its debtor to repay the amount. As it
can be noted that the repayment days are not more than 6 months thus the company is very
2015 2016 2017
Accounts receivable days
Accounts receivable X
Number of years in a
year. 1,144.00 873 755.2
Annual revenue 4,836.90 4,368.60 4,234.60
86.33 72.94 65.09
Report on the Ratio Analysis of Serco PLC, Capita PLC and Carillion PLC
operations. The ROA represents the Return on asset. This indicates that the company is
having huge amount of unused asset. The return on equity is not attractive this is due to the
low profit the company is making. The company has plan to become a B2G company in the
year 2014. The company made some changes that faced some loss due to the diversification
(Leiper Et al 2003.
Working capital ratios: This ratio is more important to the organization as it measures the
liquidity of the organization. The accounts receivable day measures the average days it takes
to collect the receivables from the debtors.
The ratio shows how much days does it gives to its debtor to repay the amount. As it
can be noted that the repayment days are not more than 6 months thus the company is very
2015 2016 2017
Accounts receivable days
Accounts receivable X
Number of years in a
year. 1,144.00 873 755.2
Annual revenue 4,836.90 4,368.60 4,234.60
86.33 72.94 65.09
⊘ This is a preview!⊘
Do you want full access?
Subscribe today to unlock all pages.
Trusted by 1+ million students worldwide
9
Report on the Ratio Analysis of Serco PLC, Capita PLC and Carillion PLC
much safe the amount is getting back to the account is very early. The company seems very
stable.
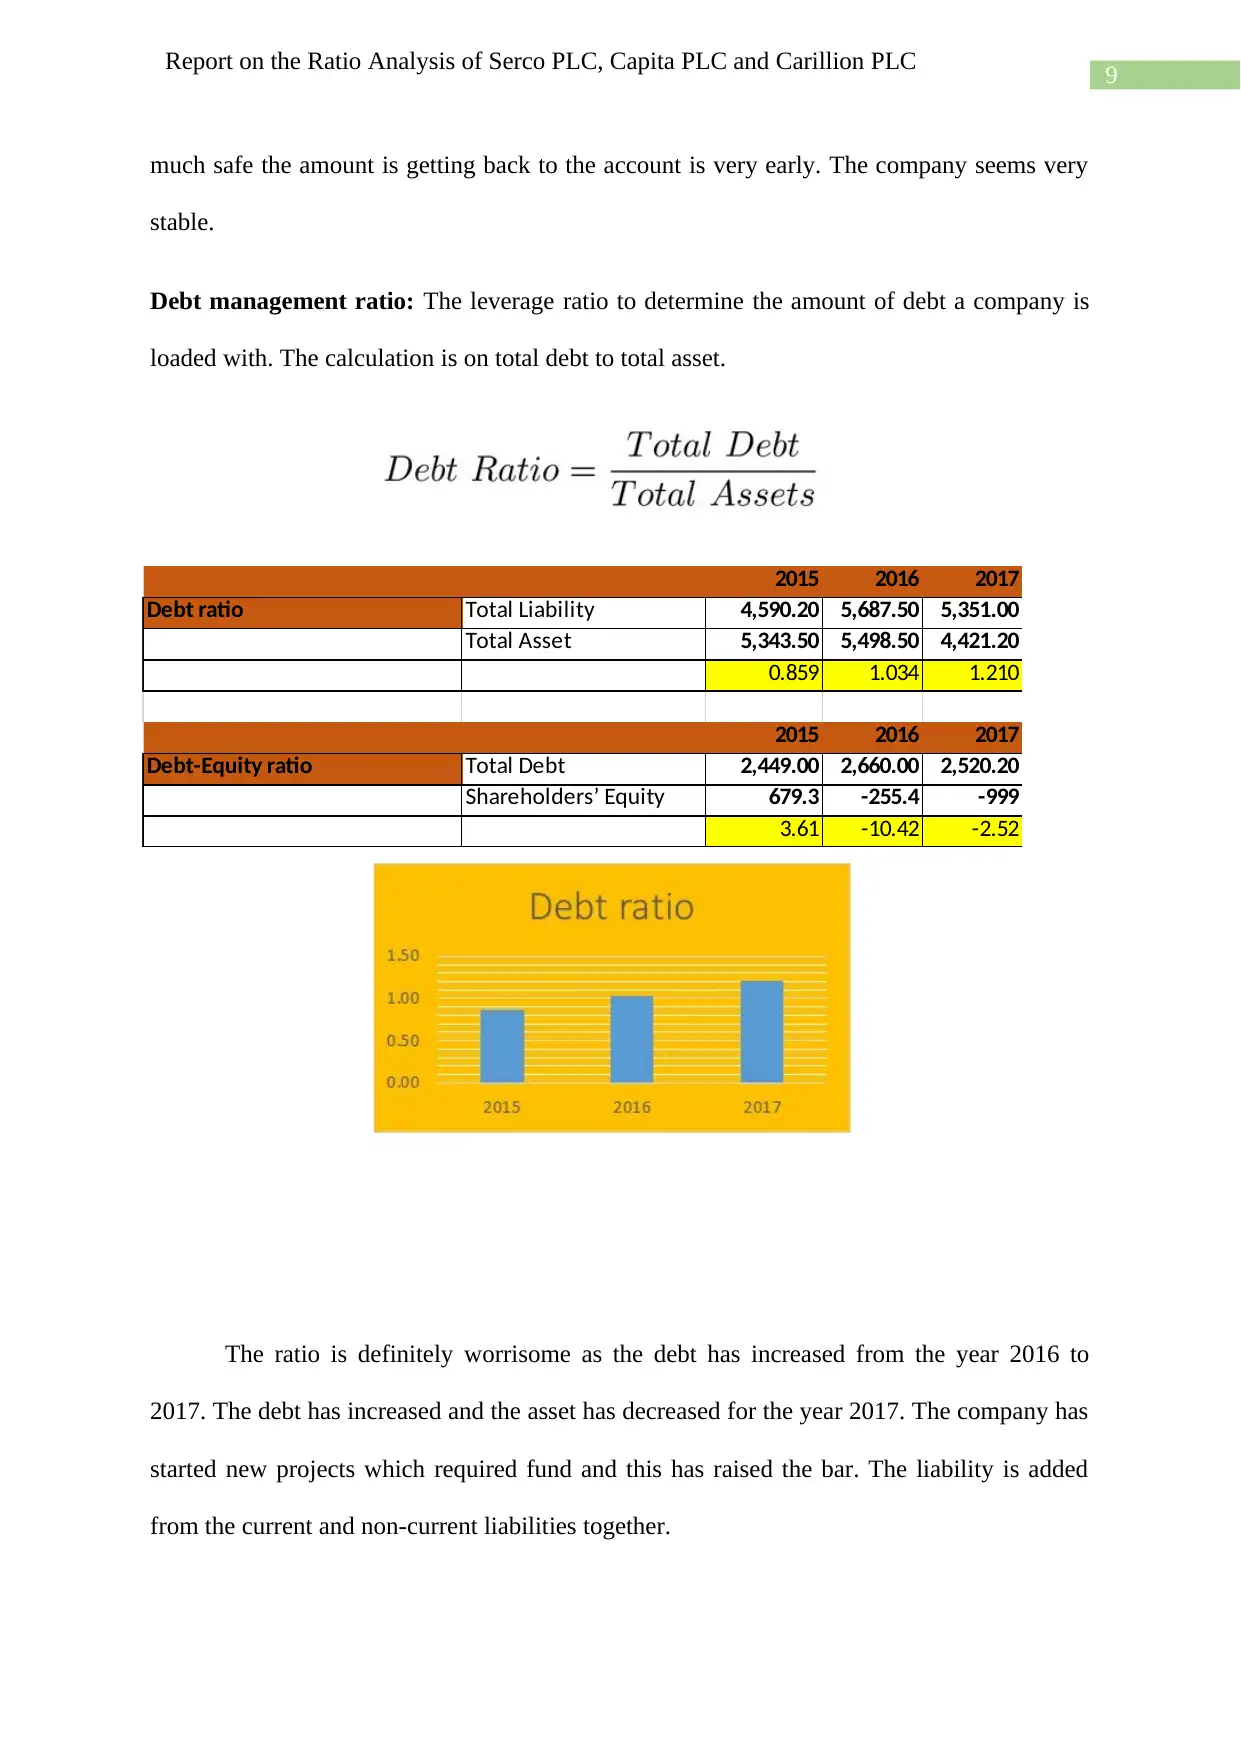
Debt management ratio: The leverage ratio to determine the amount of debt a company is
loaded with. The calculation is on total debt to total asset.
The ratio is definitely worrisome as the debt has increased from the year 2016 to
2017. The debt has increased and the asset has decreased for the year 2017. The company has
started new projects which required fund and this has raised the bar. The liability is added
from the current and non-current liabilities together.
2015 2016 2017
Debt ratio Total Liability 4,590.20 5,687.50 5,351.00
Total Asset 5,343.50 5,498.50 4,421.20
0.859 1.034 1.210
2015 2016 2017
Debt-Equity ratio Total Debt 2,449.00 2,660.00 2,520.20
Shareholders’ Equity 679.3 -255.4 -999
3.61 -10.42 -2.52
Report on the Ratio Analysis of Serco PLC, Capita PLC and Carillion PLC
much safe the amount is getting back to the account is very early. The company seems very
stable.
Debt management ratio: The leverage ratio to determine the amount of debt a company is
loaded with. The calculation is on total debt to total asset.
The ratio is definitely worrisome as the debt has increased from the year 2016 to
2017. The debt has increased and the asset has decreased for the year 2017. The company has
started new projects which required fund and this has raised the bar. The liability is added
from the current and non-current liabilities together.
2015 2016 2017
Debt ratio Total Liability 4,590.20 5,687.50 5,351.00
Total Asset 5,343.50 5,498.50 4,421.20
0.859 1.034 1.210
2015 2016 2017
Debt-Equity ratio Total Debt 2,449.00 2,660.00 2,520.20
Shareholders’ Equity 679.3 -255.4 -999
3.61 -10.42 -2.52
Paraphrase This Document
Need a fresh take? Get an instant paraphrase of this document with our AI Paraphraser
10
Report on the Ratio Analysis of Serco PLC, Capita PLC and Carillion PLC
Looking at the ratios we can conclude that in all case company Capita Plc is in safe
and stable conditions. The debt is manageable as the amount of asset is also in same ratio.
The liquidity is also very good state the company is operating safely.
Ratio analysis of Serco Plc.
The Public service giant is one of the biggest companies sin UK. The company has
clients from the private and public sector. The diversification that it has in Defense, justice &
immigration, health and citizen services. The service is delivered in countries in UK, Europe
North America and the middle east. The history if the company is very interesting it started in
1929 and in year 1988 it got listed on stock exchange of London (Serco Group plc 2019).
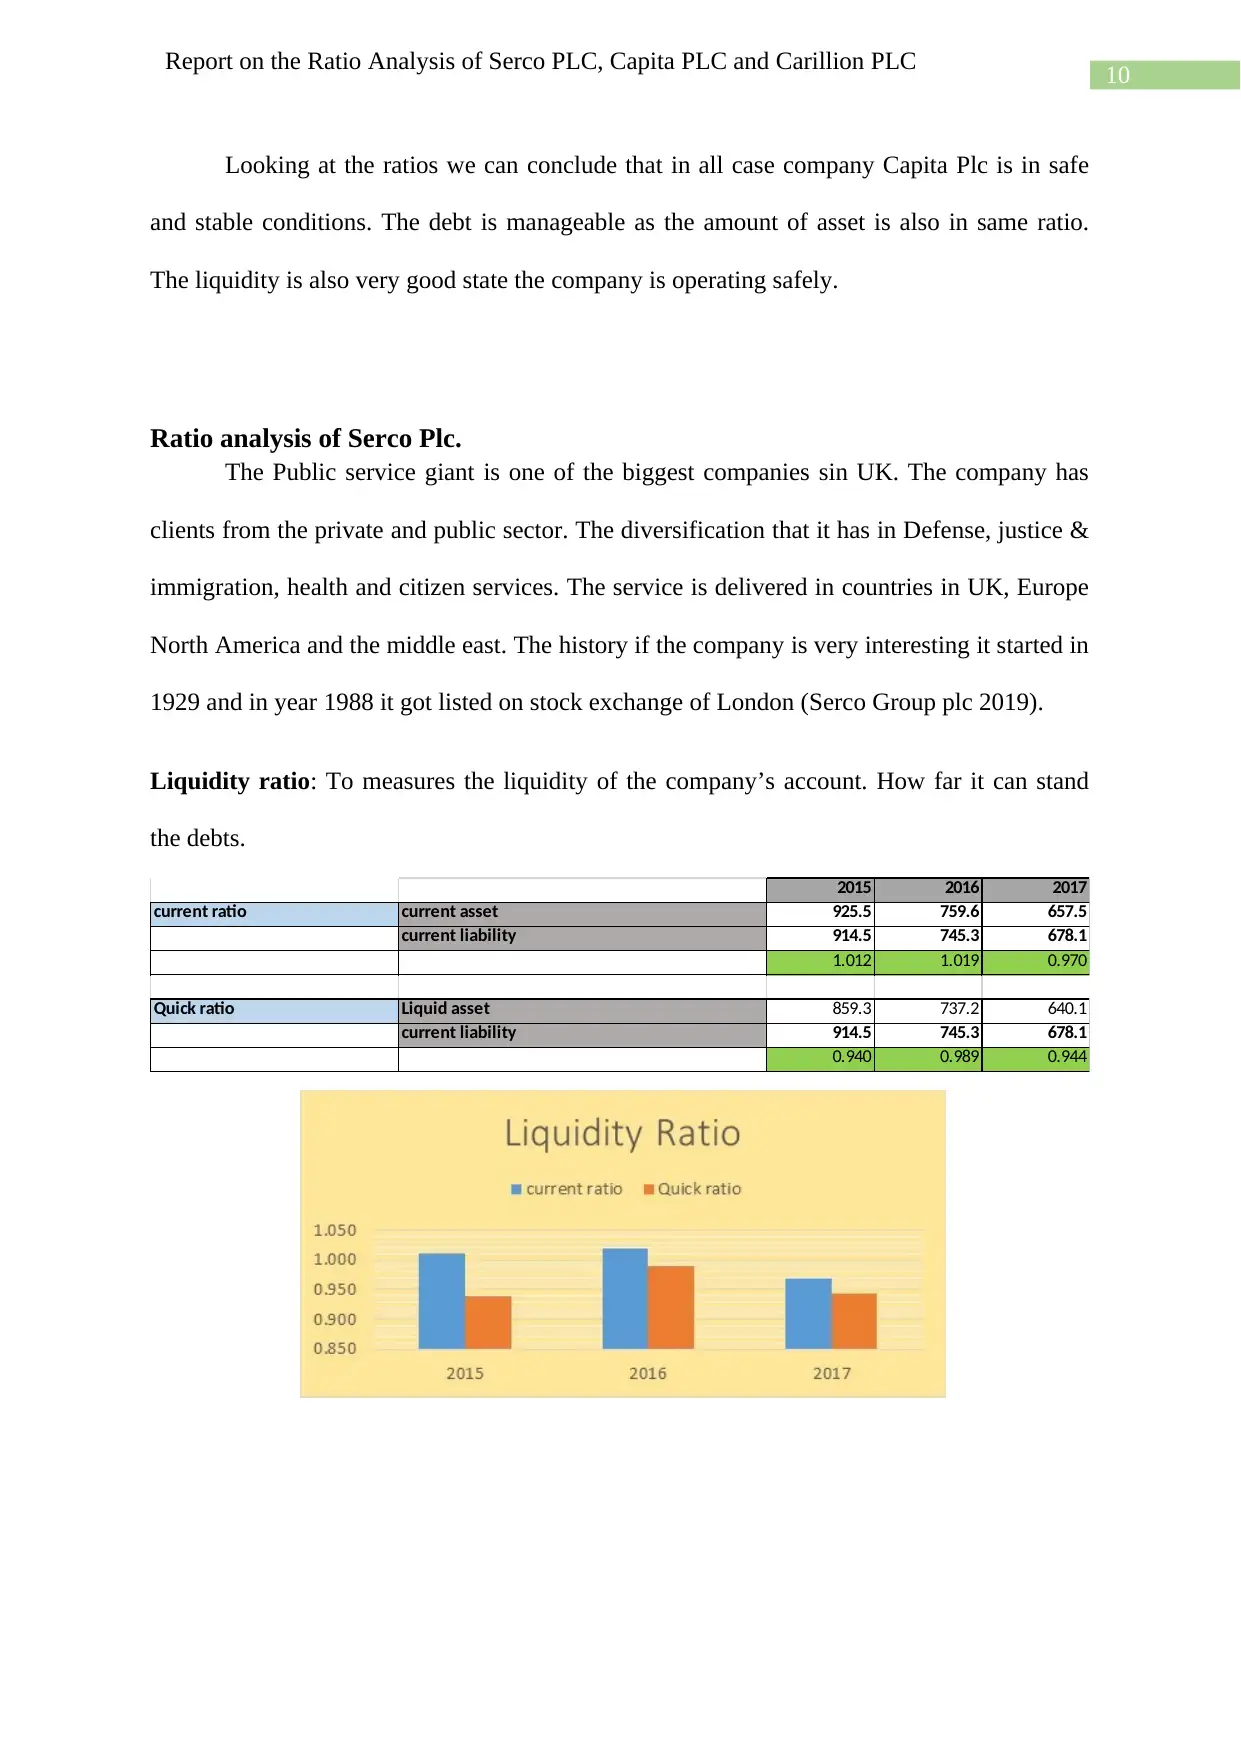
Liquidity ratio: To measures the liquidity of the company’s account. How far it can stand
the debts.
2015 2016 2017
current ratio current asset 925.5 759.6 657.5
current liability 914.5 745.3 678.1
1.012 1.019 0.970
Quick ratio Liquid asset 859.3 737.2 640.1
current liability 914.5 745.3 678.1
0.940 0.989 0.944
Report on the Ratio Analysis of Serco PLC, Capita PLC and Carillion PLC
Looking at the ratios we can conclude that in all case company Capita Plc is in safe
and stable conditions. The debt is manageable as the amount of asset is also in same ratio.
The liquidity is also very good state the company is operating safely.
Ratio analysis of Serco Plc.
The Public service giant is one of the biggest companies sin UK. The company has
clients from the private and public sector. The diversification that it has in Defense, justice &
immigration, health and citizen services. The service is delivered in countries in UK, Europe
North America and the middle east. The history if the company is very interesting it started in
1929 and in year 1988 it got listed on stock exchange of London (Serco Group plc 2019).
Liquidity ratio: To measures the liquidity of the company’s account. How far it can stand
the debts.
2015 2016 2017
current ratio current asset 925.5 759.6 657.5
current liability 914.5 745.3 678.1
1.012 1.019 0.970
Quick ratio Liquid asset 859.3 737.2 640.1
current liability 914.5 745.3 678.1
0.940 0.989 0.944
11
Report on the Ratio Analysis of Serco PLC, Capita PLC and Carillion PLC
The liquidity ratio is in the best position. The current asset has decreased from the
year 2016 to 2017 this is due to the sale of the asset and conversion the ratio is still at the best
condition as the management is very concerned about the maintenance of the ratio. The quick
ratio is close to the 1 which is counting the stability of the company’s account.
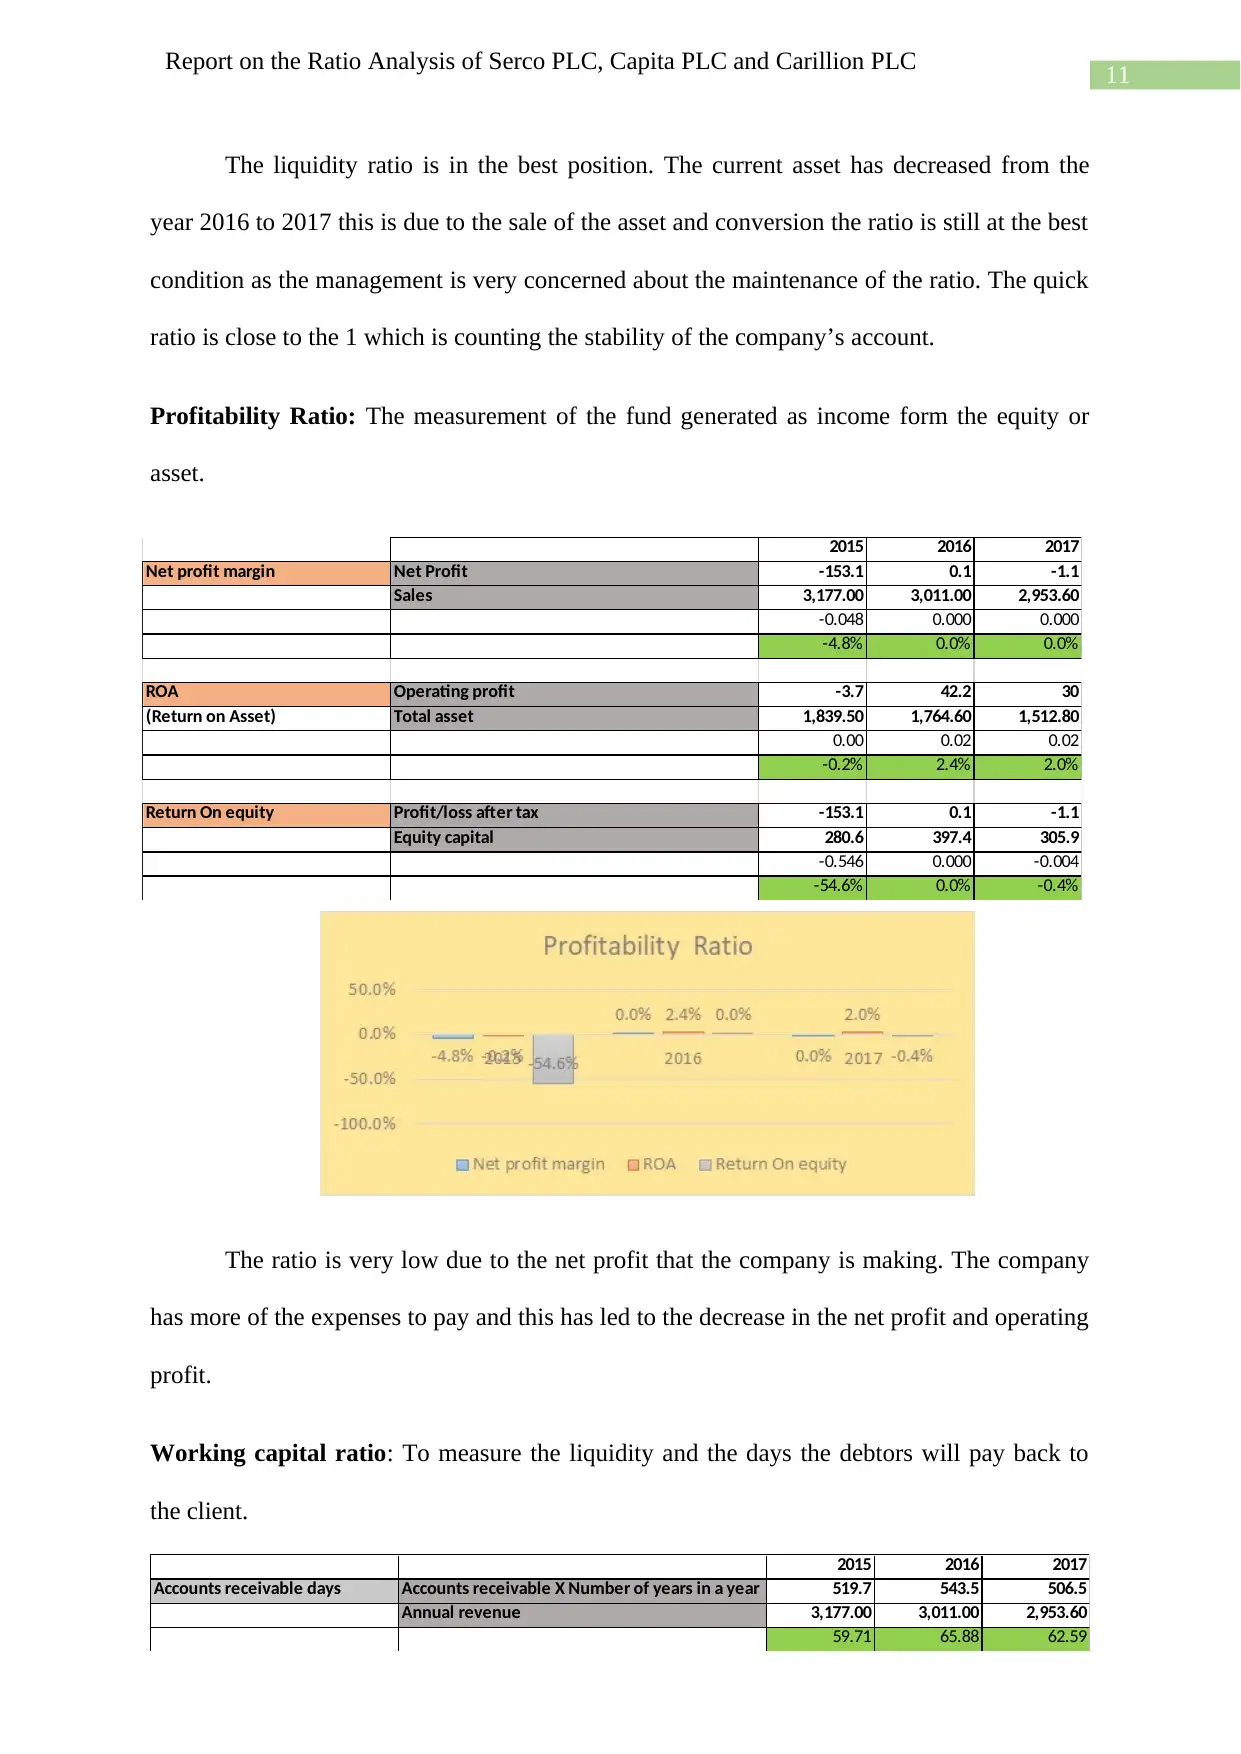
Profitability Ratio: The measurement of the fund generated as income form the equity or
asset.
The ratio is very low due to the net profit that the company is making. The company
has more of the expenses to pay and this has led to the decrease in the net profit and operating
profit.
Working capital ratio: To measure the liquidity and the days the debtors will pay back to
the client.
2015 2016 2017
Net profit margin Net Profit -153.1 0.1 -1.1
Sales 3,177.00 3,011.00 2,953.60
-0.048 0.000 0.000
-4.8% 0.0% 0.0%
ROA Operating profit -3.7 42.2 30
(Return on Asset) Total asset 1,839.50 1,764.60 1,512.80
0.00 0.02 0.02
-0.2% 2.4% 2.0%
Return On equity Profit/loss after tax -153.1 0.1 -1.1
Equity capital 280.6 397.4 305.9
-0.546 0.000 -0.004
-54.6% 0.0% -0.4%
2015 2016 2017
Accounts receivable days Accounts receivable X Number of years in a year 519.7 543.5 506.5
Annual revenue 3,177.00 3,011.00 2,953.60
59.71 65.88 62.59
Report on the Ratio Analysis of Serco PLC, Capita PLC and Carillion PLC
The liquidity ratio is in the best position. The current asset has decreased from the
year 2016 to 2017 this is due to the sale of the asset and conversion the ratio is still at the best
condition as the management is very concerned about the maintenance of the ratio. The quick
ratio is close to the 1 which is counting the stability of the company’s account.
Profitability Ratio: The measurement of the fund generated as income form the equity or
asset.
The ratio is very low due to the net profit that the company is making. The company
has more of the expenses to pay and this has led to the decrease in the net profit and operating
profit.
Working capital ratio: To measure the liquidity and the days the debtors will pay back to
the client.
2015 2016 2017
Net profit margin Net Profit -153.1 0.1 -1.1
Sales 3,177.00 3,011.00 2,953.60
-0.048 0.000 0.000
-4.8% 0.0% 0.0%
ROA Operating profit -3.7 42.2 30
(Return on Asset) Total asset 1,839.50 1,764.60 1,512.80
0.00 0.02 0.02
-0.2% 2.4% 2.0%
Return On equity Profit/loss after tax -153.1 0.1 -1.1
Equity capital 280.6 397.4 305.9
-0.546 0.000 -0.004
-54.6% 0.0% -0.4%
2015 2016 2017
Accounts receivable days Accounts receivable X Number of years in a year 519.7 543.5 506.5
Annual revenue 3,177.00 3,011.00 2,953.60
59.71 65.88 62.59
⊘ This is a preview!⊘
Do you want full access?
Subscribe today to unlock all pages.
Trusted by 1+ million students worldwide
1 out of 25
Related Documents


Your All-in-One AI-Powered Toolkit for Academic Success.
+13062052269
info@desklib.com
Available 24*7 on WhatsApp / Email
![[object Object]](/_next/static/media/star-bottom.7253800d.svg)
Unlock your academic potential
Copyright © 2020–2026 A2Z Services. All Rights Reserved. Developed and managed by ZUCOL.