Financial Analysis Report: Nike vs. UnderArmour Performance Comparison
VerifiedAdded on 2022/12/27
|6
|868
|81
Report
AI Summary
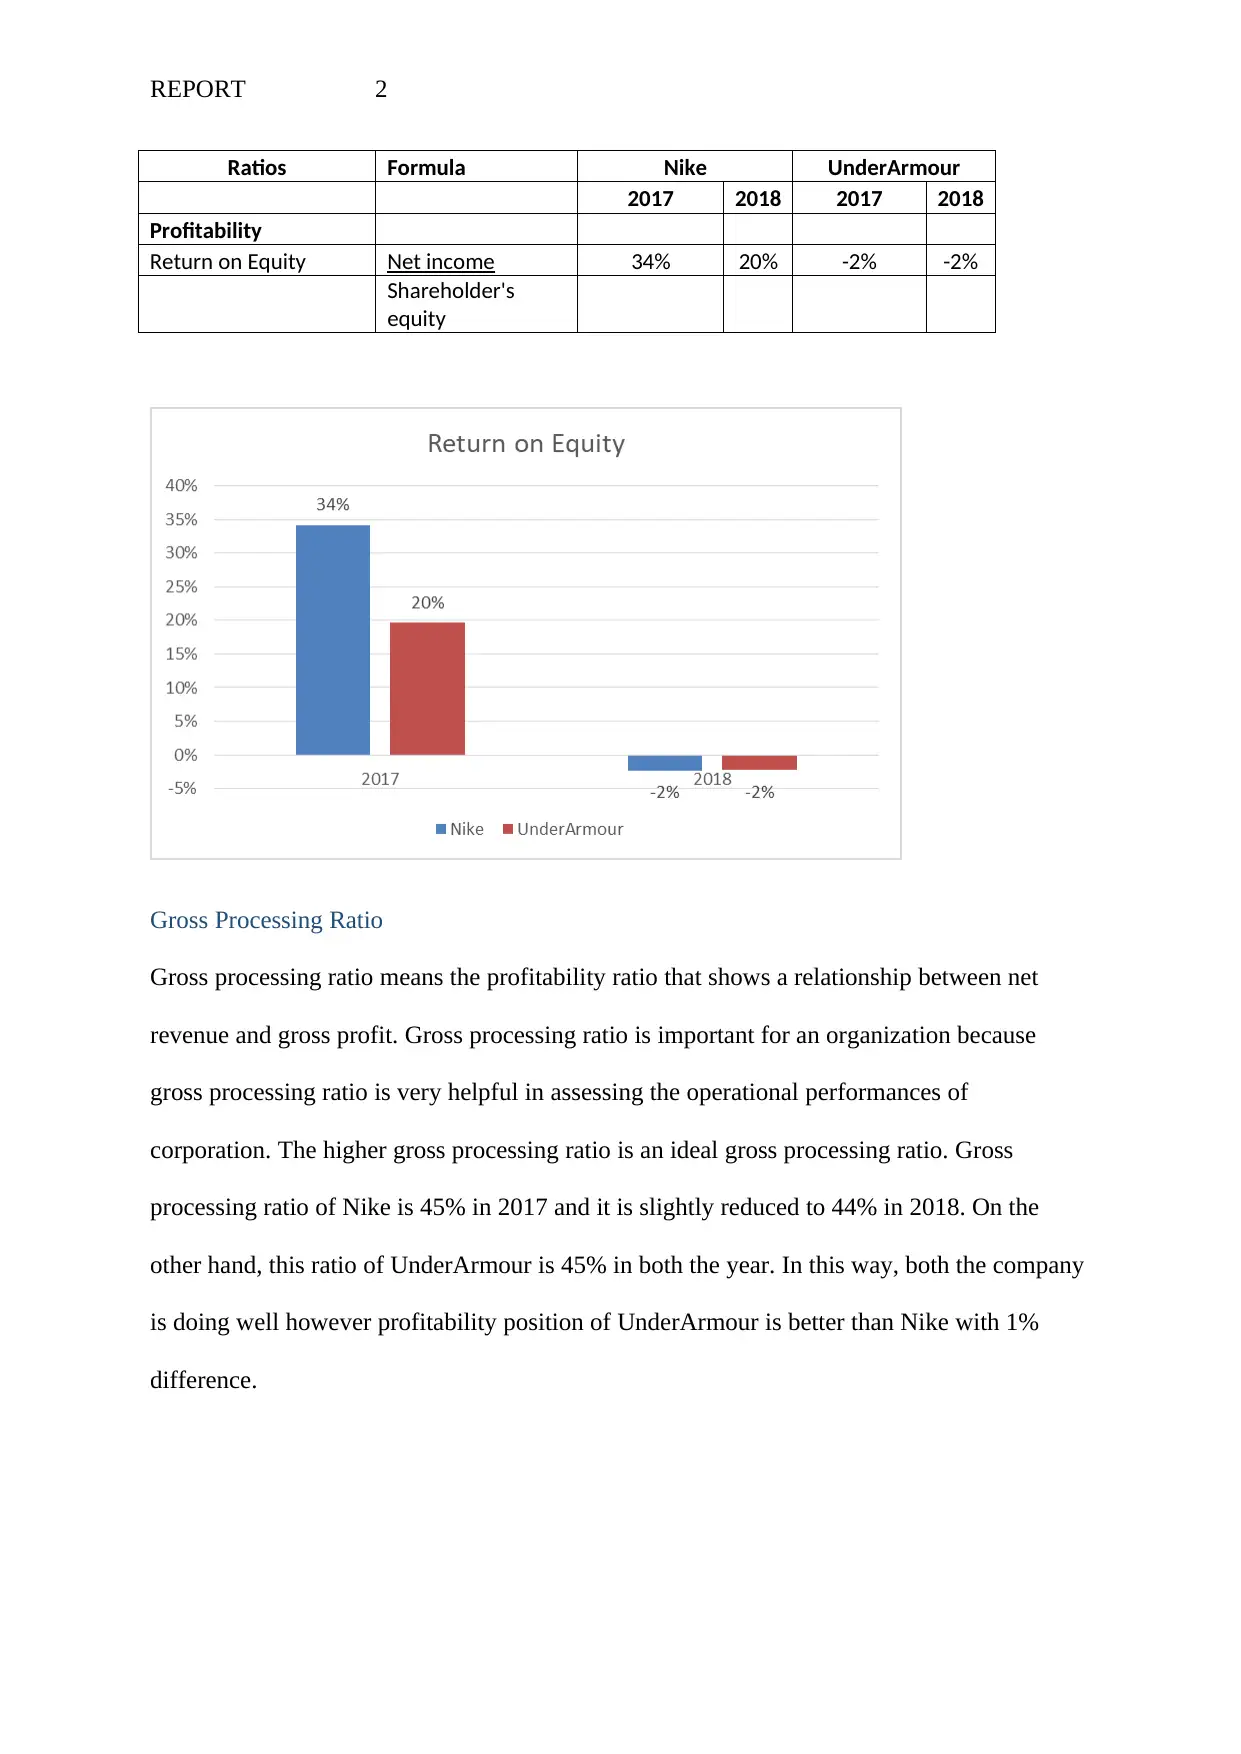
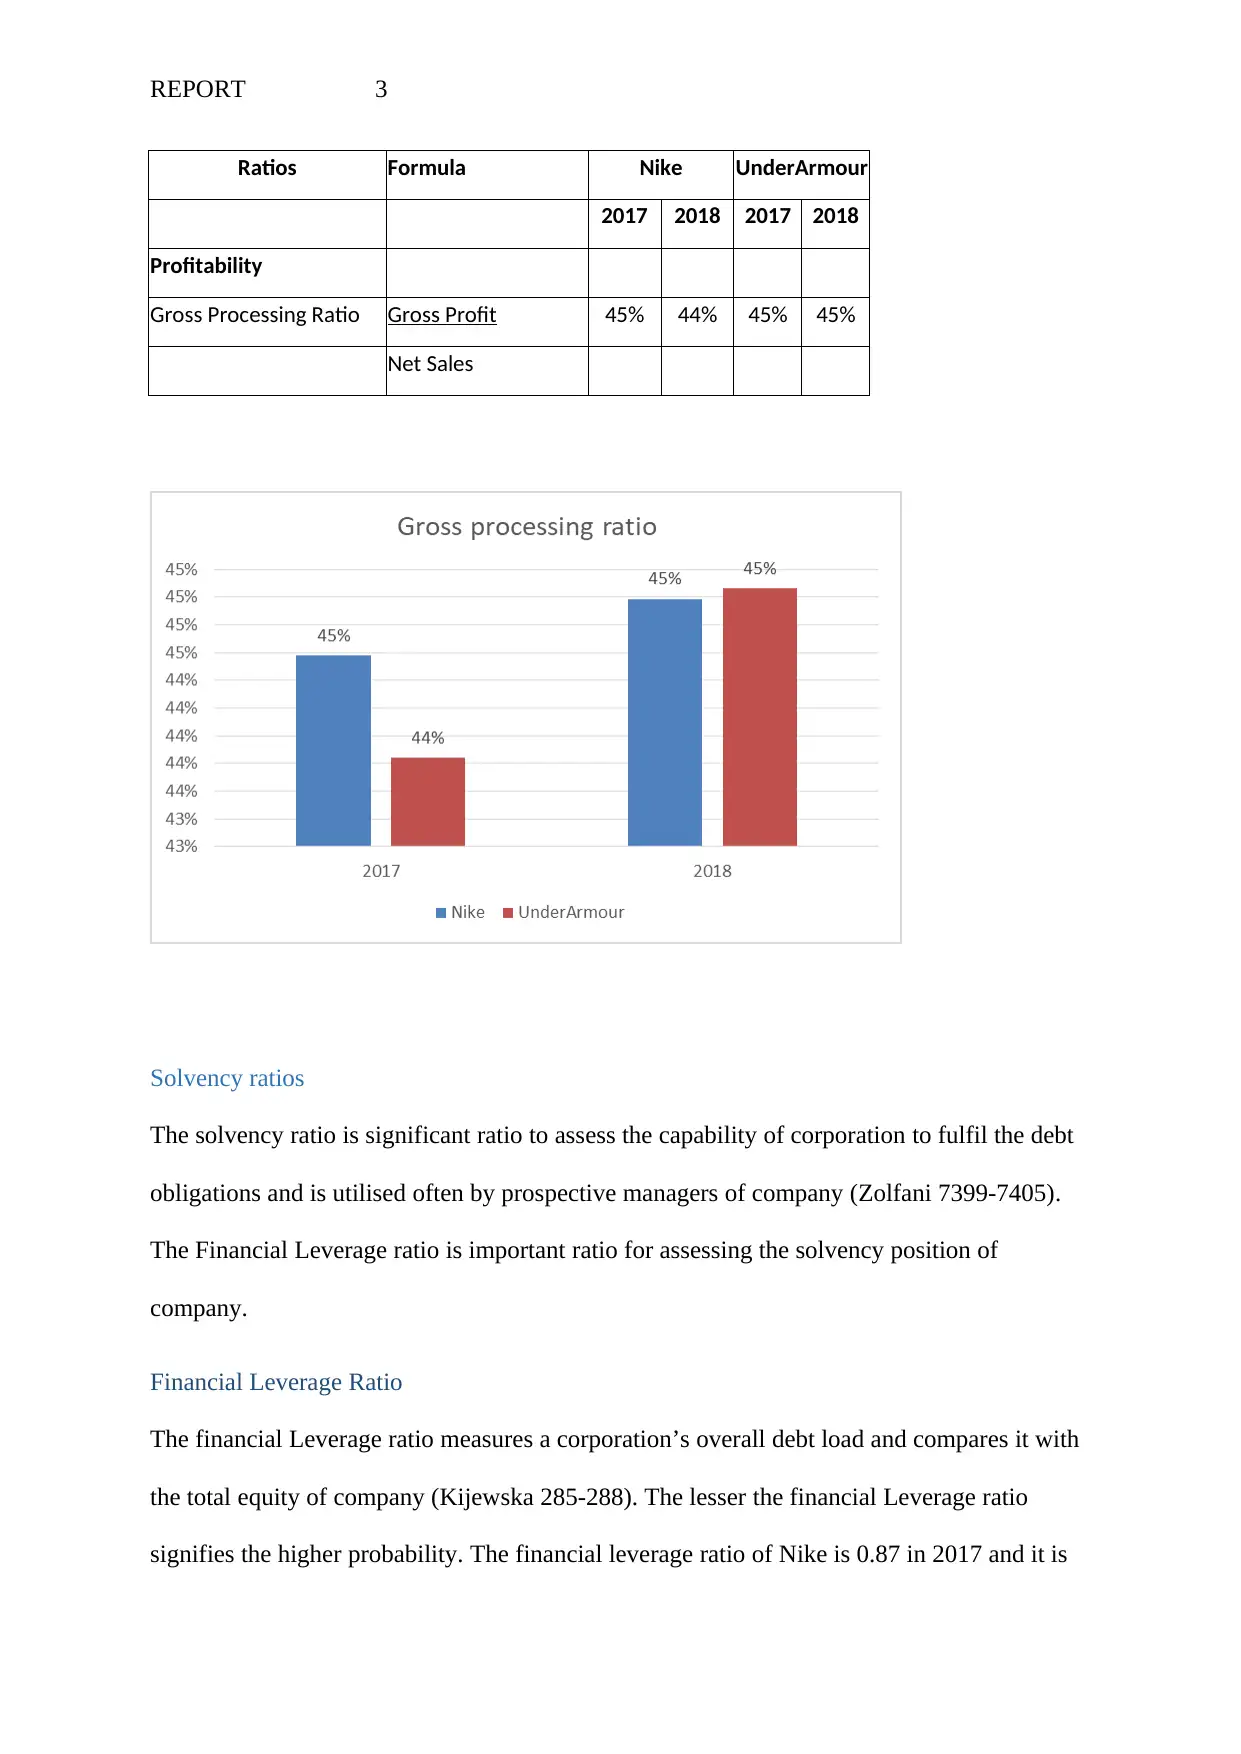
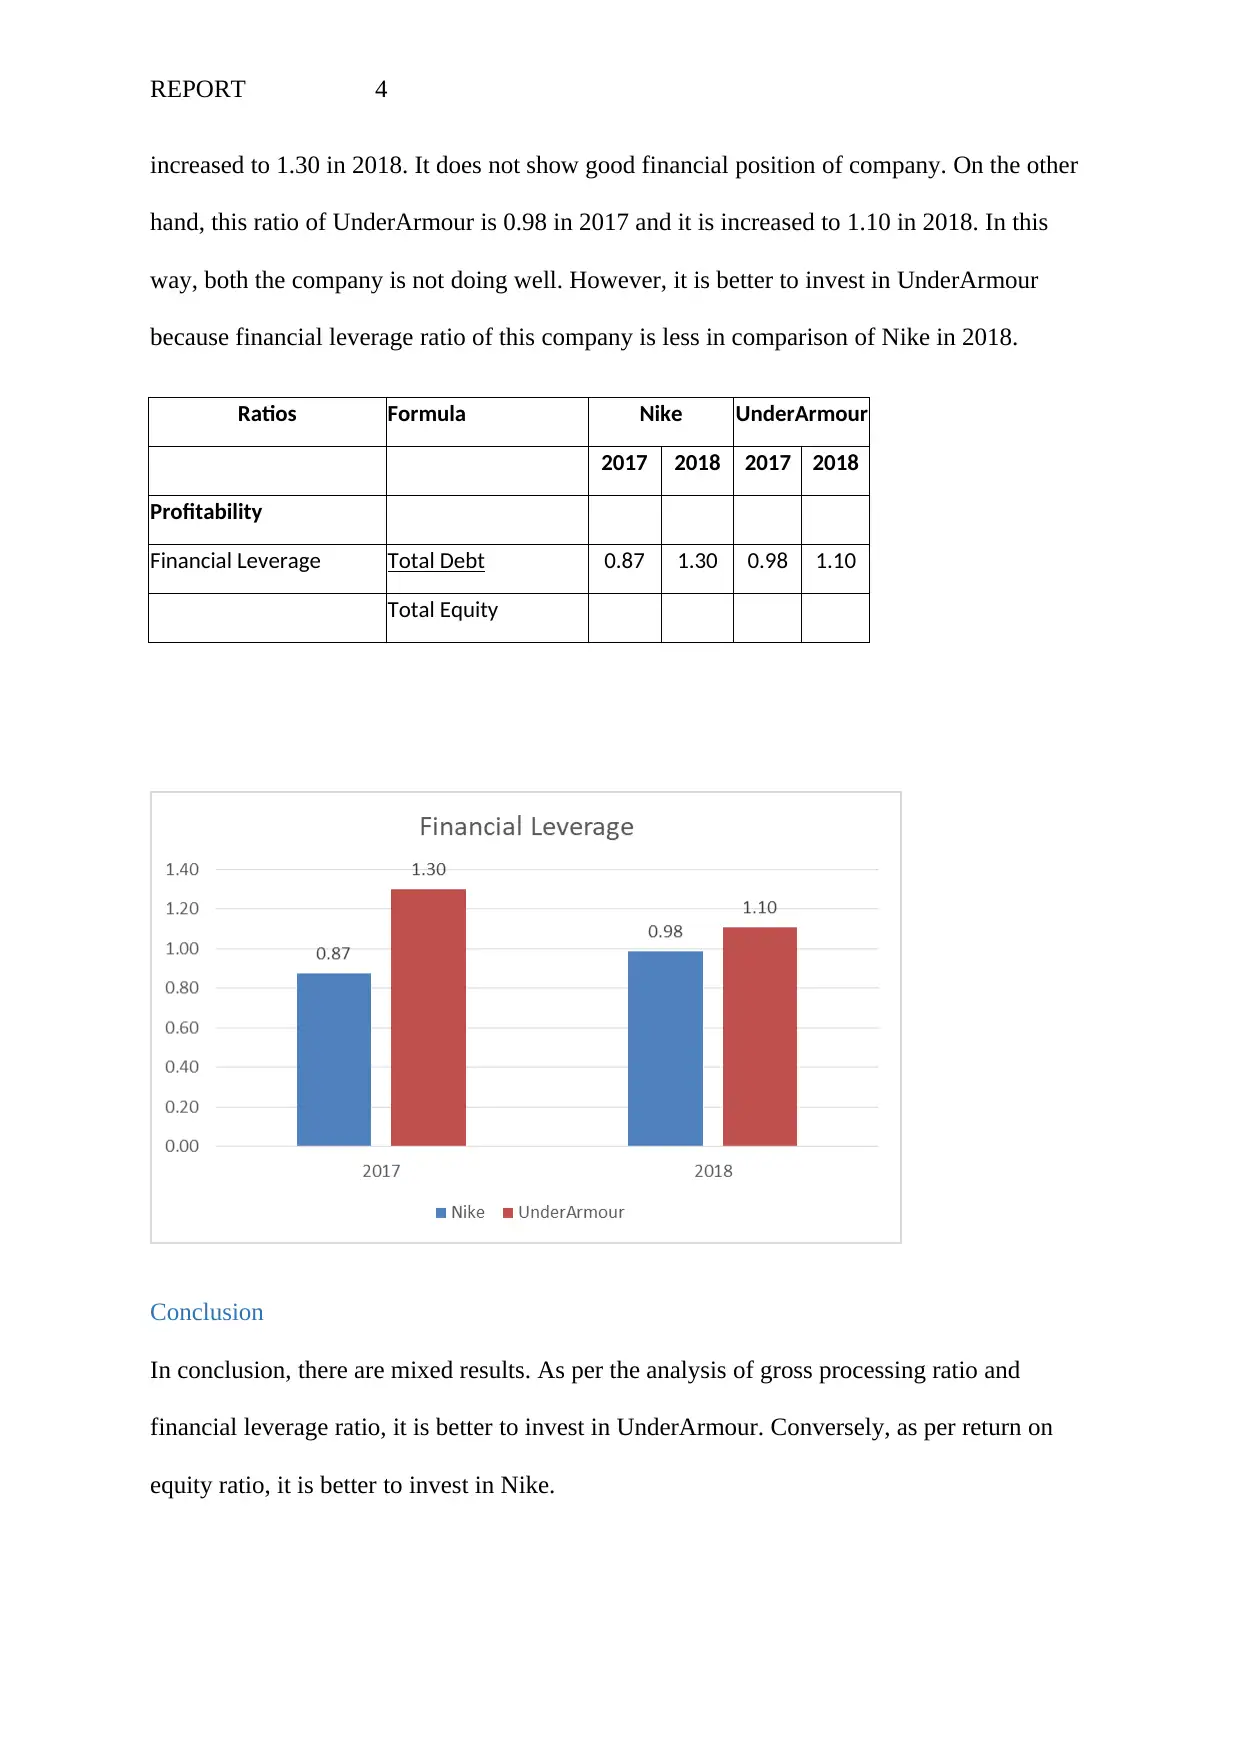
This report presents a financial analysis of Nike and UnderArmour, focusing on profitability and solvency ratios. The analysis includes an examination of return on equity, gross processing ratio, and financial leverage ratio for both companies over a two-year period. The report compares the financial performance of the two companies, providing insights into their strengths and weaknesses. The analysis utilizes financial statements and ratio analysis to assess the companies' abilities to generate income and manage debt obligations. The conclusion summarizes the findings, indicating which company demonstrates better performance based on the analyzed ratios. References to relevant academic sources are included to support the analysis.

Running head: REPORT 0
FINANCIAL STATEMENT ANALYSIS
MAY 2, 2019
STUDENT DETAILS:
FINANCIAL STATEMENT ANALYSIS
MAY 2, 2019
STUDENT DETAILS:
Paraphrase This Document
Need a fresh take? Get an instant paraphrase of this document with our AI Paraphraser

REPORT 1
Introduction
The financial Analysis is very important tool. It is so helpful in examining the performance of
corporation on a basis of assessment of the income statement, balance sheet and assessment
through the ratio analysis. A major objective of financial analysis is to know whether a
corporation is constant or not, and whether a corporation is solvent or not. The company will
also be able to know that what is the liquidity position and profitability position of company
(Arkan 13-26). The corporation may easily take the investment related decisions. In this
report, profitability position and solvency position of Nike and UnderArmour is examined.
Ratio analysis
Profitability ratios
Profitability ratio of a corporation refers to the ratios, which determine ability of company to
generate incomes as compared to expenditures during the specific period. Gross processing
ratio and return on equity ratio are significant ratios to assess the profitability of companies.
Return on Equity
The return on equity (ROE) ratio states that how much profit the corporation may earn from
the money (Sulkava 197-206). This ratio is very useful for the management because it
assesses the capability of the corporation to make profits from the stakeholder’s investments
in the corporation. The higher return on equity ratio signifies a higher profitability. The return
on equity ratio of Nike is 34% in 2017 and it is slightly reduced to 20% in 2018. On the other
hand, this ratio of UnderArmour is -2% in both the year. In this way, both the company is not
doing well. But it is better to invest in Nike.

REPORT 2
Ratios Formula Nike UnderArmour
2017 2018 2017 2018
Profitability
Return on Equity Net income 34% 20% -2% -2%
Shareholder's
equity
Gross Processing Ratio
Gross processing ratio means the profitability ratio that shows a relationship between net
revenue and gross profit. Gross processing ratio is important for an organization because
gross processing ratio is very helpful in assessing the operational performances of
corporation. The higher gross processing ratio is an ideal gross processing ratio. Gross
processing ratio of Nike is 45% in 2017 and it is slightly reduced to 44% in 2018. On the
other hand, this ratio of UnderArmour is 45% in both the year. In this way, both the company
is doing well however profitability position of UnderArmour is better than Nike with 1%
difference.
⊘ This is a preview!⊘
Do you want full access?
Subscribe today to unlock all pages.

Trusted by 1+ million students worldwide

REPORT 3
Ratios Formula Nike UnderArmour
2017 2018 2017 2018
Profitability
Gross Processing Ratio Gross Profit 45% 44% 45% 45%
Net Sales
Solvency ratios
The solvency ratio is significant ratio to assess the capability of corporation to fulfil the debt
obligations and is utilised often by prospective managers of company (Zolfani 7399-7405).
The Financial Leverage ratio is important ratio for assessing the solvency position of
company.
Financial Leverage Ratio
The financial Leverage ratio measures a corporation’s overall debt load and compares it with
the total equity of company (Kijewska 285-288). The lesser the financial Leverage ratio
signifies the higher probability. The financial leverage ratio of Nike is 0.87 in 2017 and it is
Paraphrase This Document
Need a fresh take? Get an instant paraphrase of this document with our AI Paraphraser

REPORT 4
increased to 1.30 in 2018. It does not show good financial position of company. On the other
hand, this ratio of UnderArmour is 0.98 in 2017 and it is increased to 1.10 in 2018. In this
way, both the company is not doing well. However, it is better to invest in UnderArmour
because financial leverage ratio of this company is less in comparison of Nike in 2018.
Ratios Formula Nike UnderArmour
2017 2018 2017 2018
Profitability
Financial Leverage Total Debt 0.87 1.30 0.98 1.10
Total Equity
Conclusion
In conclusion, there are mixed results. As per the analysis of gross processing ratio and
financial leverage ratio, it is better to invest in UnderArmour. Conversely, as per return on
equity ratio, it is better to invest in Nike.

REPORT 5
References
Arkan, Thomas. "The importance of financial ratios in predicting stock price trends: A case
study in emerging markets." Finanse, Rynki Finansowe, Ubezpieczenia 79.1 (2016): 13-26.
Kijewska, A. "Determinants of the return on equity ratio (ROE) on the example of companies
from metallurgy and mining sector in Poland." Metalurgija 55.2 (2016): 285-288.
Sulkava, Mika, et al. "Clustering of the self-organizing map reveals profiles of farm
profitability and upscaling weights." Neurocomputing 147 (2015): 197-206.
Zolfani, Sarfaraz Hashemkhani. "An extended stepwise weight assessment ratio analysis
(SWARA) method for improving criteria prioritization process." Soft Computing 22.22
(2018): 7399-7405.
⊘ This is a preview!⊘
Do you want full access?
Subscribe today to unlock all pages.

Trusted by 1+ million students worldwide
1 out of 6
Related Documents
Your All-in-One AI-Powered Toolkit for Academic Success.
+13062052269
info@desklib.com
Available 24*7 on WhatsApp / Email
Unlock your academic potential
Copyright © 2020–2025 A2Z Services. All Rights Reserved. Developed and managed by ZUCOL.


