Financial Statement Analysis and Ratio Calculations - Accounting
VerifiedAdded on  2023/04/23
|10
|1309
|412
Homework Assignment
AI Summary
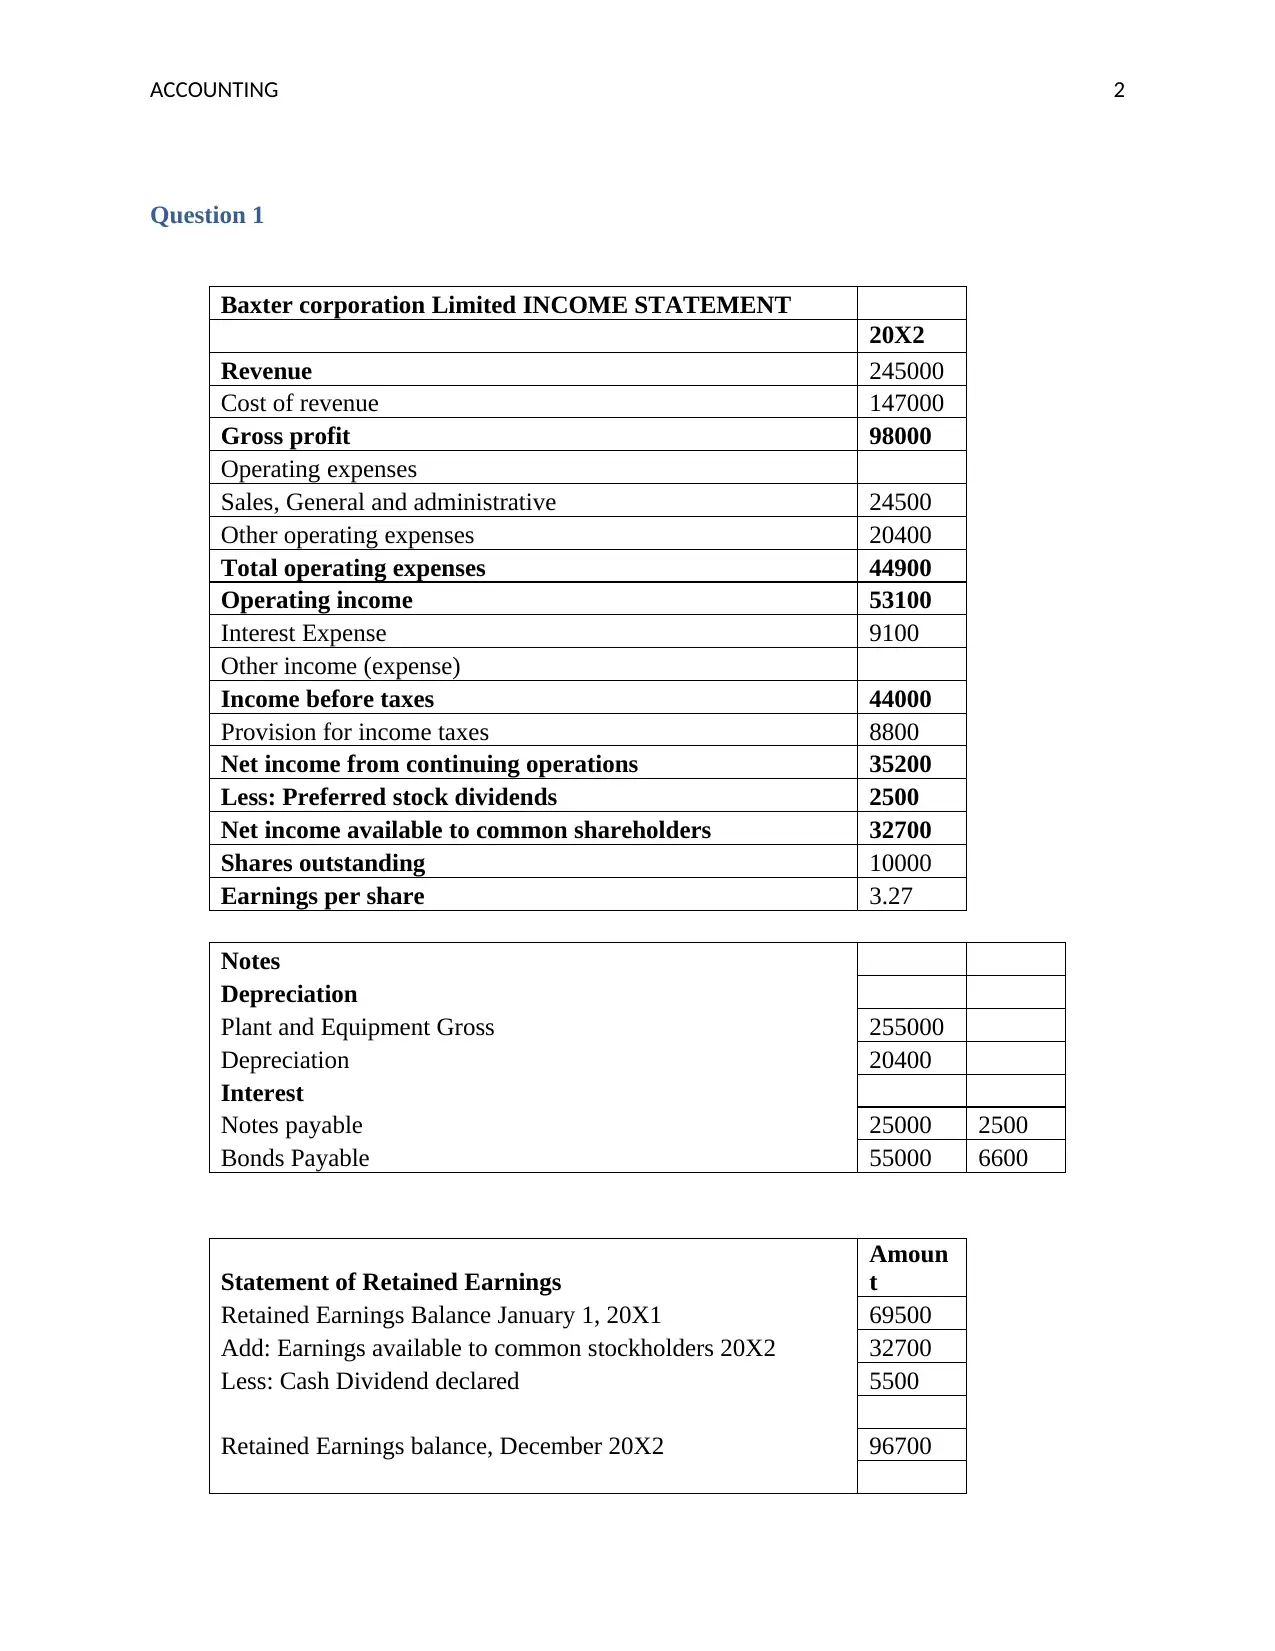
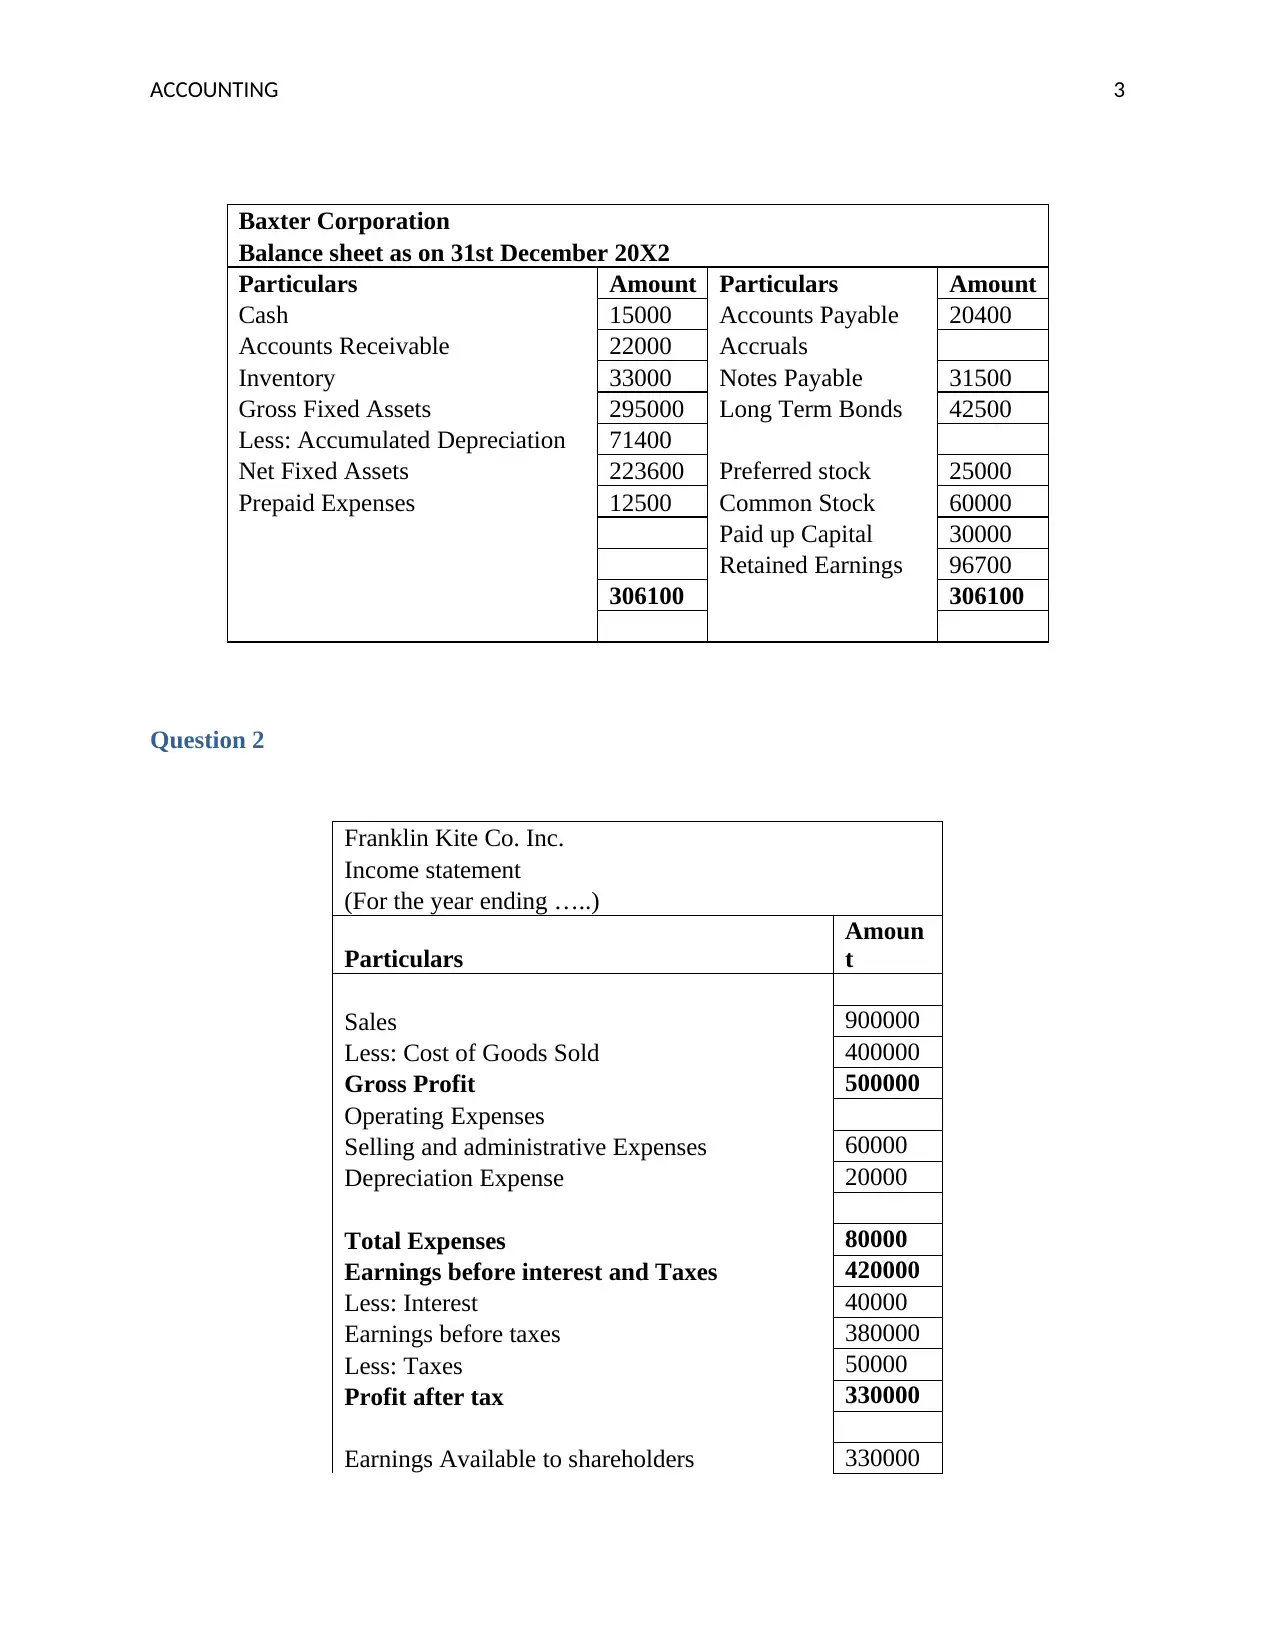
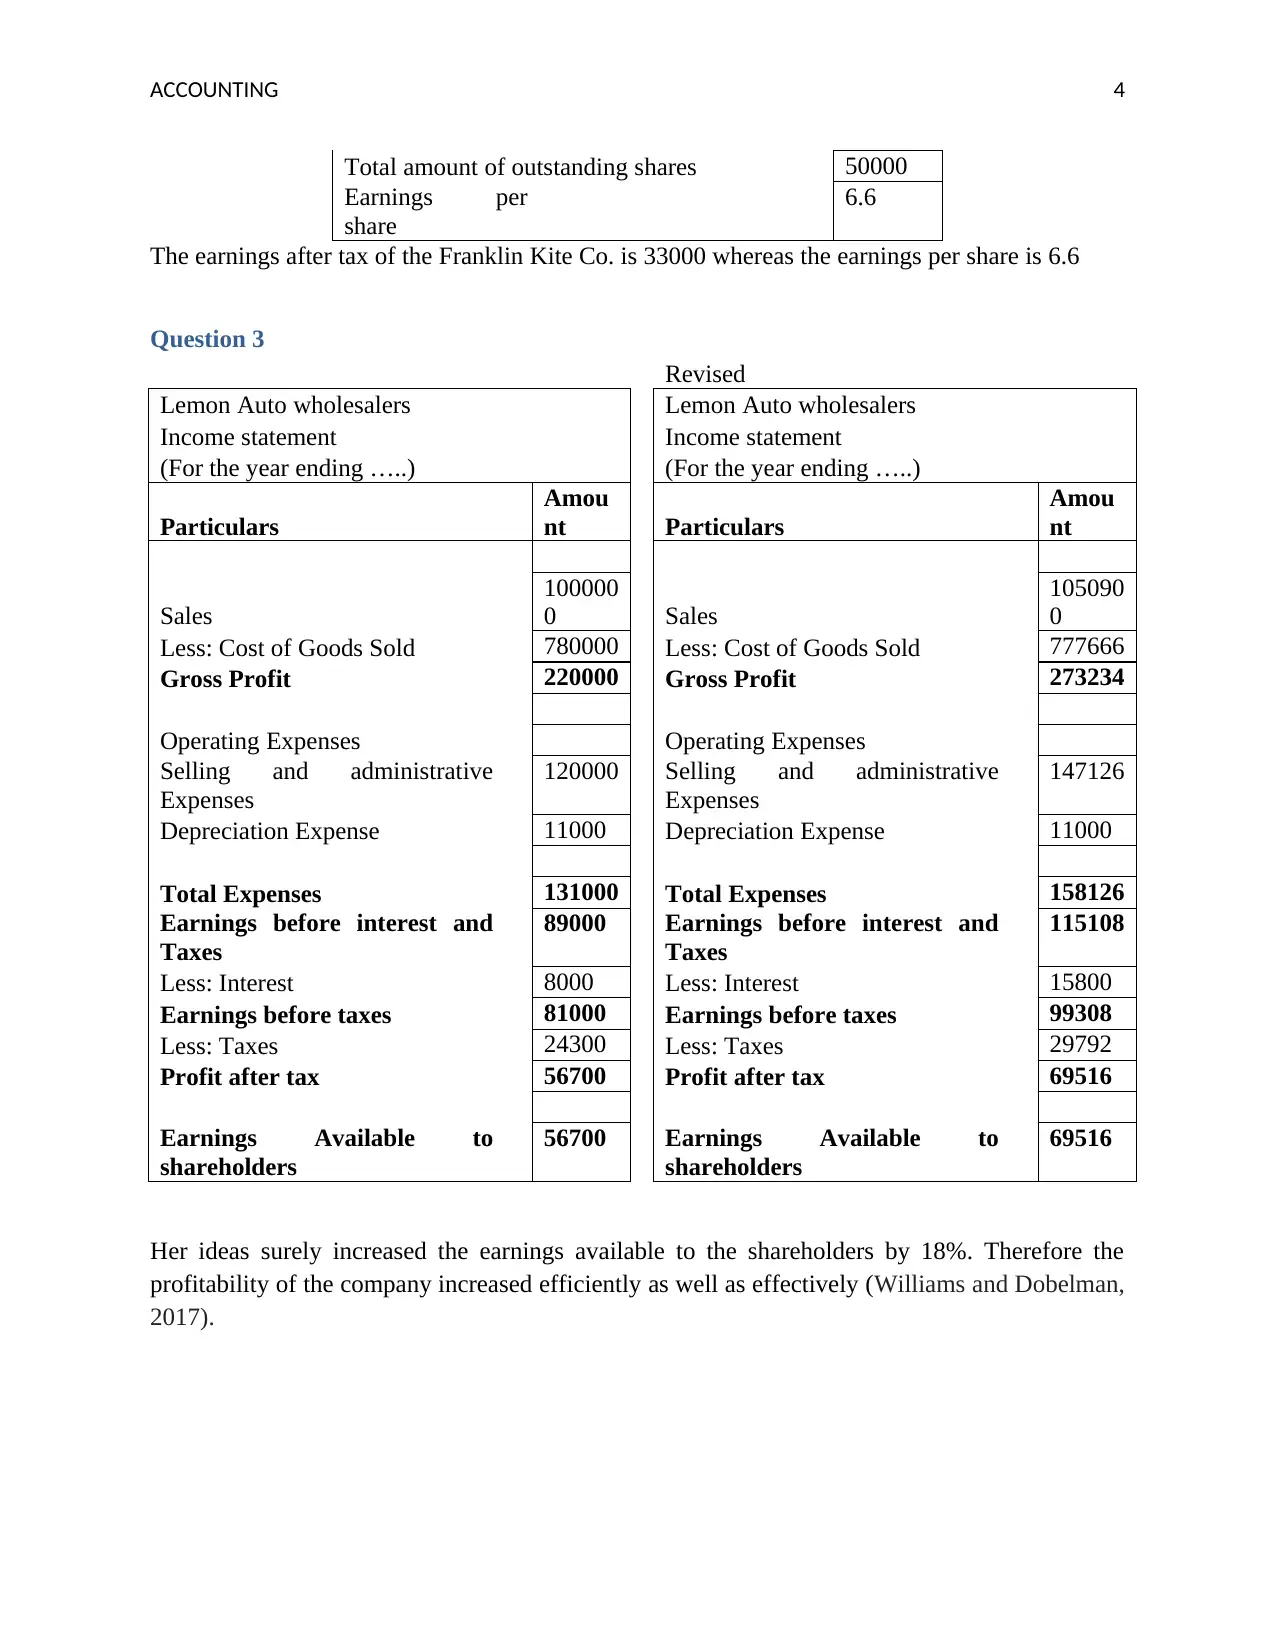
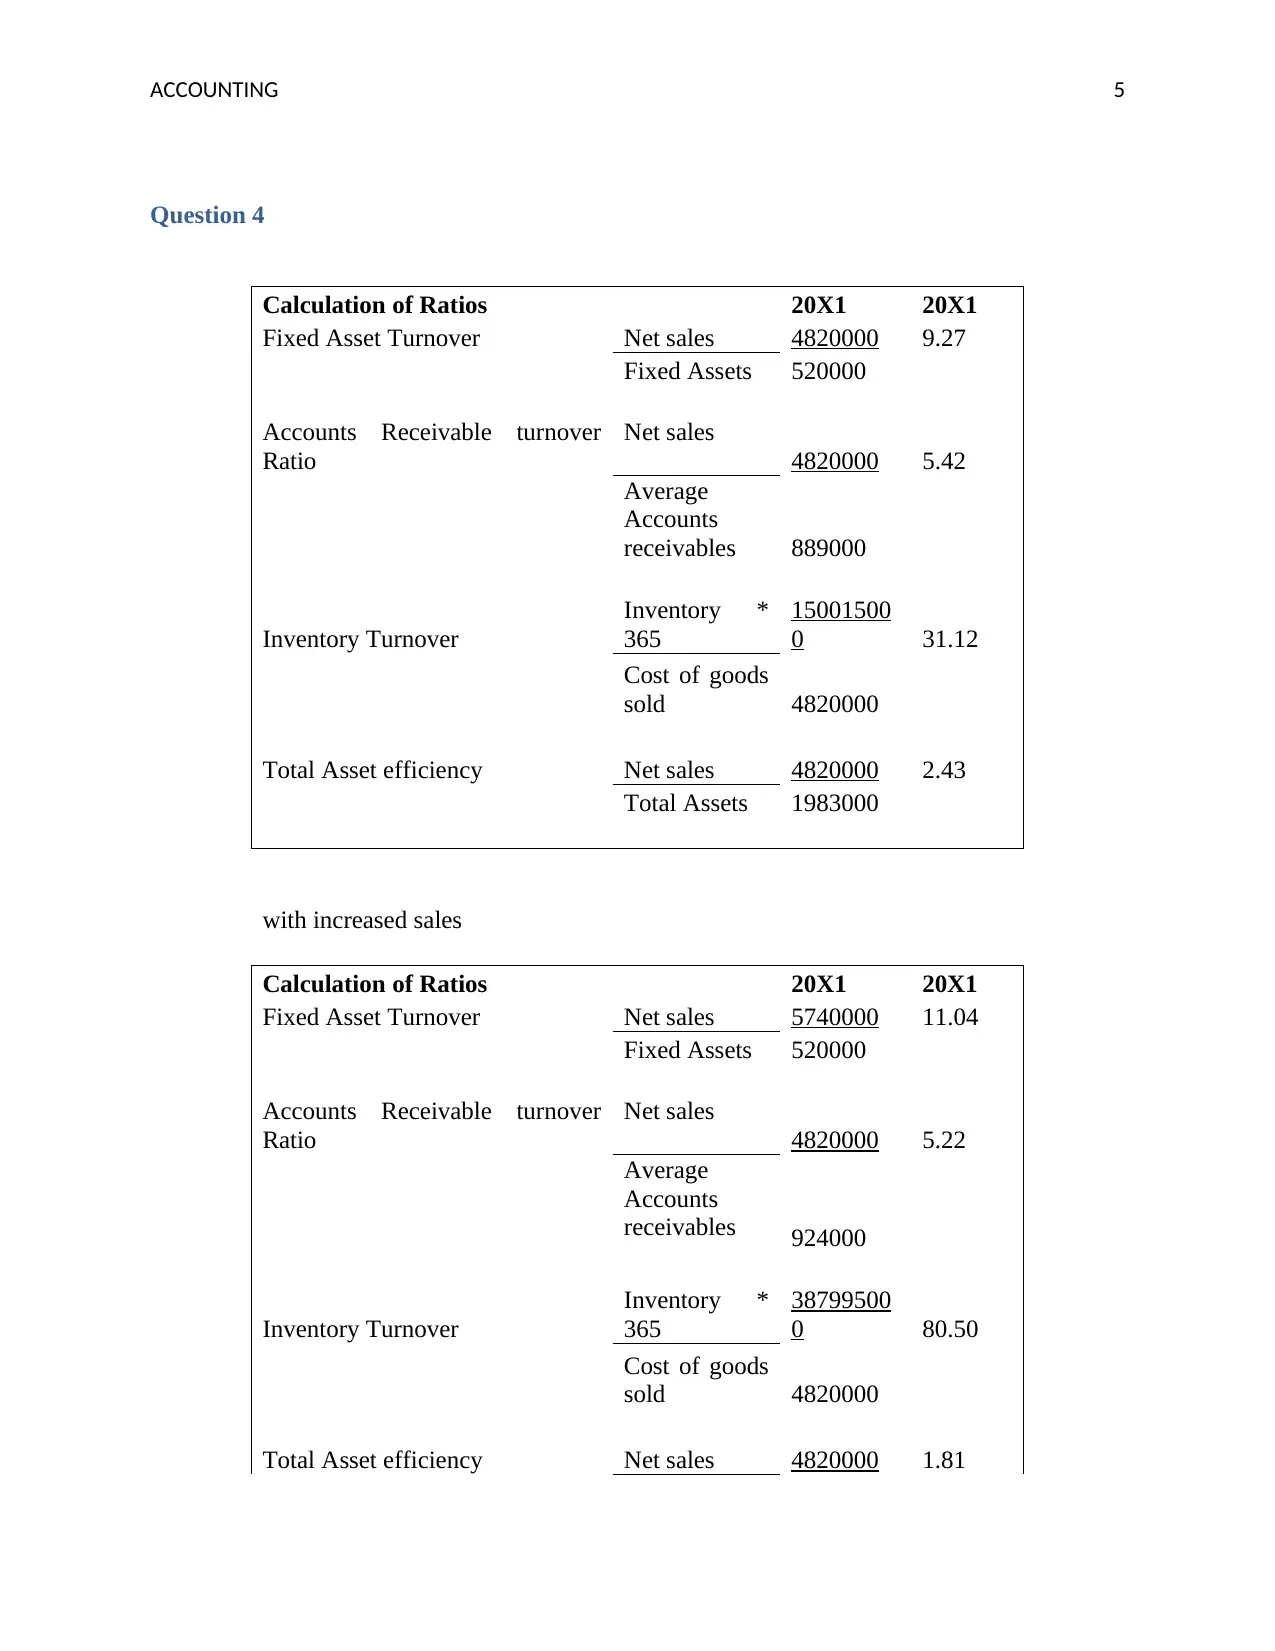
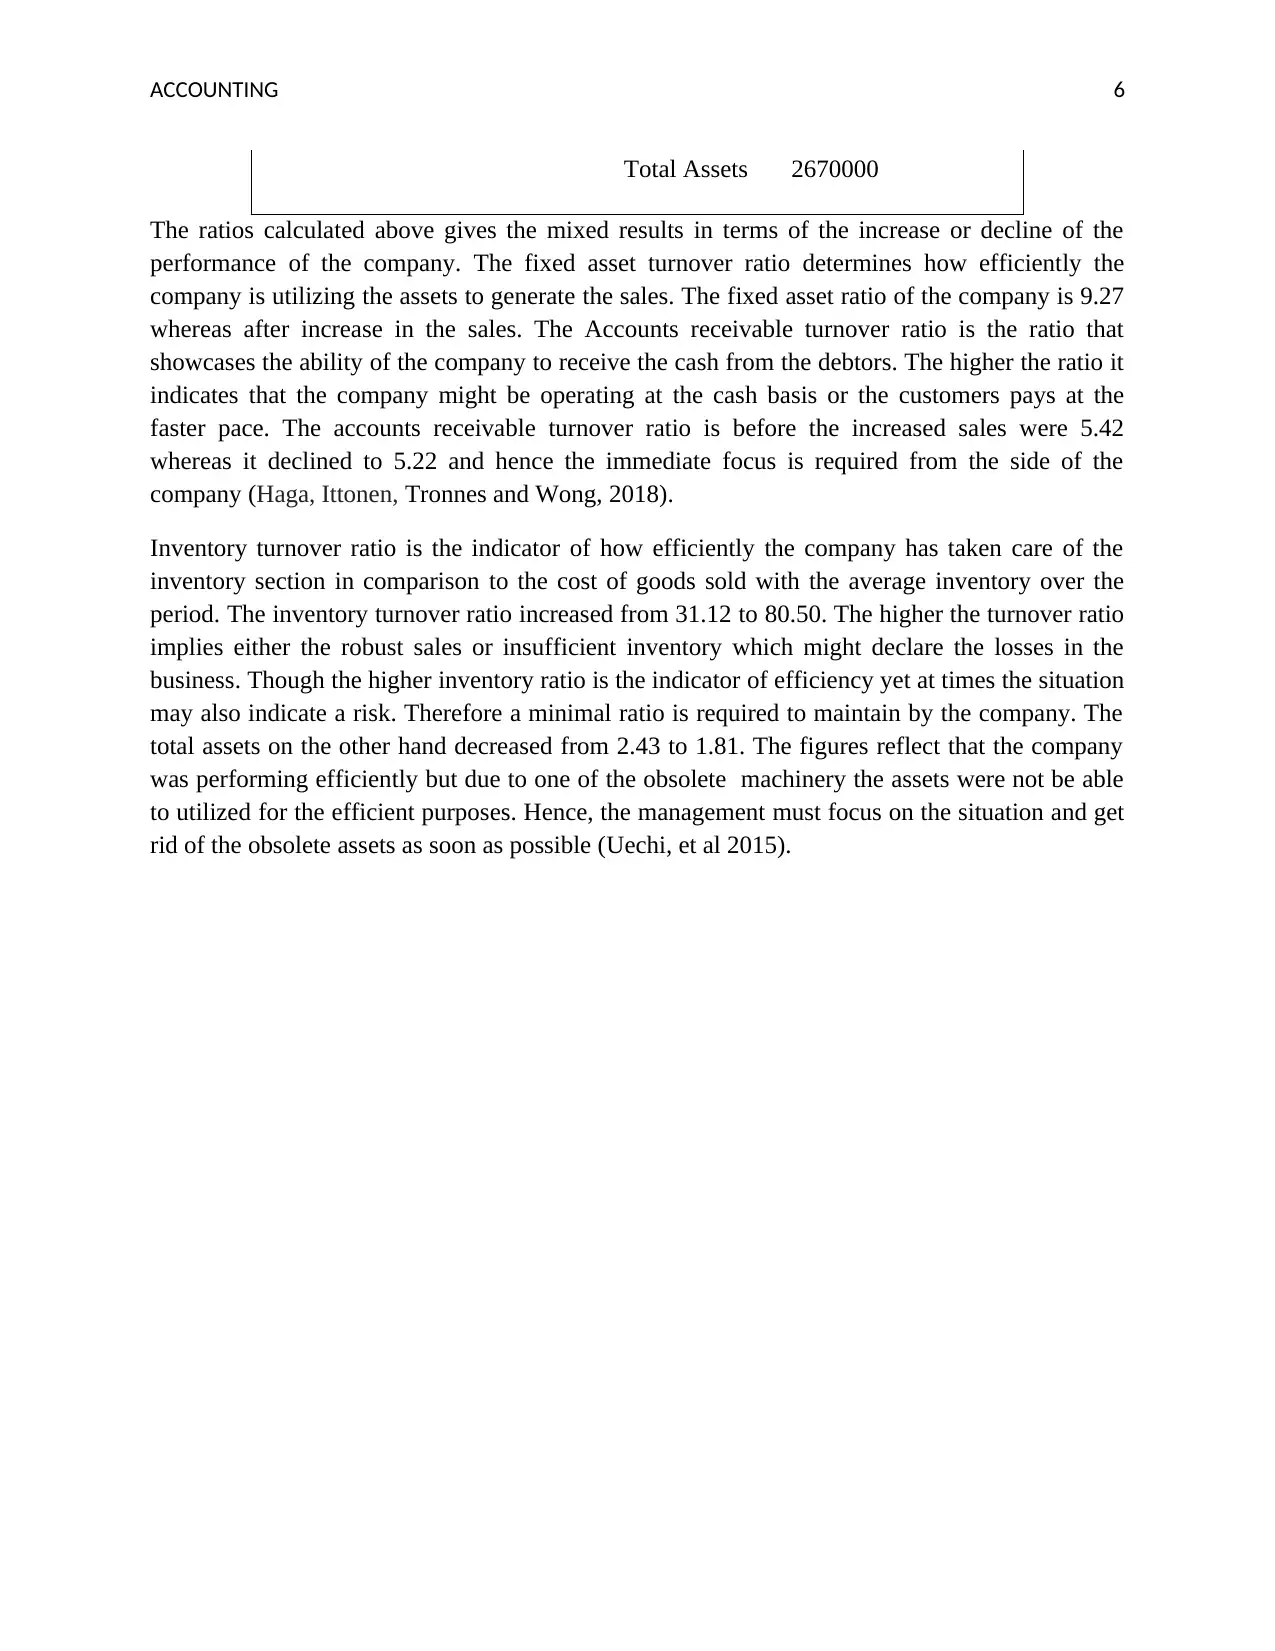
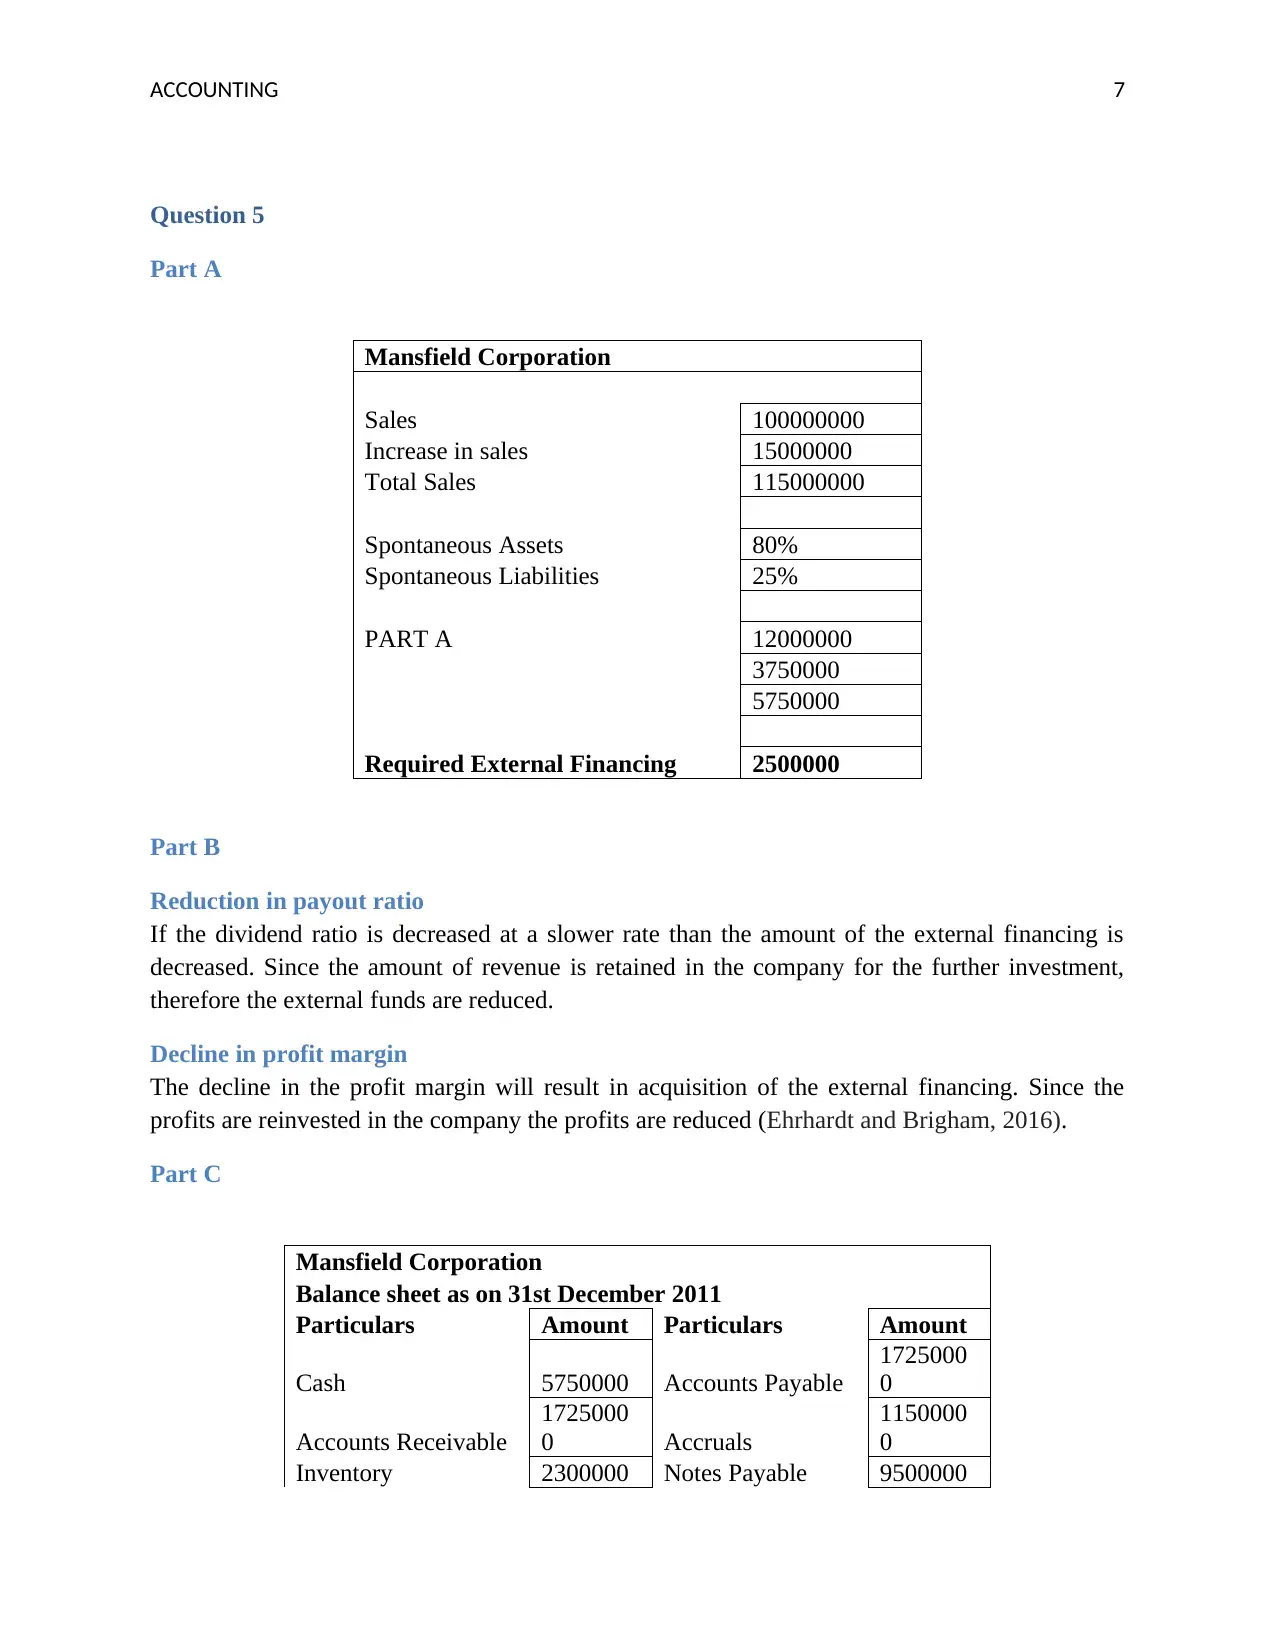
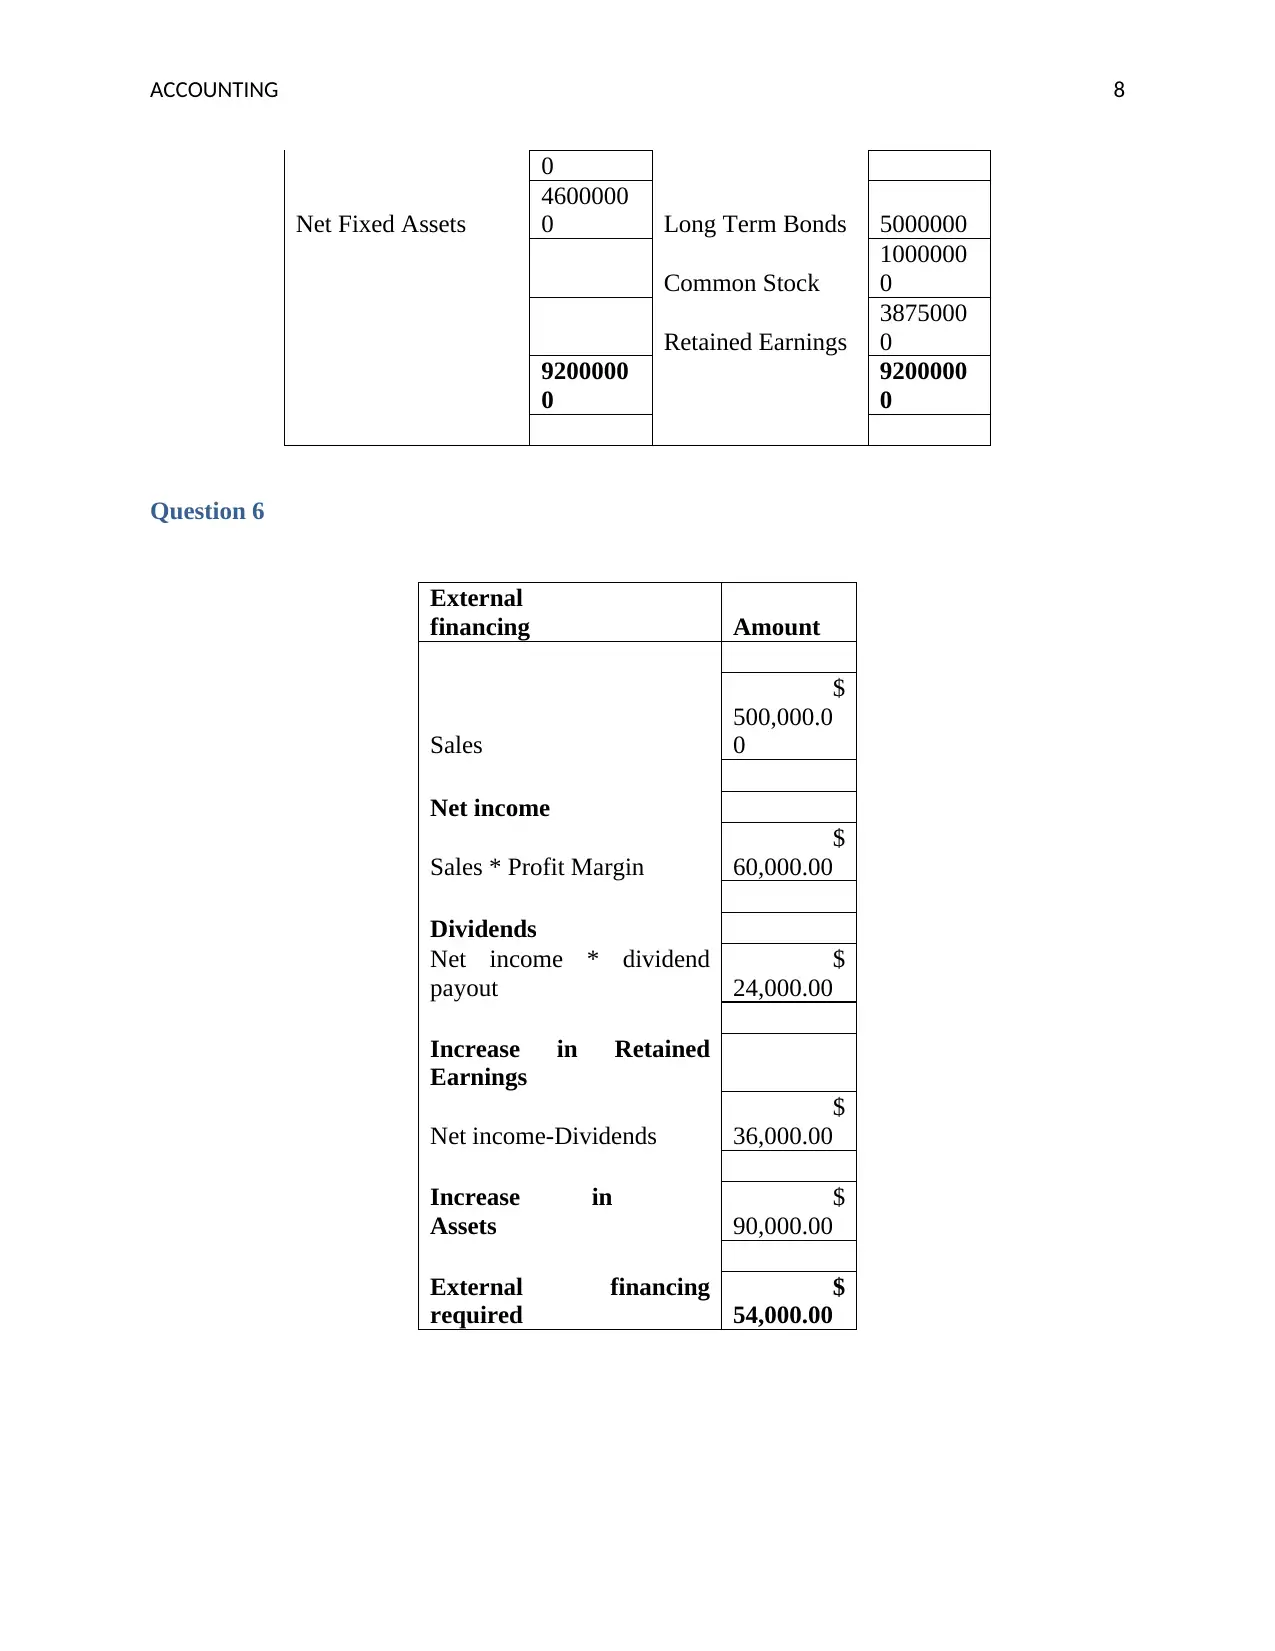
This accounting assignment provides comprehensive solutions to various financial analysis problems. It begins with the analysis of Baxter Corporation's financial statements, including the income statement, statement of retained earnings, and balance sheet for the year 20X2. The assignment then delves into the income statement and earnings per share calculations for Franklin Kite Co. Inc. The next section analyzes Lemon Auto wholesalers' income statements, comparing the results before and after implementing suggested changes. The core of the assignment involves the calculation and interpretation of key financial ratios, such as fixed asset turnover, accounts receivable turnover, inventory turnover, and total asset efficiency, for two different years. Further, the assignment explores the impact of changes in sales, spontaneous assets, and liabilities on external financing needs using the example of Mansfield Corporation. Finally, the assignment addresses the external financing requirements based on changes in sales and profit margin. The provided solution thoroughly addresses all the questions, demonstrating a strong understanding of accounting principles and financial statement analysis.

Running Head: ACCOUNTING 0
Accounting
Accounting
Paraphrase This Document
Need a fresh take? Get an instant paraphrase of this document with our AI Paraphraser

ACCOUNTING 1
Contents
Question 1........................................................................................................................................2
Question 2........................................................................................................................................3
Question 3........................................................................................................................................4
Question 4........................................................................................................................................5
Question 5........................................................................................................................................7
Part A...........................................................................................................................................7
Part B............................................................................................................................................7
Reduction in payout ratio.........................................................................................................7
Decline in profit margin...........................................................................................................7
Part C............................................................................................................................................7
Question 6........................................................................................................................................8
References........................................................................................................................................9

ACCOUNTING 2
Question 1
Baxter corporation Limited INCOME STATEMENT
20X2
Revenue 245000
Cost of revenue 147000
Gross profit 98000
Operating expenses
Sales, General and administrative 24500
Other operating expenses 20400
Total operating expenses 44900
Operating income 53100
Interest Expense 9100
Other income (expense)
Income before taxes 44000
Provision for income taxes 8800
Net income from continuing operations 35200
Less: Preferred stock dividends 2500
Net income available to common shareholders 32700
Shares outstanding 10000
Earnings per share 3.27
Notes
Depreciation
Plant and Equipment Gross 255000
Depreciation 20400
Interest
Notes payable 25000 2500
Bonds Payable 55000 6600
Statement of Retained Earnings
Amoun
t
Retained Earnings Balance January 1, 20X1 69500
Add: Earnings available to common stockholders 20X2 32700
Less: Cash Dividend declared 5500
Retained Earnings balance, December 20X2 96700
⊘ This is a preview!⊘
Do you want full access?
Subscribe today to unlock all pages.

Trusted by 1+ million students worldwide

ACCOUNTING 3
Baxter Corporation
Balance sheet as on 31st December 20X2
Particulars Amount Particulars Amount
Cash 15000 Accounts Payable 20400
Accounts Receivable 22000 Accruals
Inventory 33000 Notes Payable 31500
Gross Fixed Assets 295000 Long Term Bonds 42500
Less: Accumulated Depreciation 71400
Net Fixed Assets 223600 Preferred stock 25000
Prepaid Expenses 12500 Common Stock 60000
Paid up Capital 30000
Retained Earnings 96700
306100 306100
Question 2
Franklin Kite Co. Inc.
Income statement
(For the year ending …..)
Particulars
Amoun
t
Sales 900000
Less: Cost of Goods Sold 400000
Gross Profit 500000
Operating Expenses
Selling and administrative Expenses 60000
Depreciation Expense 20000
Total Expenses 80000
Earnings before interest and Taxes 420000
Less: Interest 40000
Earnings before taxes 380000
Less: Taxes 50000
Profit after tax 330000
Earnings Available to shareholders 330000
Paraphrase This Document
Need a fresh take? Get an instant paraphrase of this document with our AI Paraphraser

ACCOUNTING 4
Total amount of outstanding shares 50000
Earnings per
share
6.6
The earnings after tax of the Franklin Kite Co. is 33000 whereas the earnings per share is 6.6
Question 3
Revised
Lemon Auto wholesalers Lemon Auto wholesalers
Income statement Income statement
(For the year ending …..) (For the year ending …..)
Particulars
Amou
nt Particulars
Amou
nt
Sales
100000
0 Sales
105090
0
Less: Cost of Goods Sold 780000 Less: Cost of Goods Sold 777666
Gross Profit 220000 Gross Profit 273234
Operating Expenses Operating Expenses
Selling and administrative
Expenses
120000 Selling and administrative
Expenses
147126
Depreciation Expense 11000 Depreciation Expense 11000
Total Expenses 131000 Total Expenses 158126
Earnings before interest and
Taxes
89000 Earnings before interest and
Taxes
115108
Less: Interest 8000 Less: Interest 15800
Earnings before taxes 81000 Earnings before taxes 99308
Less: Taxes 24300 Less: Taxes 29792
Profit after tax 56700 Profit after tax 69516
Earnings Available to
shareholders
56700 Earnings Available to
shareholders
69516
Her ideas surely increased the earnings available to the shareholders by 18%. Therefore the
profitability of the company increased efficiently as well as effectively (Williams and Dobelman,
2017).

ACCOUNTING 5
Question 4
Calculation of Ratios 20X1 20X1
Fixed Asset Turnover Net sales 4820000 9.27
Fixed Assets 520000
Accounts Receivable turnover
Ratio
Net sales
4820000 5.42
Average
Accounts
receivables 889000
Inventory Turnover
Inventory *
365
15001500
0 31.12
Cost of goods
sold 4820000
Total Asset efficiency Net sales 4820000 2.43
Total Assets 1983000
with increased sales
Calculation of Ratios 20X1 20X1
Fixed Asset Turnover Net sales 5740000 11.04
Fixed Assets 520000
Accounts Receivable turnover
Ratio
Net sales
4820000 5.22
Average
Accounts
receivables 924000
Inventory Turnover
Inventory *
365
38799500
0 80.50
Cost of goods
sold 4820000
Total Asset efficiency Net sales 4820000 1.81
⊘ This is a preview!⊘
Do you want full access?
Subscribe today to unlock all pages.

Trusted by 1+ million students worldwide

ACCOUNTING 6
Total Assets 2670000
The ratios calculated above gives the mixed results in terms of the increase or decline of the
performance of the company. The fixed asset turnover ratio determines how efficiently the
company is utilizing the assets to generate the sales. The fixed asset ratio of the company is 9.27
whereas after increase in the sales. The Accounts receivable turnover ratio is the ratio that
showcases the ability of the company to receive the cash from the debtors. The higher the ratio it
indicates that the company might be operating at the cash basis or the customers pays at the
faster pace. The accounts receivable turnover ratio is before the increased sales were 5.42
whereas it declined to 5.22 and hence the immediate focus is required from the side of the
company (Haga, Ittonen, Tronnes and Wong, 2018).
Inventory turnover ratio is the indicator of how efficiently the company has taken care of the
inventory section in comparison to the cost of goods sold with the average inventory over the
period. The inventory turnover ratio increased from 31.12 to 80.50. The higher the turnover ratio
implies either the robust sales or insufficient inventory which might declare the losses in the
business. Though the higher inventory ratio is the indicator of efficiency yet at times the situation
may also indicate a risk. Therefore a minimal ratio is required to maintain by the company. The
total assets on the other hand decreased from 2.43 to 1.81. The figures reflect that the company
was performing efficiently but due to one of the obsolete machinery the assets were not be able
to utilized for the efficient purposes. Hence, the management must focus on the situation and get
rid of the obsolete assets as soon as possible (Uechi, et al 2015).
Paraphrase This Document
Need a fresh take? Get an instant paraphrase of this document with our AI Paraphraser

ACCOUNTING 7
Question 5
Part A
Mansfield Corporation
Sales 100000000
Increase in sales 15000000
Total Sales 115000000
Spontaneous Assets 80%
Spontaneous Liabilities 25%
PART A 12000000
3750000
5750000
Required External Financing 2500000
Part B
Reduction in payout ratio
If the dividend ratio is decreased at a slower rate than the amount of the external financing is
decreased. Since the amount of revenue is retained in the company for the further investment,
therefore the external funds are reduced.
Decline in profit margin
The decline in the profit margin will result in acquisition of the external financing. Since the
profits are reinvested in the company the profits are reduced (Ehrhardt and Brigham, 2016).
Part C
Mansfield Corporation
Balance sheet as on 31st December 2011
Particulars Amount Particulars Amount
Cash 5750000 Accounts Payable
1725000
0
Accounts Receivable
1725000
0 Accruals
1150000
0
Inventory 2300000 Notes Payable 9500000

ACCOUNTING 8
0
Net Fixed Assets
4600000
0 Long Term Bonds 5000000
Common Stock
1000000
0
Retained Earnings
3875000
0
9200000
0
9200000
0
Question 6
External
financing Amount
Sales
$
500,000.0
0
Net income
Sales * Profit Margin
$
60,000.00
Dividends
Net income * dividend
payout
$
24,000.00
Increase in Retained
Earnings
Net income-Dividends
$
36,000.00
Increase in
Assets
$
90,000.00
External financing
required
$
54,000.00
0
Net Fixed Assets
4600000
0 Long Term Bonds 5000000
Common Stock
1000000
0
Retained Earnings
3875000
0
9200000
0
9200000
0
Question 6
External
financing Amount
Sales
$
500,000.0
0
Net income
Sales * Profit Margin
$
60,000.00
Dividends
Net income * dividend
payout
$
24,000.00
Increase in Retained
Earnings
Net income-Dividends
$
36,000.00
Increase in
Assets
$
90,000.00
External financing
required
$
54,000.00
⊘ This is a preview!⊘
Do you want full access?
Subscribe today to unlock all pages.

Trusted by 1+ million students worldwide

ACCOUNTING 9
References
Ehrhardt, M.C. and Brigham, E.F., 2016. Corporate finance: A focused approach. Cengage
learning.
Haga, J., Ittonen, K., Tronnes, P.C. and Wong, L., 2018. Is earnings management sensitive to
discount rates?. Journal of Accounting Literature, 41, pp.75-88.
Uechi, L., Akutsu, T., Stanley, H.E., Marcus, A.J. and Kenett, D.Y., 2015. Sector dominance
ratio analysis of financial markets. Physica A: Statistical Mechanics and its Applications, 421,
pp.488-509.
Williams, E.E. and Dobelman, J.A., 2017. Financial statement analysis. World Scientific Book
Chapters, pp.109-169.
1 out of 10
Related Documents

Your All-in-One AI-Powered Toolkit for Academic Success.
 +13062052269
info@desklib.com
Available 24*7 on WhatsApp / Email
Unlock your academic potential
Copyright © 2020–2025 A2Z Services. All Rights Reserved. Developed and managed by ZUCOL.