Business Planning: Financial Statement Analysis and Performance
VerifiedAdded on 2023/06/12
|16
|3107
|171
Report
AI Summary
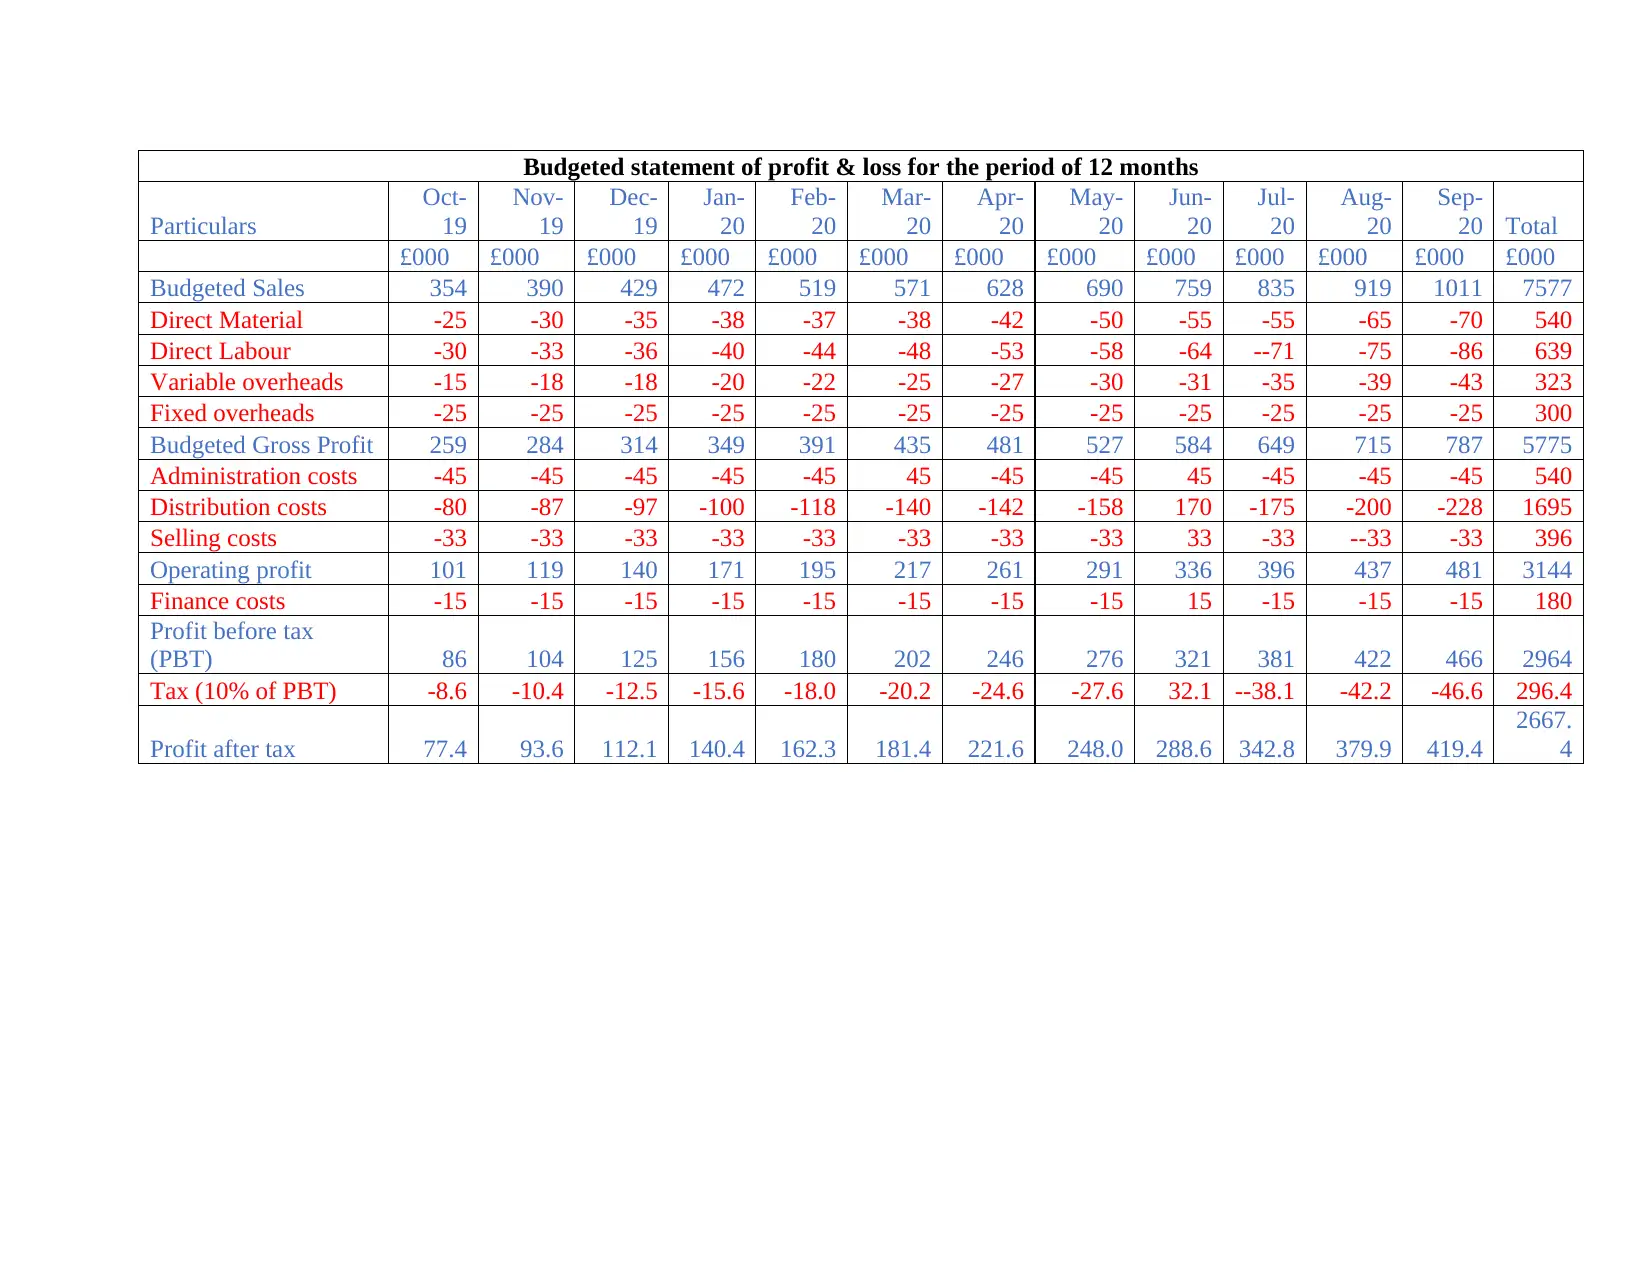
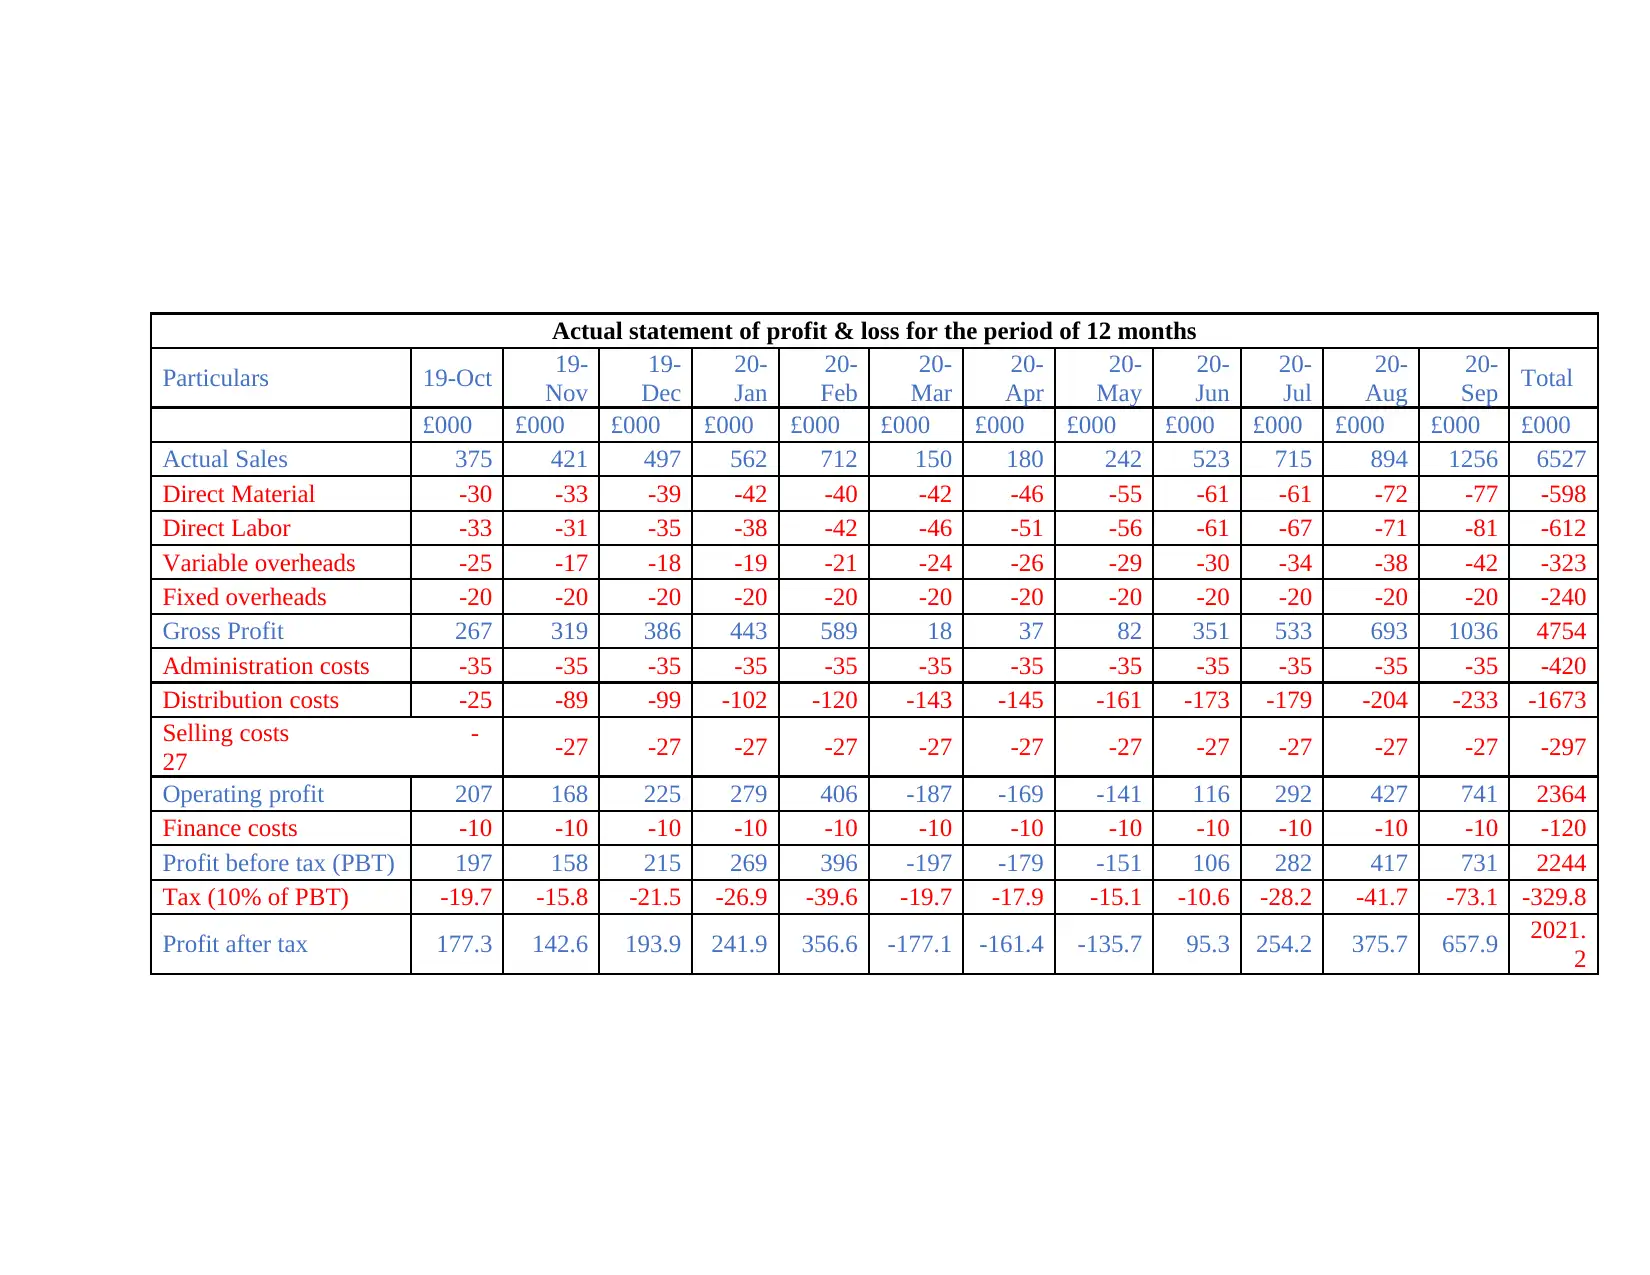
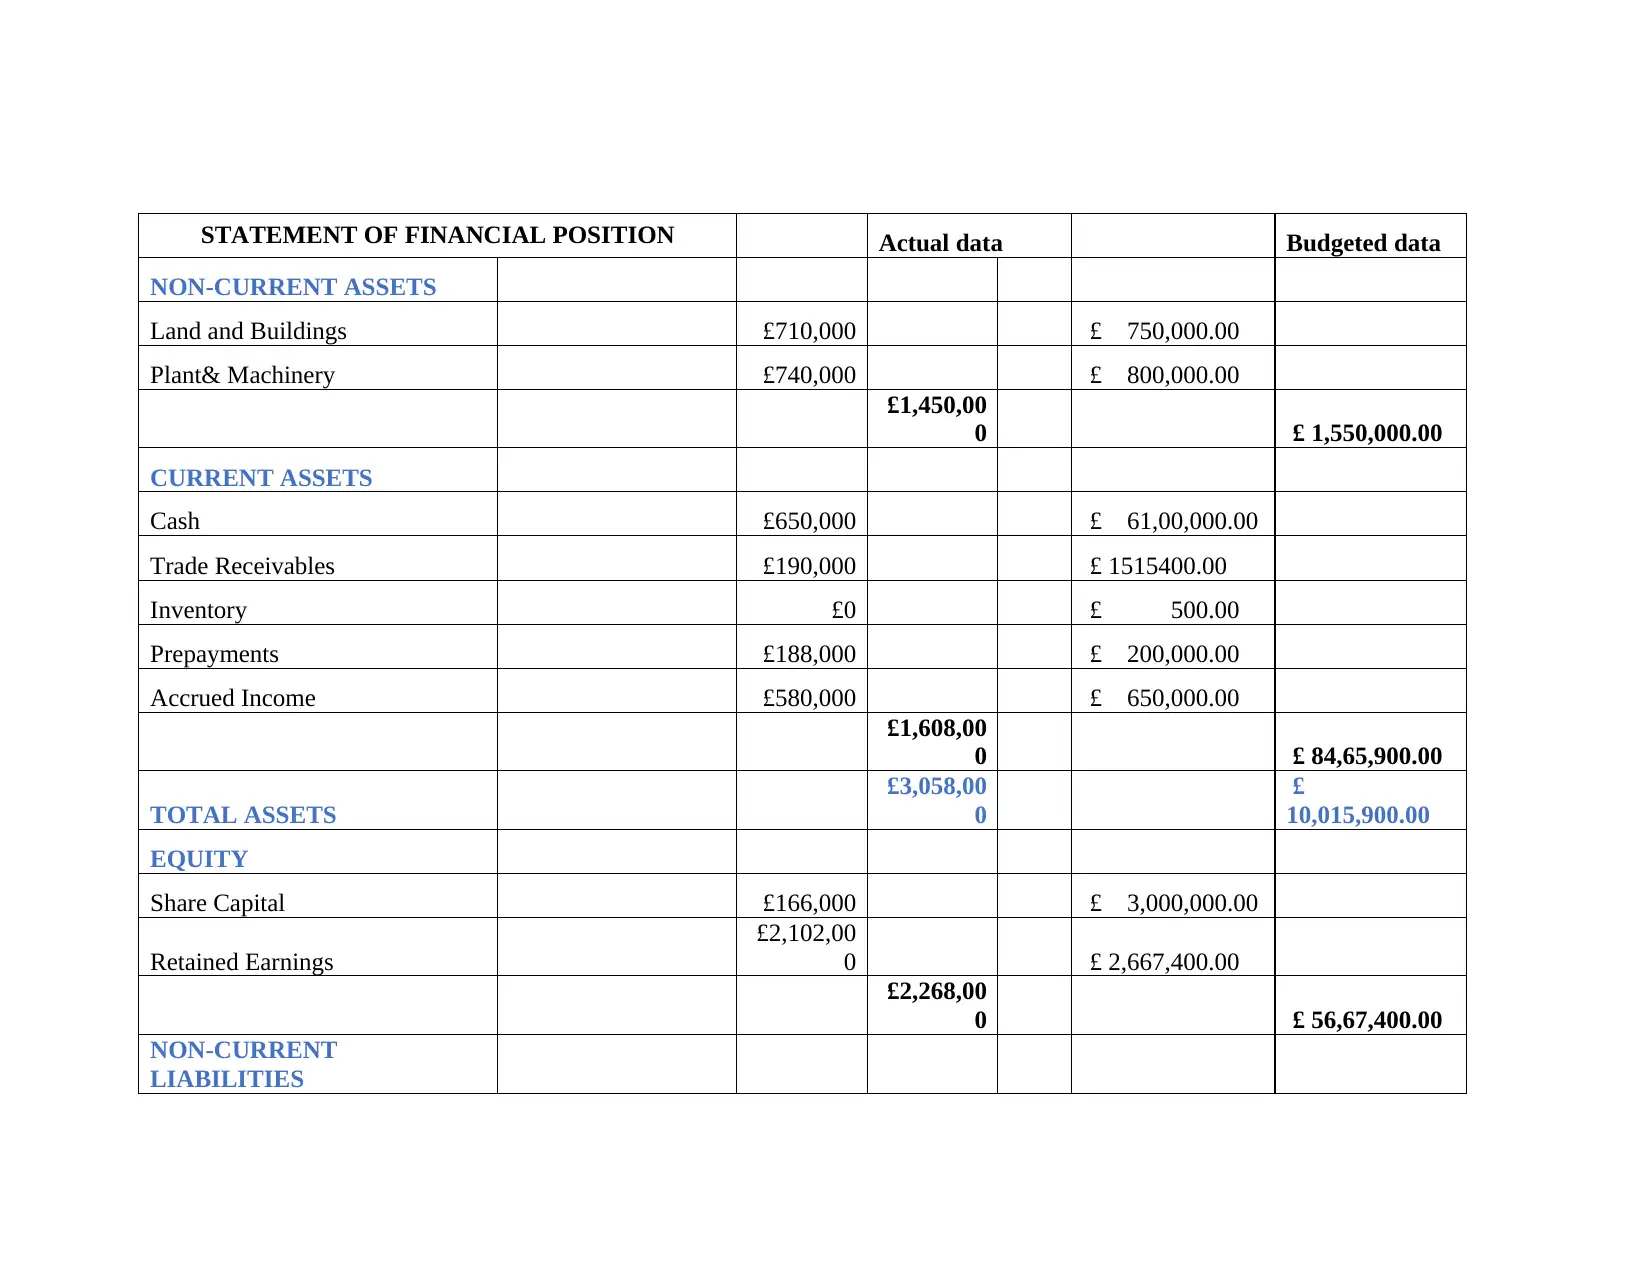
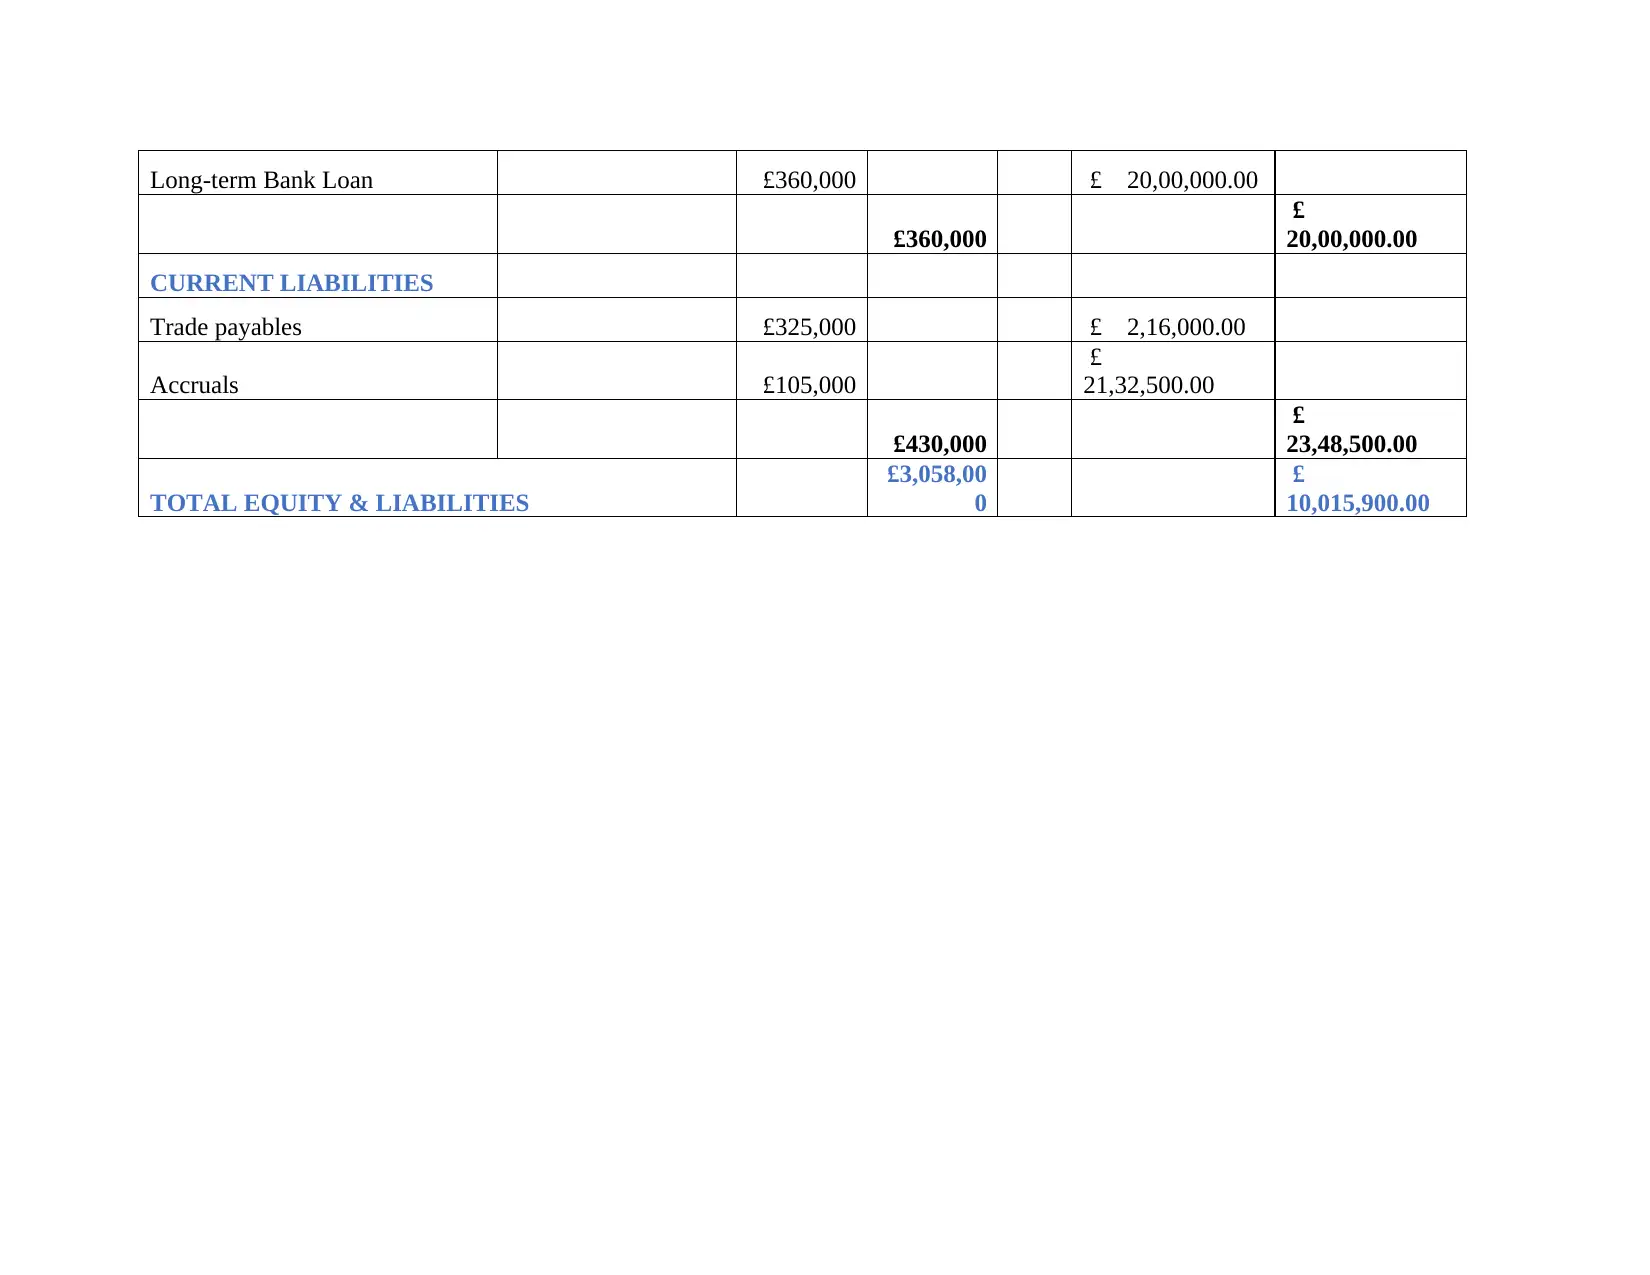
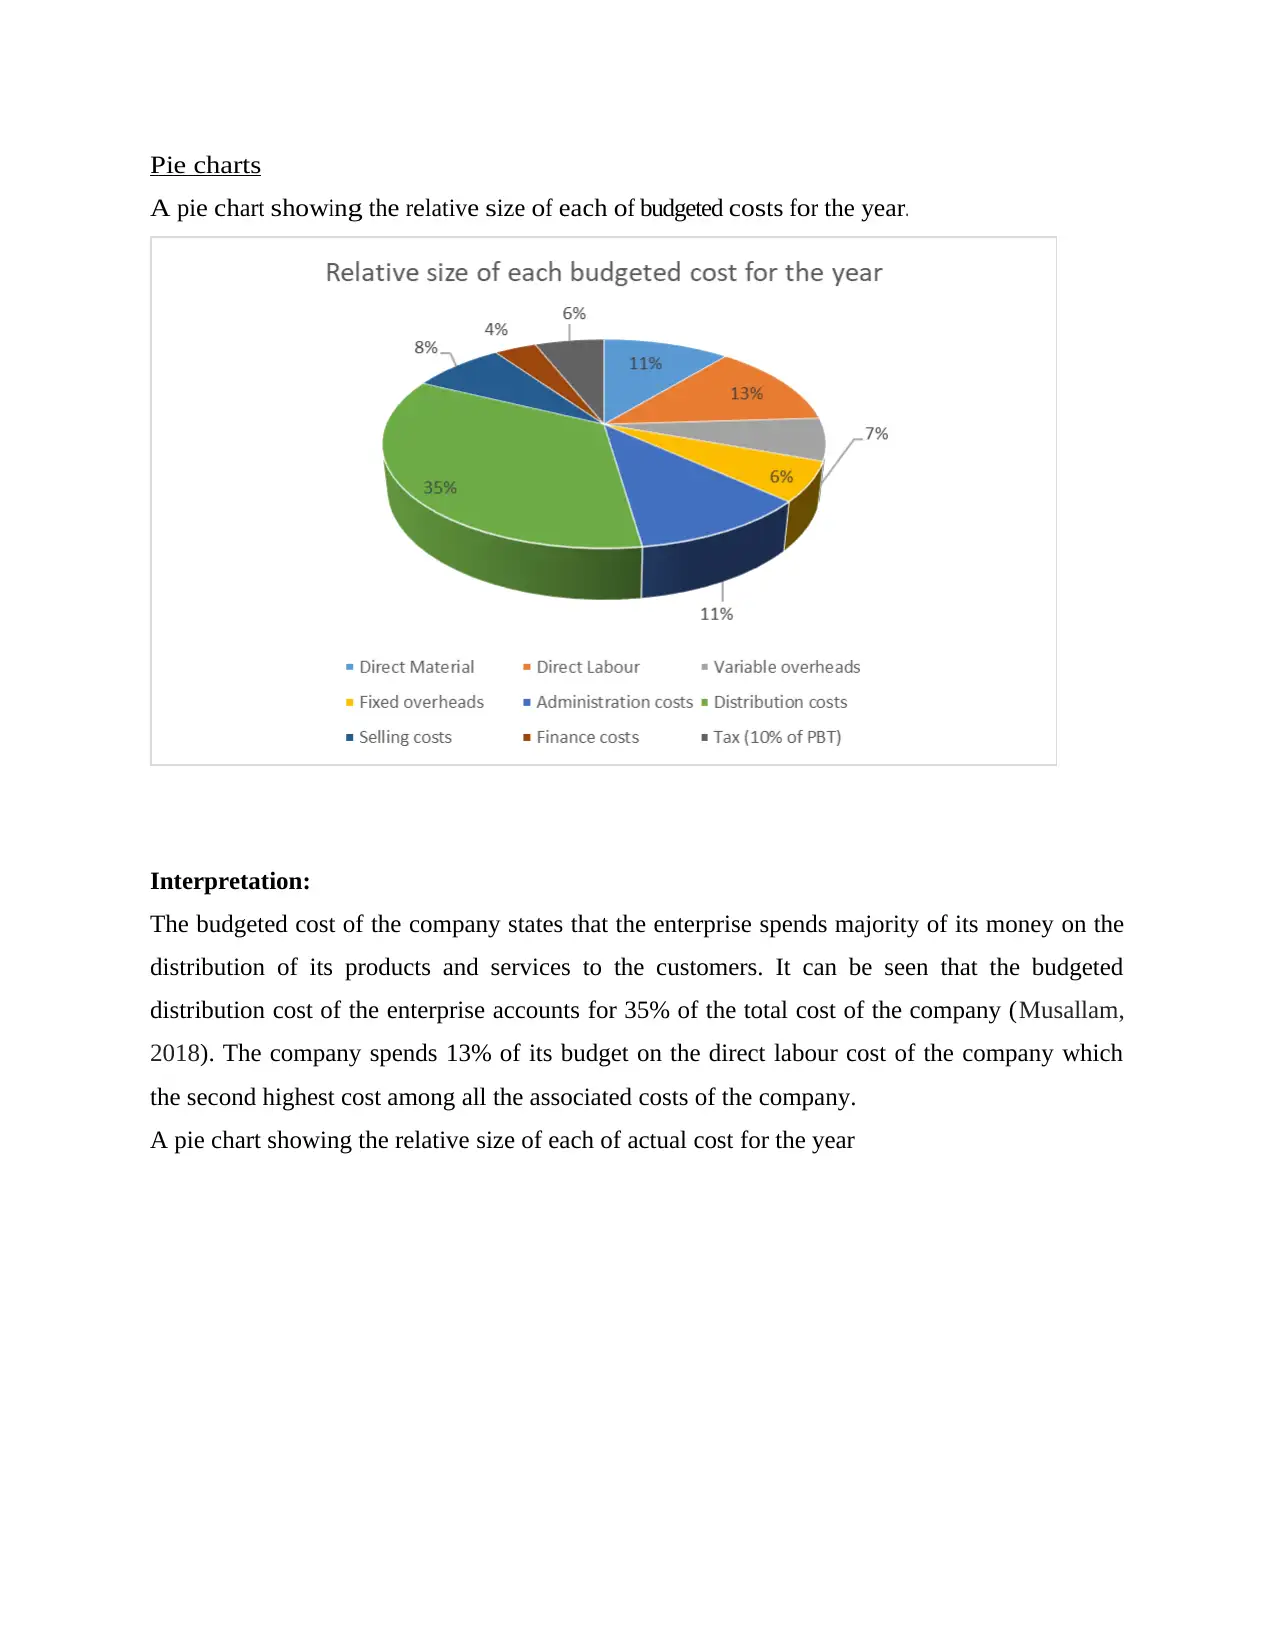
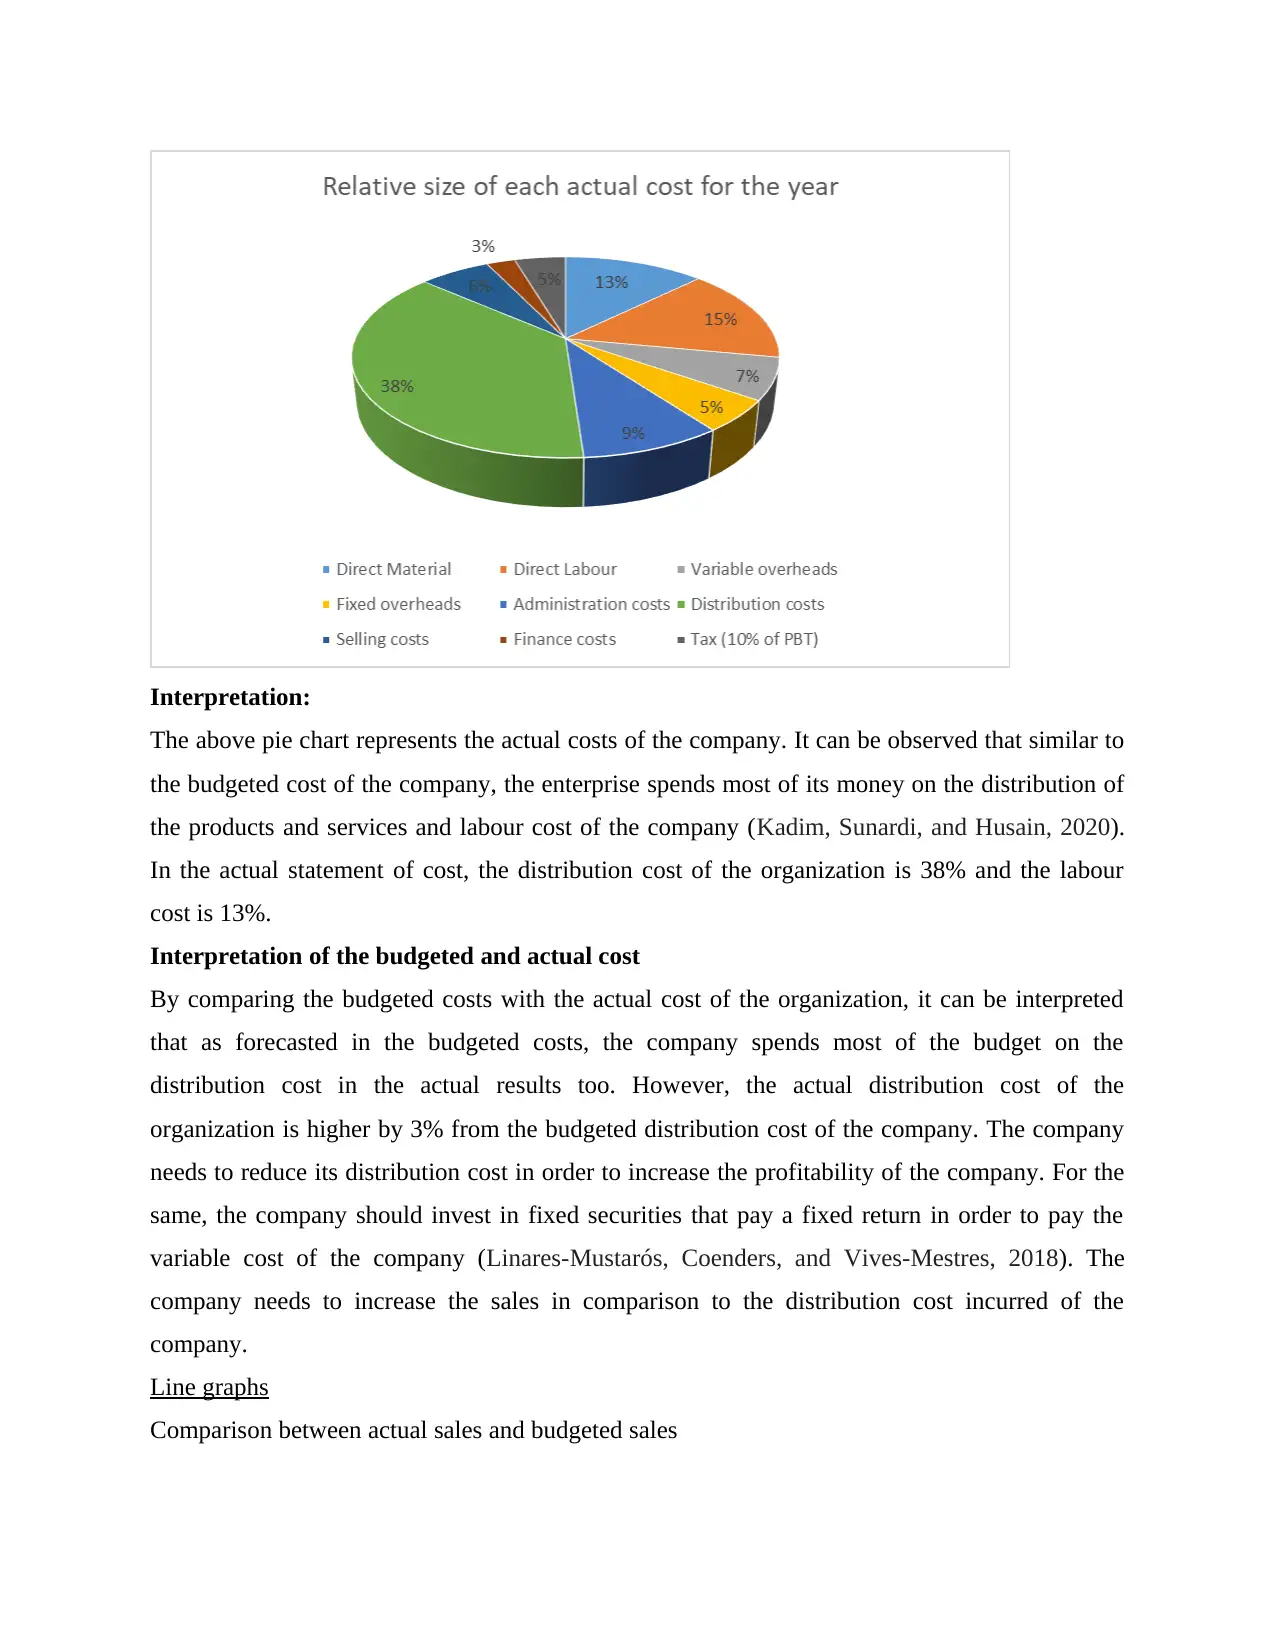
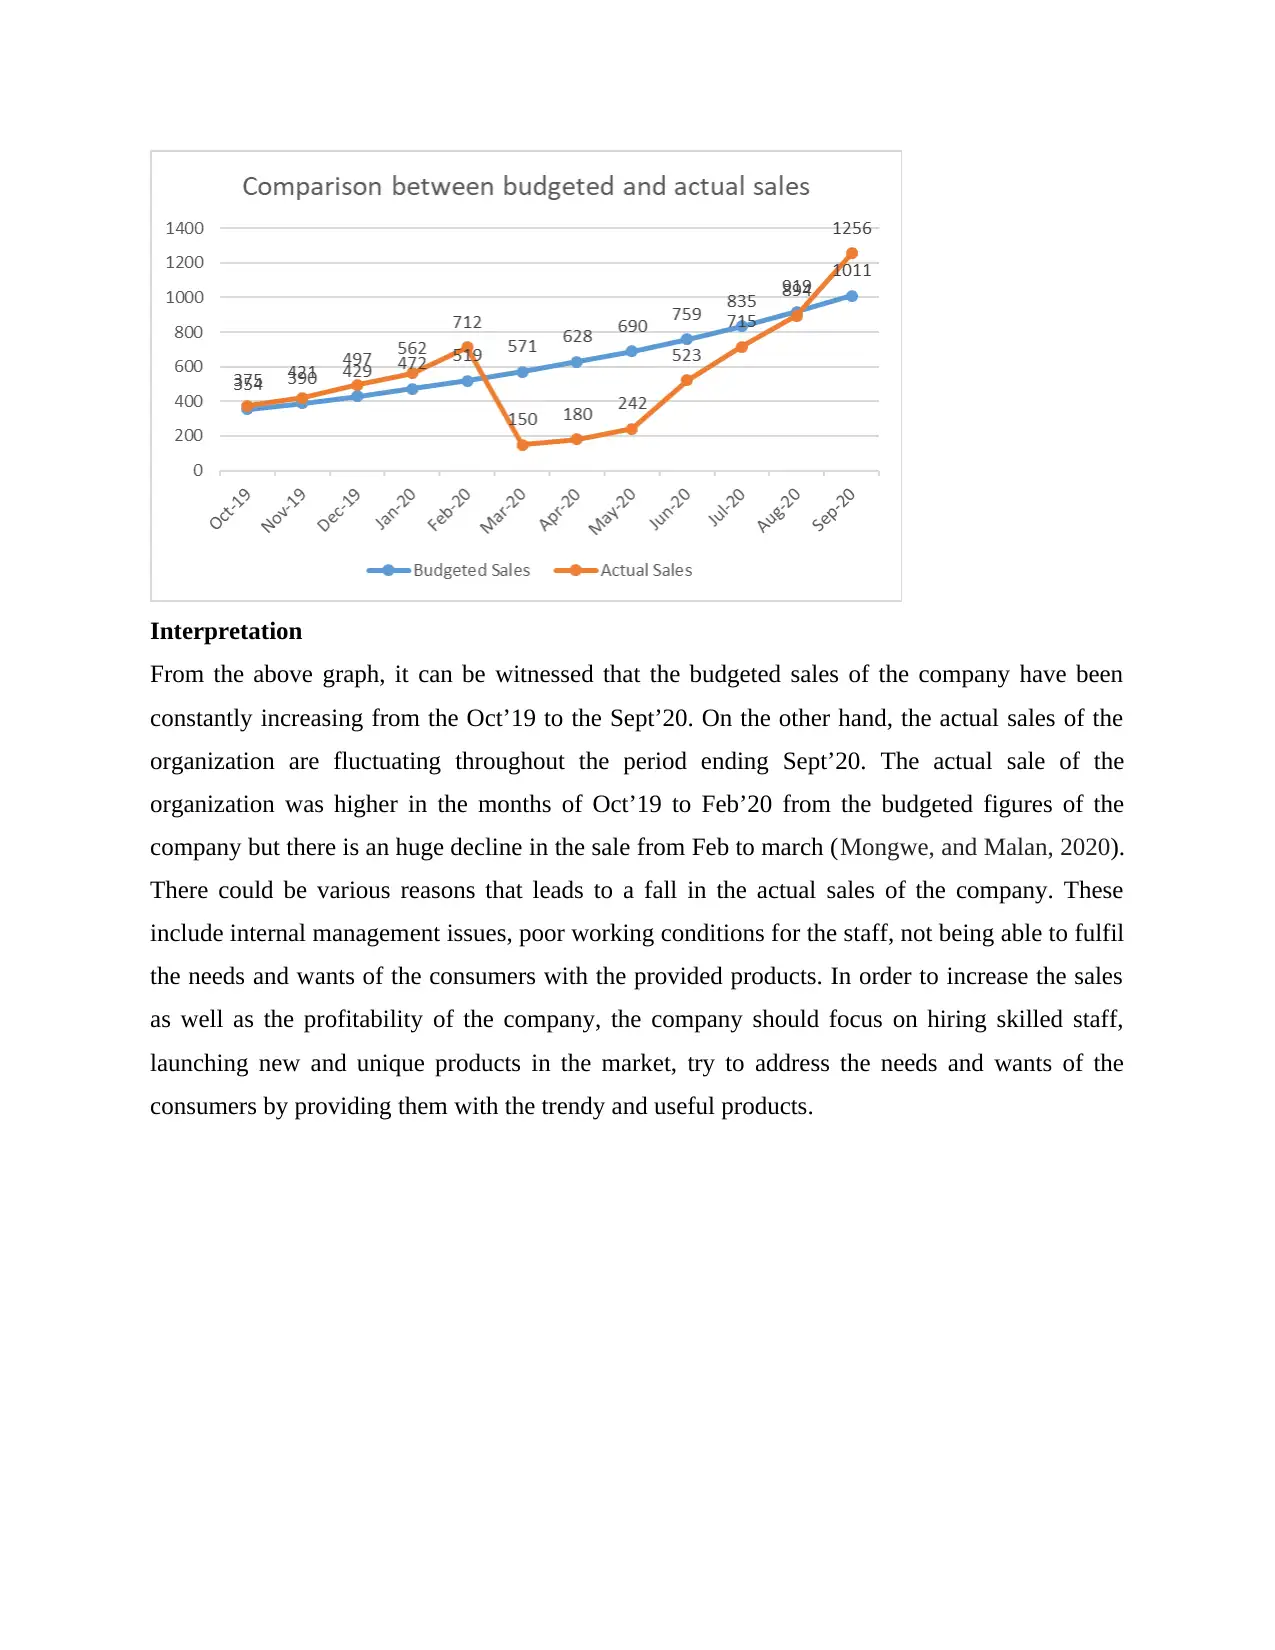
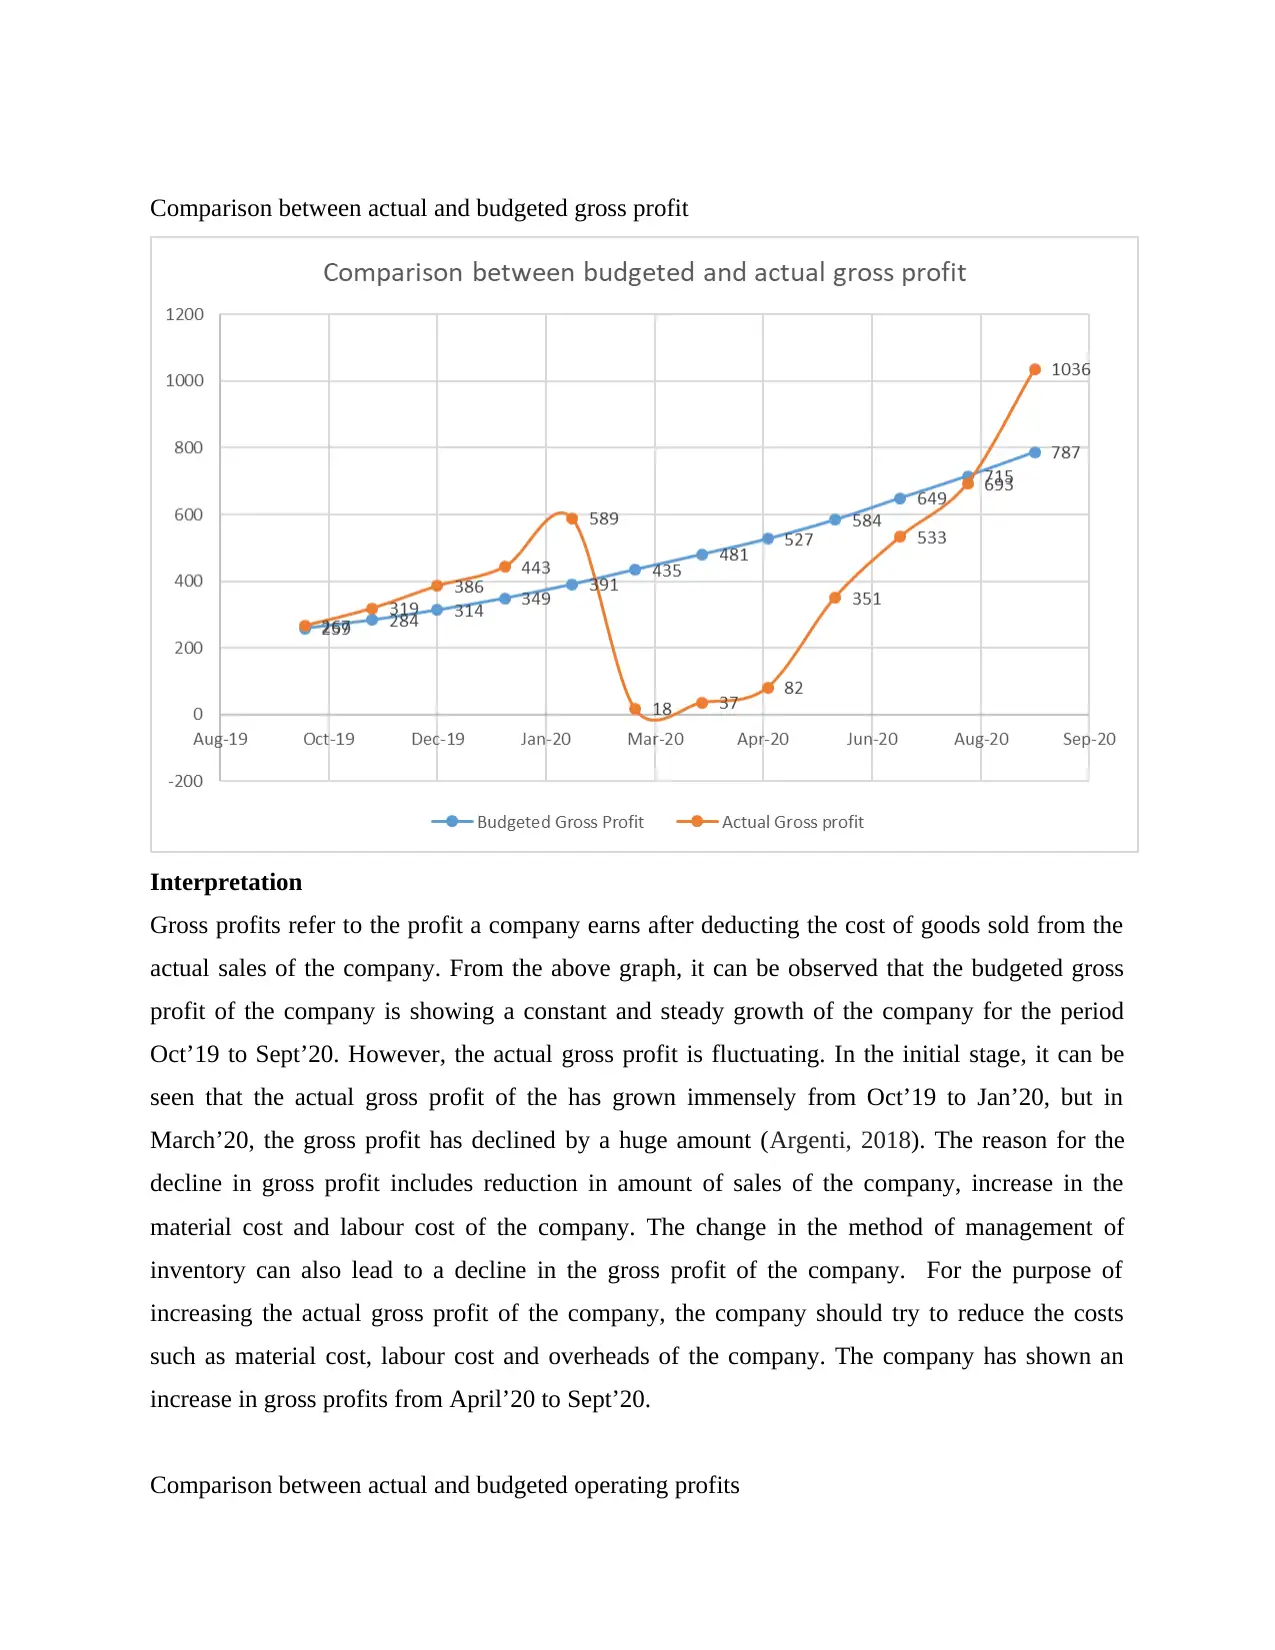
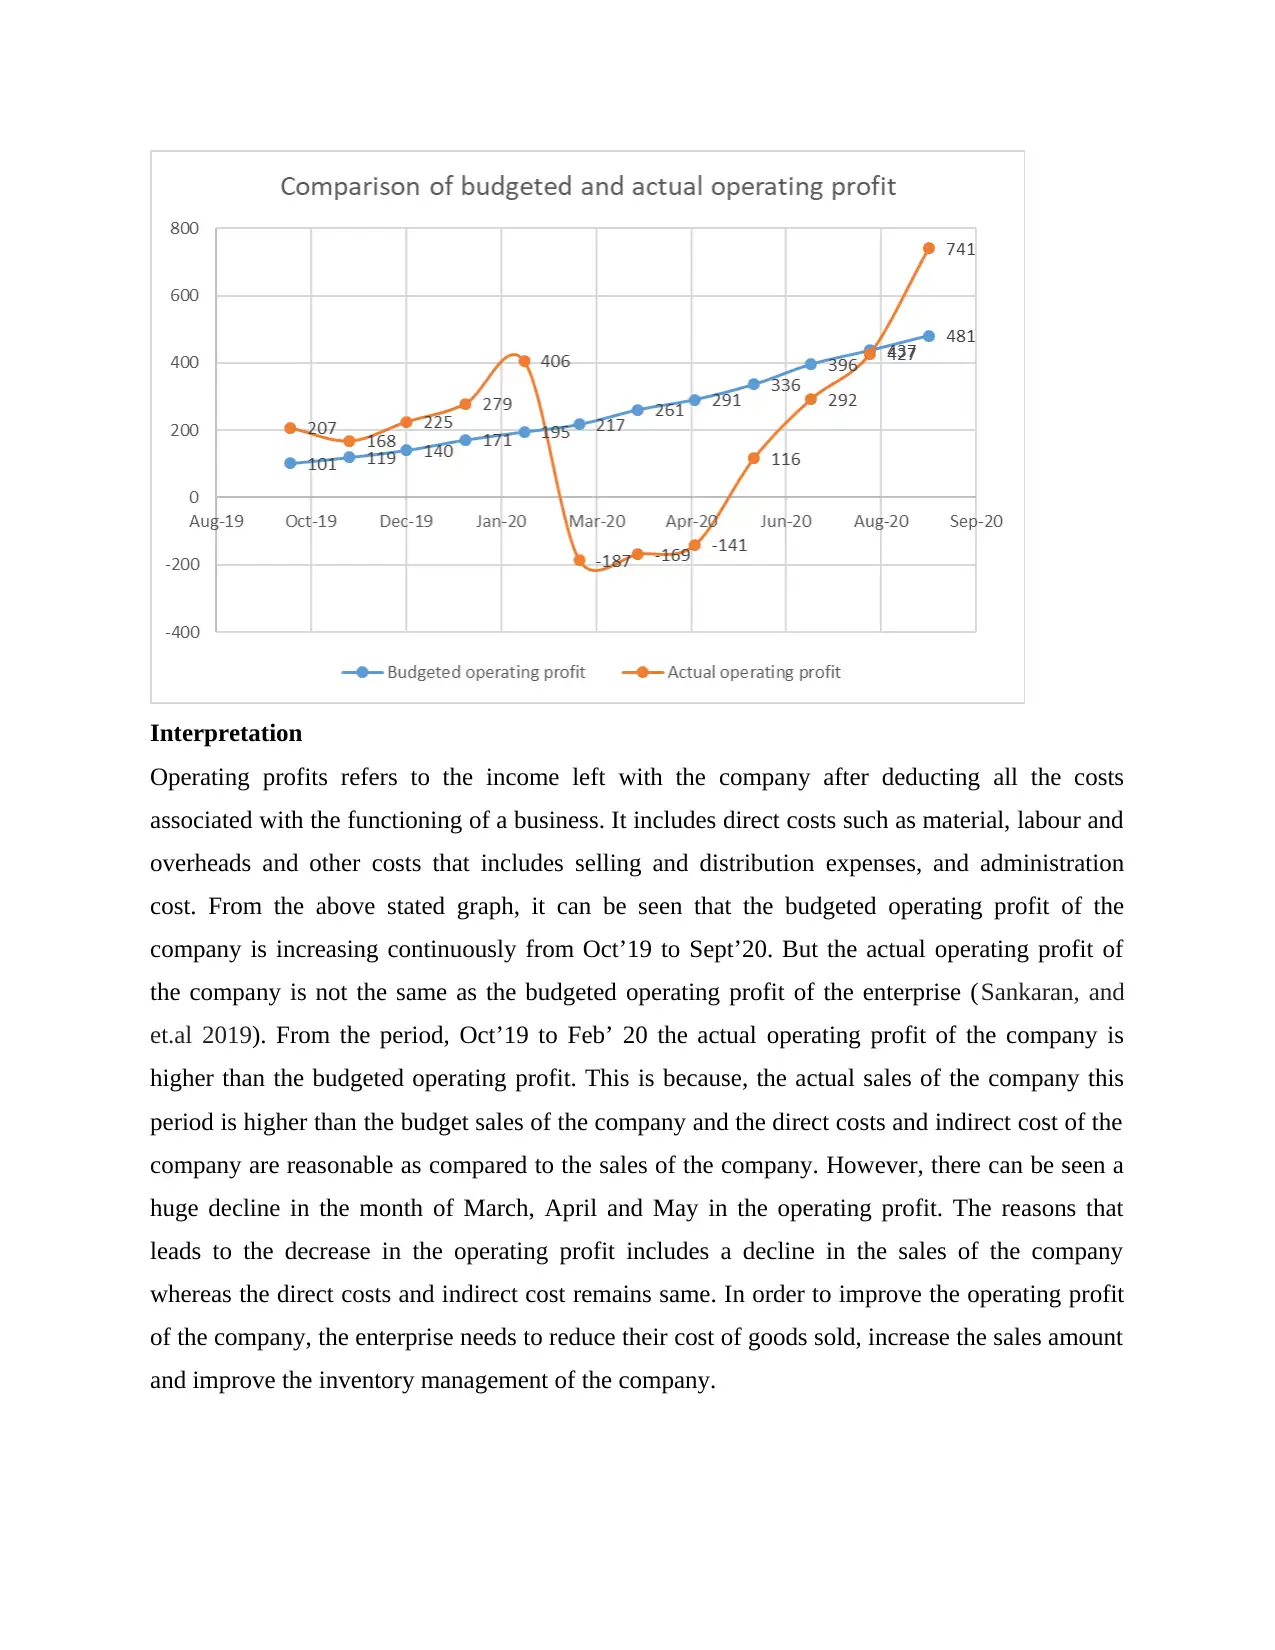
This report provides a comprehensive analysis of a company's business planning and financial performance. It includes a comparison of budgeted and actual financial statements, specifically the statement of profit and loss and the balance sheet, for the period of Oct’19 to Sept’20. The analysis identifies variances between budgeted and actual figures, highlighting areas of strong performance and areas needing improvement. Pie charts and line graphs are used to visually represent the data, comparing sales, gross profit, and operating profit. The report also calculates and interprets key liquidity and profitability ratios to assess the company's financial health. Key findings indicate that the company spends a significant portion of its budget on distribution costs, and sales fluctuated significantly during the year, particularly in March, April, and May. Recommendations include reducing distribution costs, improving sales strategies, and enhancing inventory management to increase profitability and overall financial stability. Desklib offers a variety of resources and tools to help students further understand business planning and financial analysis.
Contribute Materials
Your contribution can guide someone’s learning journey. Share your
documents today.

BUSINESS
PLANNING
PLANNING
Secure Best Marks with AI Grader
Need help grading? Try our AI Grader for instant feedback on your assignments.

Table of Contents
INTRODUCTION...........................................................................................................................3
MAIN BODY..................................................................................................................................3
Executive Summary.........................................................................................................................3
Financial statements.....................................................................................................................3
Pie charts....................................................................................................................................7
Line graphs..................................................................................................................................8
Profitability and liquidity ratios.................................................................................................12
Calculation of liquidity ratios..........................................................................................12
Calculation of profitability ratios.....................................................................................12
CONCLUSION..............................................................................................................................13
REFERENCES..............................................................................................................................14

INTRODUCTION
Business planning can be defined as a structure or a statement that provides a company
with proper direction on how to achieve its organizational goals. The present report is based on
the business planning of a company. The present report aims to prepare a budgeted and actual
financial statements of the company. The financial statements will include budgeted and actual
statement of profit and loss and balance sheet for the year ending Oct’19 to Sept’20. The report
will compare the budgeted statements with the actual statements of the company in order to
identify the performance of the company. There will a comparison of budgeted gross profit with
the actual gross profit of the enterprise. Similarly, a comparative analysis of the budgeted
operating profit and sales with the actual operating profit and sales will be included. The
statement will include relevant pie chart and line graphs for the purpose of comparing the
performance of the organization. The current report also includes comments on the performance
of the company and identifies the reasons for the same.
MAIN BODY
Executive Summary
The present report identifies that the financial position of the company for the period
Oct’19 to March’20 is overall good. However, it has been recognised that the company spends a
large portion of its money on the distribution cost for the products and services. The portion of
money spent individually on the distribution cost is high as compared to the cost. The company
try to reduce the distribution cost in order to increase its profitability. It has also been observed
that the sales of the in the months of March, April and May were very low. Therefore, the
organization should step forward in order increase the sales by increasing the customer
satisfaction. The organization should provide its customers with unique and trendy products and
services and also hire employees which are highly skilled and can be of help for the company.
This will help the organization in achieving great heights.
Financial statements

Budgeted statement of profit & loss for the period of 12 months
Particulars
Oct-
19
Nov-
19
Dec-
19
Jan-
20
Feb-
20
Mar-
20
Apr-
20
May-
20
Jun-
20
Jul-
20
Aug-
20
Sep-
20 Total
£000 £000 £000 £000 £000 £000 £000 £000 £000 £000 £000 £000 £000
Budgeted Sales 354 390 429 472 519 571 628 690 759 835 919 1011 7577
Direct Material -25 -30 -35 -38 -37 -38 -42 -50 -55 -55 -65 -70 540
Direct Labour -30 -33 -36 -40 -44 -48 -53 -58 -64 --71 -75 -86 639
Variable overheads -15 -18 -18 -20 -22 -25 -27 -30 -31 -35 -39 -43 323
Fixed overheads -25 -25 -25 -25 -25 -25 -25 -25 -25 -25 -25 -25 300
Budgeted Gross Profit 259 284 314 349 391 435 481 527 584 649 715 787 5775
Administration costs -45 -45 -45 -45 -45 45 -45 -45 45 -45 -45 -45 540
Distribution costs -80 -87 -97 -100 -118 -140 -142 -158 170 -175 -200 -228 1695
Selling costs -33 -33 -33 -33 -33 -33 -33 -33 33 -33 --33 -33 396
Operating profit 101 119 140 171 195 217 261 291 336 396 437 481 3144
Finance costs -15 -15 -15 -15 -15 -15 -15 -15 15 -15 -15 -15 180
Profit before tax
(PBT) 86 104 125 156 180 202 246 276 321 381 422 466 2964
Tax (10% of PBT) -8.6 -10.4 -12.5 -15.6 -18.0 -20.2 -24.6 -27.6 32.1 --38.1 -42.2 -46.6 296.4
Profit after tax 77.4 93.6 112.1 140.4 162.3 181.4 221.6 248.0 288.6 342.8 379.9 419.4
2667.
4
Secure Best Marks with AI Grader
Need help grading? Try our AI Grader for instant feedback on your assignments.

Actual statement of profit & loss for the period of 12 months
Particulars 19-Oct 19-
Nov
19-
Dec
20-
Jan
20-
Feb
20-
Mar
20-
Apr
20-
May
20-
Jun
20-
Jul
20-
Aug
20-
Sep Total
£000 £000 £000 £000 £000 £000 £000 £000 £000 £000 £000 £000 £000
Actual Sales 375 421 497 562 712 150 180 242 523 715 894 1256 6527
Direct Material -30 -33 -39 -42 -40 -42 -46 -55 -61 -61 -72 -77 -598
Direct Labor -33 -31 -35 -38 -42 -46 -51 -56 -61 -67 -71 -81 -612
Variable overheads -25 -17 -18 -19 -21 -24 -26 -29 -30 -34 -38 -42 -323
Fixed overheads -20 -20 -20 -20 -20 -20 -20 -20 -20 -20 -20 -20 -240
Gross Profit 267 319 386 443 589 18 37 82 351 533 693 1036 4754
Administration costs -35 -35 -35 -35 -35 -35 -35 -35 -35 -35 -35 -35 -420
Distribution costs -25 -89 -99 -102 -120 -143 -145 -161 -173 -179 -204 -233 -1673
Selling costs -
27 -27 -27 -27 -27 -27 -27 -27 -27 -27 -27 -27 -297
Operating profit 207 168 225 279 406 -187 -169 -141 116 292 427 741 2364
Finance costs -10 -10 -10 -10 -10 -10 -10 -10 -10 -10 -10 -10 -120
Profit before tax (PBT) 197 158 215 269 396 -197 -179 -151 106 282 417 731 2244
Tax (10% of PBT) -19.7 -15.8 -21.5 -26.9 -39.6 -19.7 -17.9 -15.1 -10.6 -28.2 -41.7 -73.1 -329.8
Profit after tax 177.3 142.6 193.9 241.9 356.6 -177.1 -161.4 -135.7 95.3 254.2 375.7 657.9 2021.
2

STATEMENT OF FINANCIAL POSITION Actual data Budgeted data
NON-CURRENT ASSETS
Land and Buildings £710,000 £ 750,000.00
Plant& Machinery £740,000 £ 800,000.00
£1,450,00
0 £ 1,550,000.00
CURRENT ASSETS
Cash £650,000 £ 61,00,000.00
Trade Receivables £190,000 £ 1515400.00
Inventory £0 £ 500.00
Prepayments £188,000 £ 200,000.00
Accrued Income £580,000 £ 650,000.00
£1,608,00
0 £ 84,65,900.00
TOTAL ASSETS
£3,058,00
0
£
10,015,900.00
EQUITY
Share Capital £166,000 £ 3,000,000.00
Retained Earnings
£2,102,00
0 £ 2,667,400.00
£2,268,00
0 £ 56,67,400.00
NON-CURRENT
LIABILITIES

Long-term Bank Loan £360,000 £ 20,00,000.00
£360,000
£
20,00,000.00
CURRENT LIABILITIES
Trade payables £325,000 £ 2,16,000.00
Accruals £105,000
£
21,32,500.00
£430,000
£
23,48,500.00
TOTAL EQUITY & LIABILITIES
£3,058,00
0
£
10,015,900.00
£360,000
£
20,00,000.00
CURRENT LIABILITIES
Trade payables £325,000 £ 2,16,000.00
Accruals £105,000
£
21,32,500.00
£430,000
£
23,48,500.00
TOTAL EQUITY & LIABILITIES
£3,058,00
0
£
10,015,900.00
Paraphrase This Document
Need a fresh take? Get an instant paraphrase of this document with our AI Paraphraser

Pie charts
A pie c hart s ho wi ng th e re l ativ e size of each of budgeted cos ts fo r the year .
Interpretation:
The budgeted cost of the company states that the enterprise spends majority of its money on the
distribution of its products and services to the customers. It can be seen that the budgeted
distribution cost of the enterprise accounts for 35% of the total cost of the company (Musallam,
2018). The company spends 13% of its budget on the direct labour cost of the company which
the second highest cost among all the associated costs of the company.
A pie chart showing the relative size of each of actual cost for the year

Interpretation:
The above pie chart represents the actual costs of the company. It can be observed that similar to
the budgeted cost of the company, the enterprise spends most of its money on the distribution of
the products and services and labour cost of the company (Kadim, Sunardi, and Husain, 2020).
In the actual statement of cost, the distribution cost of the organization is 38% and the labour
cost is 13%.
Interpretation of the budgeted and actual cost
By comparing the budgeted costs with the actual cost of the organization, it can be interpreted
that as forecasted in the budgeted costs, the company spends most of the budget on the
distribution cost in the actual results too. However, the actual distribution cost of the
organization is higher by 3% from the budgeted distribution cost of the company. The company
needs to reduce its distribution cost in order to increase the profitability of the company. For the
same, the company should invest in fixed securities that pay a fixed return in order to pay the
variable cost of the company (Linares-Mustarós, Coenders, and Vives-Mestres, 2018). The
company needs to increase the sales in comparison to the distribution cost incurred of the
company.
Line graphs
Comparison between actual sales and budgeted sales

Interpretation
From the above graph, it can be witnessed that the budgeted sales of the company have been
constantly increasing from the Oct’19 to the Sept’20. On the other hand, the actual sales of the
organization are fluctuating throughout the period ending Sept’20. The actual sale of the
organization was higher in the months of Oct’19 to Feb’20 from the budgeted figures of the
company but there is an huge decline in the sale from Feb to march (Mongwe, and Malan, 2020).
There could be various reasons that leads to a fall in the actual sales of the company. These
include internal management issues, poor working conditions for the staff, not being able to fulfil
the needs and wants of the consumers with the provided products. In order to increase the sales
as well as the profitability of the company, the company should focus on hiring skilled staff,
launching new and unique products in the market, try to address the needs and wants of the
consumers by providing them with the trendy and useful products.
Secure Best Marks with AI Grader
Need help grading? Try our AI Grader for instant feedback on your assignments.

Comparison between actual and budgeted gross profit
Interpretation
Gross profits refer to the profit a company earns after deducting the cost of goods sold from the
actual sales of the company. From the above graph, it can be observed that the budgeted gross
profit of the company is showing a constant and steady growth of the company for the period
Oct’19 to Sept’20. However, the actual gross profit is fluctuating. In the initial stage, it can be
seen that the actual gross profit of the has grown immensely from Oct’19 to Jan’20, but in
March’20, the gross profit has declined by a huge amount (Argenti, 2018). The reason for the
decline in gross profit includes reduction in amount of sales of the company, increase in the
material cost and labour cost of the company. The change in the method of management of
inventory can also lead to a decline in the gross profit of the company. For the purpose of
increasing the actual gross profit of the company, the company should try to reduce the costs
such as material cost, labour cost and overheads of the company. The company has shown an
increase in gross profits from April’20 to Sept’20.
Comparison between actual and budgeted operating profits

Interpretation
Operating profits refers to the income left with the company after deducting all the costs
associated with the functioning of a business. It includes direct costs such as material, labour and
overheads and other costs that includes selling and distribution expenses, and administration
cost. From the above stated graph, it can be seen that the budgeted operating profit of the
company is increasing continuously from Oct’19 to Sept’20. But the actual operating profit of
the company is not the same as the budgeted operating profit of the enterprise (Sankaran, and
et.al 2019). From the period, Oct’19 to Feb’ 20 the actual operating profit of the company is
higher than the budgeted operating profit. This is because, the actual sales of the company this
period is higher than the budget sales of the company and the direct costs and indirect cost of the
company are reasonable as compared to the sales of the company. However, there can be seen a
huge decline in the month of March, April and May in the operating profit. The reasons that
leads to the decrease in the operating profit includes a decline in the sales of the company
whereas the direct costs and indirect cost remains same. In order to improve the operating profit
of the company, the enterprise needs to reduce their cost of goods sold, increase the sales amount
and improve the inventory management of the company.

Profitability and liquidity ratios
Calculation of liquidity ratios
Liquidity Ratio
Particulars Formula Budgeted Actual
Current assets 84,65,900 1608000
Current liabilities 2348500 430000
Inventory 500 0
Prepayments 200000 188000
Quick assets Current assets - inventory - prepayments 82,65,400 1420000
Current ratio Current assets / Current liabilities 3.6 3.74
Quick assets Quick assets / Current liabilities 3.5 3.3
Interpretation
Current ratio
Current ratio is a tool which helps in identifying the ratio of current assets in comparison to the
current liabilities of the company. The current ratio of a company should always fall within the
range of 1.5 to 3 (Kepczynski and et.al 2018). However, the budgeted current ratio is calculated
as 3.6 and the actual current ratio of the enterprise is 3.74. Here, the current ratio is above 3
which means that the company is not utilising its current assets properly and not using them to
repay the current liabilities of the organization. In order to reduce the current ratio, the
organization should spend cash optimally for repaying the current liabilities and reducing the
amount of non-current liabilities.
Quick ratio
The budgeted ratio is 3.5 and the quick ratio of the company is calculated as 3.3. This depicts
that the short-term liquidity position of the company is good and it can repay its short-term
liabilities on time by quickly liquidating the quick assets of the company.
Calculation of profitability ratios
Particulars Formula Budgeted Actual
Gross Profit 5775000 4754000
Net Profit 2667400 2021200
Net Sales 7577000 6527000
Paraphrase This Document
Need a fresh take? Get an instant paraphrase of this document with our AI Paraphraser

Gross profit ratio (Gross profit/sales)*100 76% 72%
Net profit ratio (Net profit/sales)*100 35% 30%
Interpretation
Gross profit ratio
Gross profit ratio is used to identify the percentage of profit an organization makes after
deducting its cost of goods sold from the revenue (Kariyawasam, 2019). The budgeted gross
profit of the organization is 76% and the actual gross profit of the company is 72%, which is 4%
less than the budgeted GP. In order to increase the Gross profit, the company should try to
increase the sales of the company and work on reducing the cost of goods sold.
Net profit ratio
Net profit ratio is used to calculate the amount of net profit as a percentage of the net sales of the
company. The budgeted net profit of the company is 35% and the actual net profit is 30% i.e.,
5% less than the budgeted net profit of the company (Firnanti, and Karmudiandri, 2020). The
company needs to increase the sales, reduce the direct and indirect cost of the company in order
to increase the net sales. The company should also try to reduce the distribution cost incurred.
CONCLUSION
From the above report, it has been identified that the actual gross profit ratios and the net profit
ratio of the company are less than the budgeted gross profit and the net profit of the company.
Though, the company has a net profit of 30% for the period from Oct’19 to Sept’20 which is
considered as good for the company. But in order to increase the profits more, it can work on
increasing the sales and reducing the cost associated with direct material, direct labour,
overheads, selling and distribution costs.

REFERENCES
Books and Journal
Argenti, J., 2018. Practical corporate planning. Routledge.
Firnanti, F. and Karmudiandri, A., 2020. Corporate governance and financial ratios effect on
audit report Lag. Firnanti, F, pp.15-21.
Ho, A.T.K., 2018. From performance budgeting to performance budget management: theory and
practice. Public Administration Review. 78(5). pp.748-758.
Kadim, A., Sunardi, N. and Husain, T., 2020. The modeling firm's value based on financial
ratios, intellectual capital and dividend policy. Accounting. 6(5).pp.859-870.
Kariyawasam, H.N., 2019. Analysing the impact of financial ratios on a company’s financial
performance. International Journal of Management Excellence. 13(1). pp.1898-1903.
Kepczynski, R., and et.al 2018. Integrated Business Planning: How to integrate planning
processes, organizational structures and capabilities, and leverage SAP IBP technology.
Springer.
Linares-Mustarós, S., Coenders, G. and Vives-Mestres, M., 2018. Financial performance and
distress profiles. From classification according to financial ratios to compositional
classification. Advances in Accounting. 40. pp.1-10.
Maheshwari, S.N., Maheshwari, S.K. and Maheshwari, M.S.K., 2021. Principles of Management
Accounting. Sultan Chand & Sons.
Mongwe, W.T. and Malan, K.M., 2020, December. The efficacy of financial ratios for fraud
detection using self organising maps. In 2020 IEEE Symposium Series on
Computational Intelligence (SSCI) (pp. 1100-1106). IEEE.
Musallam, S.R., 2018. Exploring the relationship between financial ratios and market stock
returns. Eurasian Journal of Business and Economics. 11(21). pp.101-116.
Palepu, K.G., Healy, P.M., Wright, S., Bradbury, M. and Coulton, J., 2020. Business analysis
and valuation: Using financial statements. Cengage AU.
Sankaran, G., and et.al 2019. Improving Forecasts with Integrated Business Planning. Springer.
Suriyanti, S., et. Al 2020. Planning Strategy of Operation Business and Maintenance by
Analytical Hierarchy Process and Strength, Weakness, Opportunity, and Threat
Integration for Energy Sustainability. International Journal of Energy Economics and
Policy.10(4). p.221.

1 out of 16
Related Documents

Your All-in-One AI-Powered Toolkit for Academic Success.
+13062052269
info@desklib.com
Available 24*7 on WhatsApp / Email
Unlock your academic potential
© 2024 | Zucol Services PVT LTD | All rights reserved.