Financial Accounting Report: Statement Analysis and Project Evaluation
VerifiedAdded on 2023/06/18
|15
|2355
|61
Report
AI Summary
This report provides a comprehensive financial analysis, starting with the preparation of a statement of profit and loss and a statement of financial position for Peter Baker as of September 2019. It includes calculations of depreciation using both the straight-line and sum-of-digits methods, along with arguments for and against each method. Furthermore, the report computes and interprets key financial ratios such as the current ratio, debt-equity ratio, return on equity, and gross profit ratio for the years 2018 and 2019. It also identifies two users of financial statements. Finally, the report assesses two projects using the payback period and net present value methods, advising the director based on the findings and discussing the advantages and limitations of each method.

Accounts
Paraphrase This Document
Need a fresh take? Get an instant paraphrase of this document with our AI Paraphraser

TABLE OF CONTENTS
Q1. ...................................................................................................................................................3
a) Statement of profit & loss for the year ended September 2019...............................................3
b) Statement of financial position for the year 2019....................................................................3
Q2. ...................................................................................................................................................4
a) Calculation of depreciation using Straight line method...........................................................4
b) Computation of depreciation using Sum of digit method........................................................5
c) Arguments made for and against two methods........................................................................5
Q3.....................................................................................................................................................7
a) Computation of current ratio with its measure and interpretation for 2018 & 2019 year.......7
b) Calculation of debt equity ratio with measure and interpretation for the period 2018 & 2019
......................................................................................................................................................7
c) Determination of return on equity with its measures and interpretation.................................8
d) Calculation of gross profit ratio by considering its measures and interpretation for period
2018 & 2019................................................................................................................................8
e) Two users of financial statement.............................................................................................9
Q4. ...................................................................................................................................................9
a) Access of following projects using two methods:...................................................................9
b) Pay back period method..........................................................................................................9
c) Net present value method......................................................................................................10
b) Advise to the director............................................................................................................11
c) Advantages and limitations of two methods.........................................................................11
REFERENCES..............................................................................................................................13
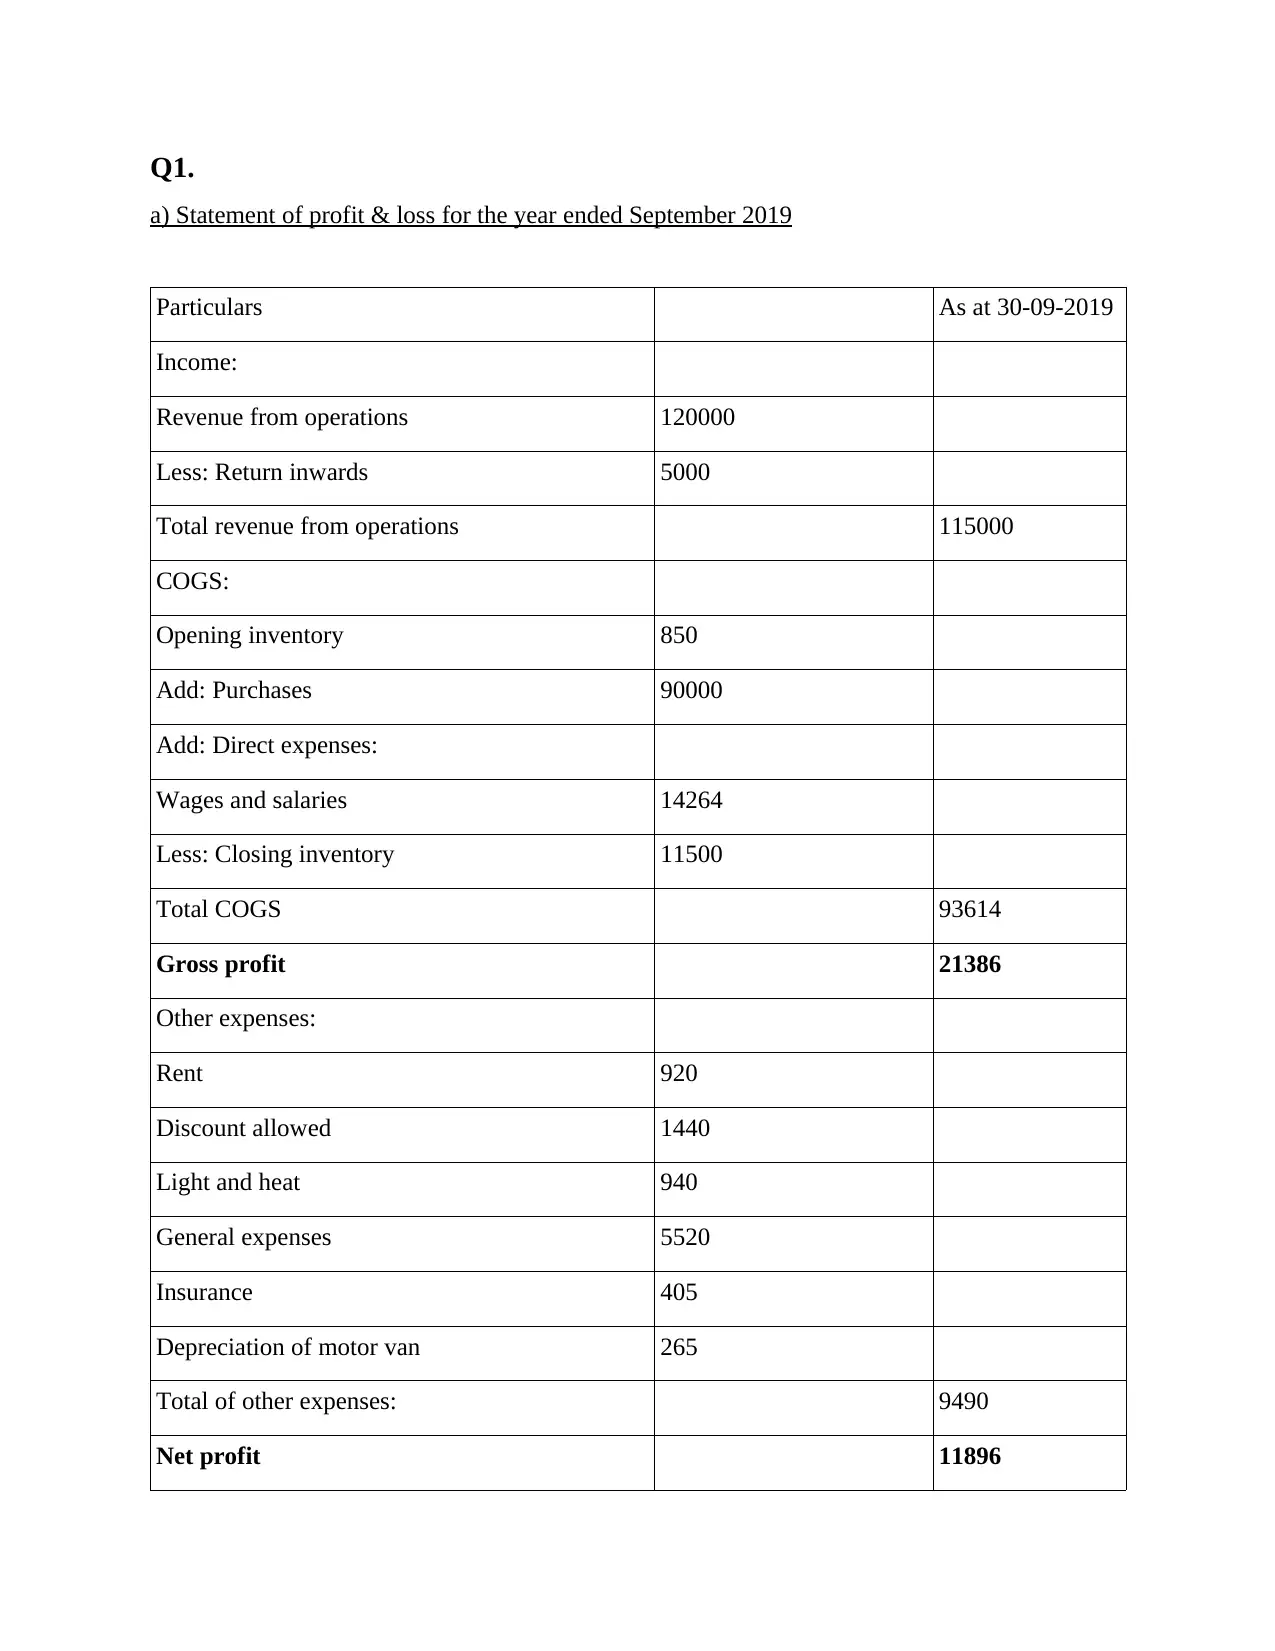
Q1.
a) Statement of profit & loss for the year ended September 2019
Particulars As at 30-09-2019
Income:
Revenue from operations 120000
Less: Return inwards 5000
Total revenue from operations 115000
COGS:
Opening inventory 850
Add: Purchases 90000
Add: Direct expenses:
Wages and salaries 14264
Less: Closing inventory 11500
Total COGS 93614
Gross profit 21386
Other expenses:
Rent 920
Discount allowed 1440
Light and heat 940
General expenses 5520
Insurance 405
Depreciation of motor van 265
Total of other expenses: 9490
Net profit 11896
⊘ This is a preview!⊘
Do you want full access?
Subscribe today to unlock all pages.
Trusted by 1+ million students worldwide
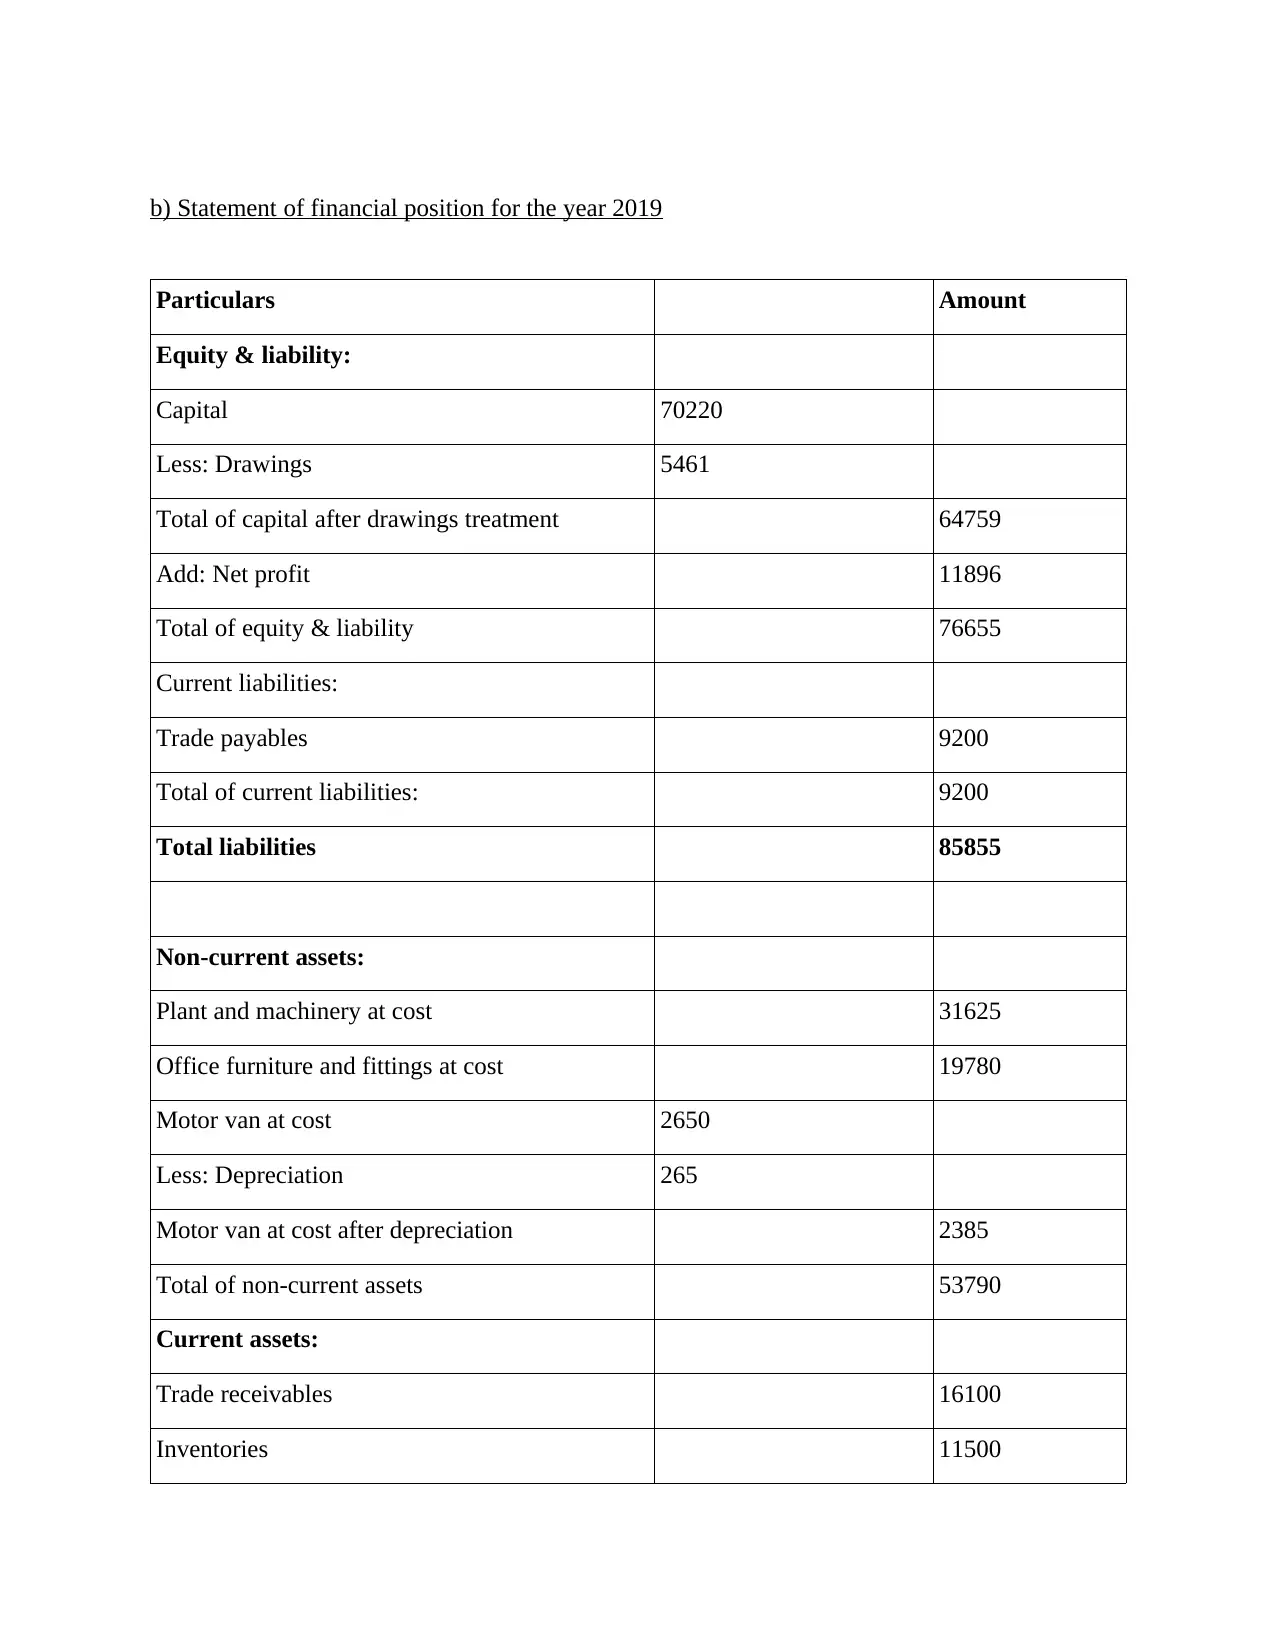
b) Statement of financial position for the year 2019
Particulars Amount
Equity & liability:
Capital 70220
Less: Drawings 5461
Total of capital after drawings treatment 64759
Add: Net profit 11896
Total of equity & liability 76655
Current liabilities:
Trade payables 9200
Total of current liabilities: 9200
Total liabilities 85855
Non-current assets:
Plant and machinery at cost 31625
Office furniture and fittings at cost 19780
Motor van at cost 2650
Less: Depreciation 265
Motor van at cost after depreciation 2385
Total of non-current assets 53790
Current assets:
Trade receivables 16100
Inventories 11500
Paraphrase This Document
Need a fresh take? Get an instant paraphrase of this document with our AI Paraphraser
Cash at bank 4465
Total of current assets: 32065
Total assets 85855
Q2.
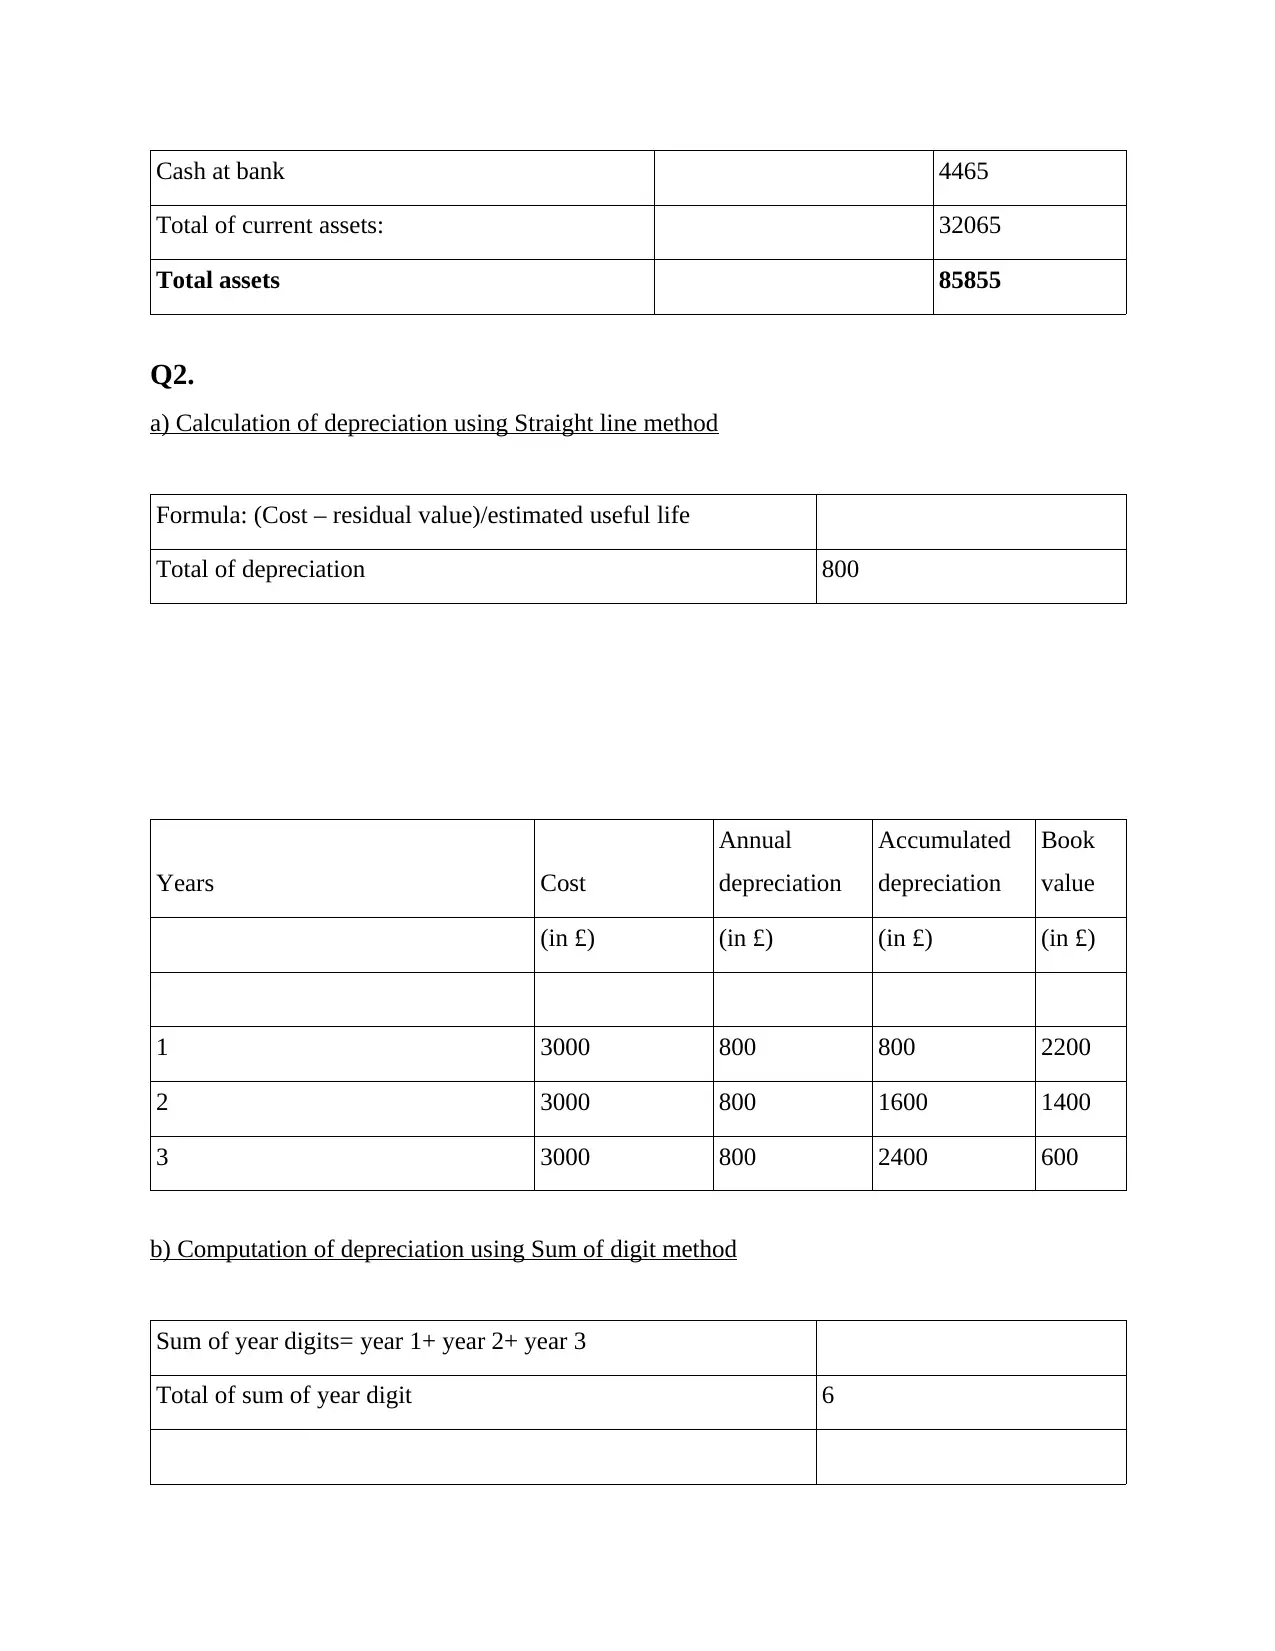
a) Calculation of depreciation using Straight line method
Formula: (Cost – residual value)/estimated useful life
Total of depreciation 800
Years Cost
Annual
depreciation
Accumulated
depreciation
Book
value
(in £) (in £) (in £) (in £)
1 3000 800 800 2200
2 3000 800 1600 1400
3 3000 800 2400 600
b) Computation of depreciation using Sum of digit method
Sum of year digits= year 1+ year 2+ year 3
Total of sum of year digit 6
Total of current assets: 32065
Total assets 85855
Q2.
a) Calculation of depreciation using Straight line method
Formula: (Cost – residual value)/estimated useful life
Total of depreciation 800
Years Cost
Annual
depreciation
Accumulated
depreciation
Book
value
(in £) (in £) (in £) (in £)
1 3000 800 800 2200
2 3000 800 1600 1400
3 3000 800 2400 600
b) Computation of depreciation using Sum of digit method
Sum of year digits= year 1+ year 2+ year 3
Total of sum of year digit 6

Amount to be depreciated= Cost – residual value
Cost of the catering freezer 3000
Residual value 600
Total of amount to be depreciated 2400
Years
Amount to be
depreciated
Depreciation
factor
Depreciation
expense
(in £)
1 2400 0.50 1200
2 1200 0.33 400
3 800 0.17 133.33
c) Arguments made for and against two methods
Straight line method :
Arguments made for Straight line method of depreciation:
1) Simplicity: SLM is the simplest method for calculating depreciation and any normal
person can understand this method easily.
2) Asset are written off completely: Under straight line method depreciation is charged on
the cost of assets at constant rate over its estimated useful life i.e., charging takes place
till assets value comes to zero (Kumaat., Paendong and Lintong, 2021).
3) Suitable for small business: This method of depreciation is appropriate for small entity
because it is the easiest and simplest way to determine value of net assets for those
structure who has small business size.
Arguments made against Straight line method of depreciation:
1) Considered to be illogical: This way of computing depreciation value seems to be
illogical because charge is applied on original cost of asset irrespective of its declination
every year.
⊘ This is a preview!⊘
Do you want full access?
Subscribe today to unlock all pages.
Trusted by 1+ million students worldwide
2) Puts pressure on final year: As the assets comes to its end of estimated life it demands
more repairs and maintenance in comparison of initial years. During final period this
method puts pressure because depreciation charged is equal for whole tenure.
No provision of replacement: Under this method there is no provision for substitution as entity
retains the asset for charging depreciation and using it to perform business regular operations for
the whole estimated life. Therefore, firm need another sources of fund for replacing their assets.
Sum of digit method:
Arguments made for Sum of digit method of depreciation:
1) Practical method: Helps the user to adjust the cost of assets with its utilization each year
over the estimated life of an asset which means that this method is practical and
productive in early stages.
2) Maintains balance between depreciation and repair cost: This method helps to
maintain equilibrium between depreciation and maintenance cost because the charge is
higher in its initial stage and needs less repair expense (Sum of Years Digits Method of
Depreciation, 2021). Subsequently, as assets get old they demand high maintenance cost
with charging less depreciation. Hence, in this way, this method maintains balance.
3) Ensures earnings don't get distorted: By maintaining proper balance between
depreciation charged and assets repair and maintenance cost, they also take care that
firm's earnings don't get distorted.
Arguments made against sum of year digit method:
1) Charge more depreciation: Under this method during its initial years depreciation
charged on assets is high as compared to later periods which leads to lower profits in
starting tenure and high revenue during following years.
2) Difficult to understand: This method of depreciation is tough to understand and
calculate in comparison with straight line, written down value & other ways.
Q3.
a) Computation of current ratio with its measure and interpretation for 2018 & 2019 year
Particulars Formula
Amount for the
period 2019
Amount for the
period 2018
Paraphrase This Document
Need a fresh take? Get an instant paraphrase of this document with our AI Paraphraser
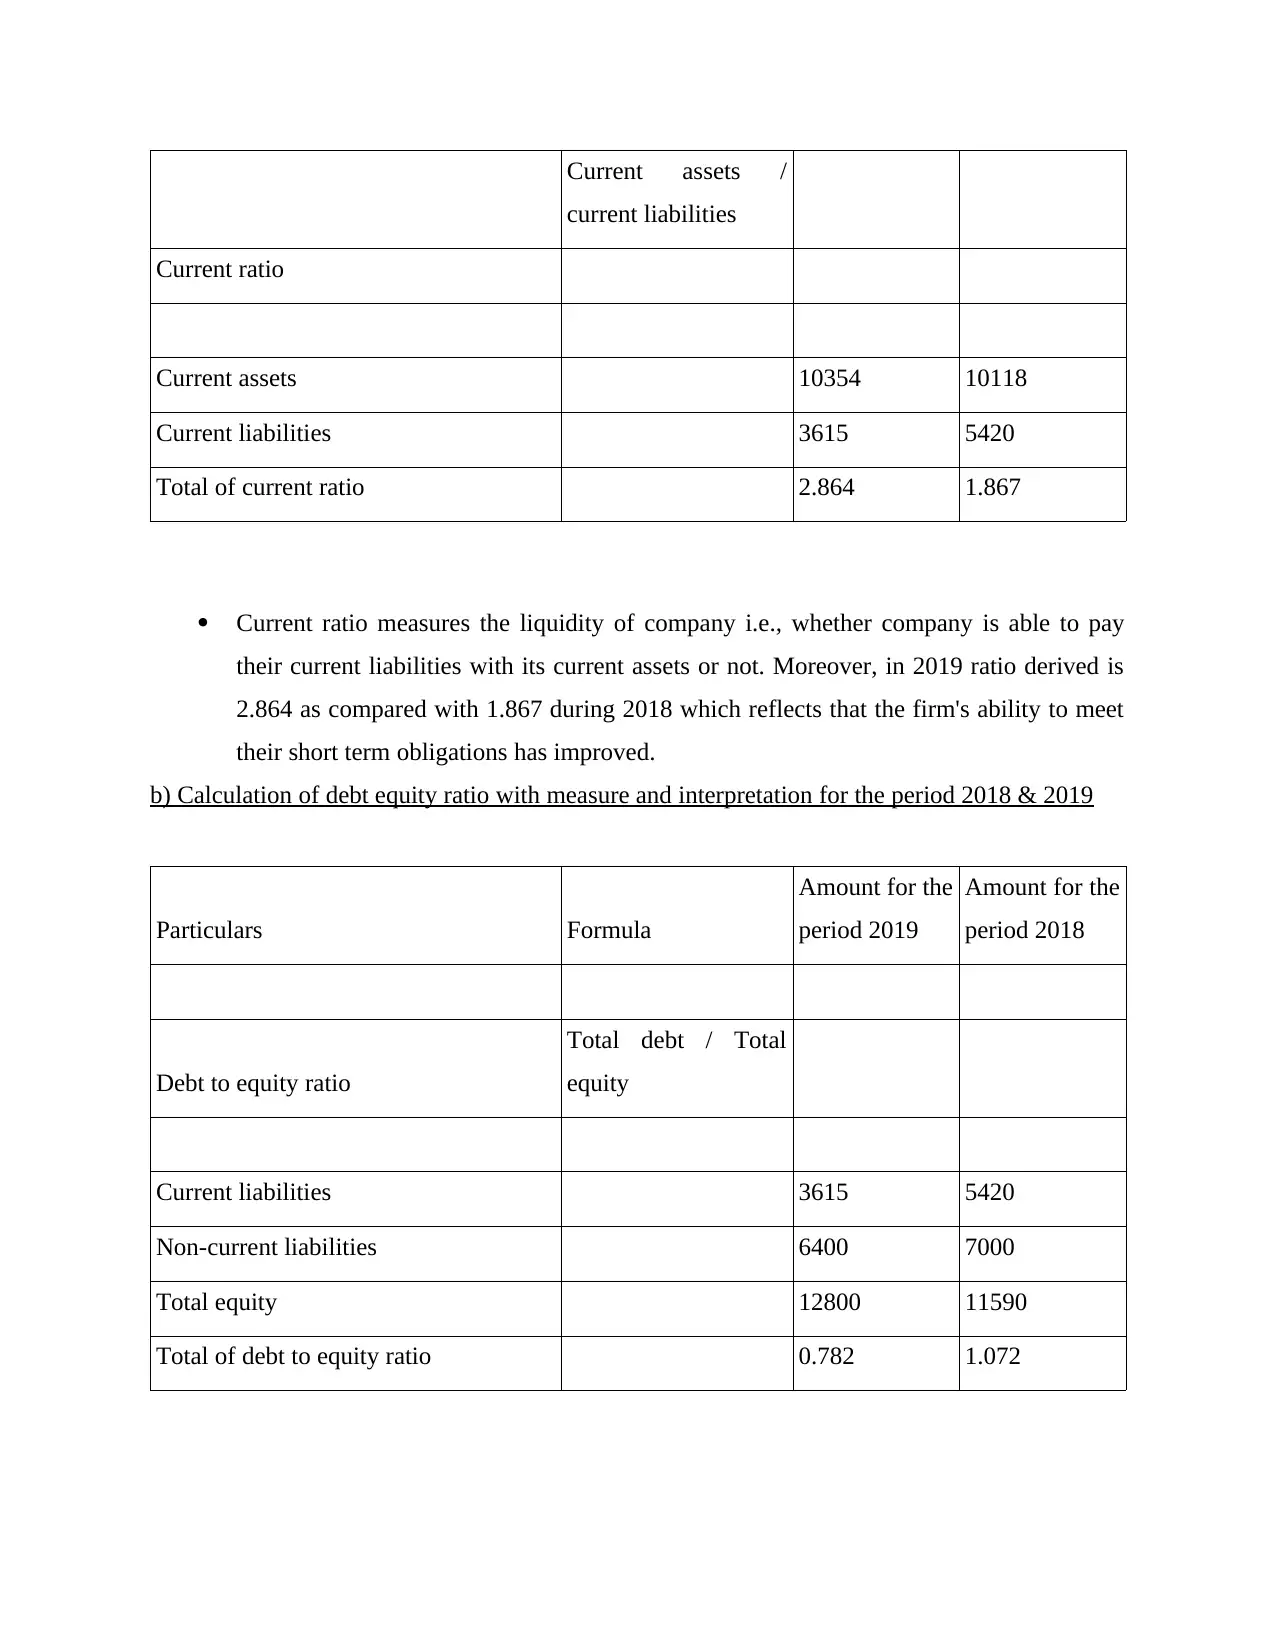
Current assets /
current liabilities
Current ratio
Current assets 10354 10118
Current liabilities 3615 5420
Total of current ratio 2.864 1.867
Current ratio measures the liquidity of company i.e., whether company is able to pay
their current liabilities with its current assets or not. Moreover, in 2019 ratio derived is
2.864 as compared with 1.867 during 2018 which reflects that the firm's ability to meet
their short term obligations has improved.
b) Calculation of debt equity ratio with measure and interpretation for the period 2018 & 2019
Particulars Formula
Amount for the
period 2019
Amount for the
period 2018
Debt to equity ratio
Total debt / Total
equity
Current liabilities 3615 5420
Non-current liabilities 6400 7000
Total equity 12800 11590
Total of debt to equity ratio 0.782 1.072
This ratio reflects the portion of equity and debt which company is using to fund its
assets. By looking at firm's ratio in the given case, it shows that firm's debt to equity
ratio has gone down in comparison to 2018 where it becomes 0.782 in 2019 from 1.072
during 2018. Therefore, financial risk for the company has reduced in 2019.
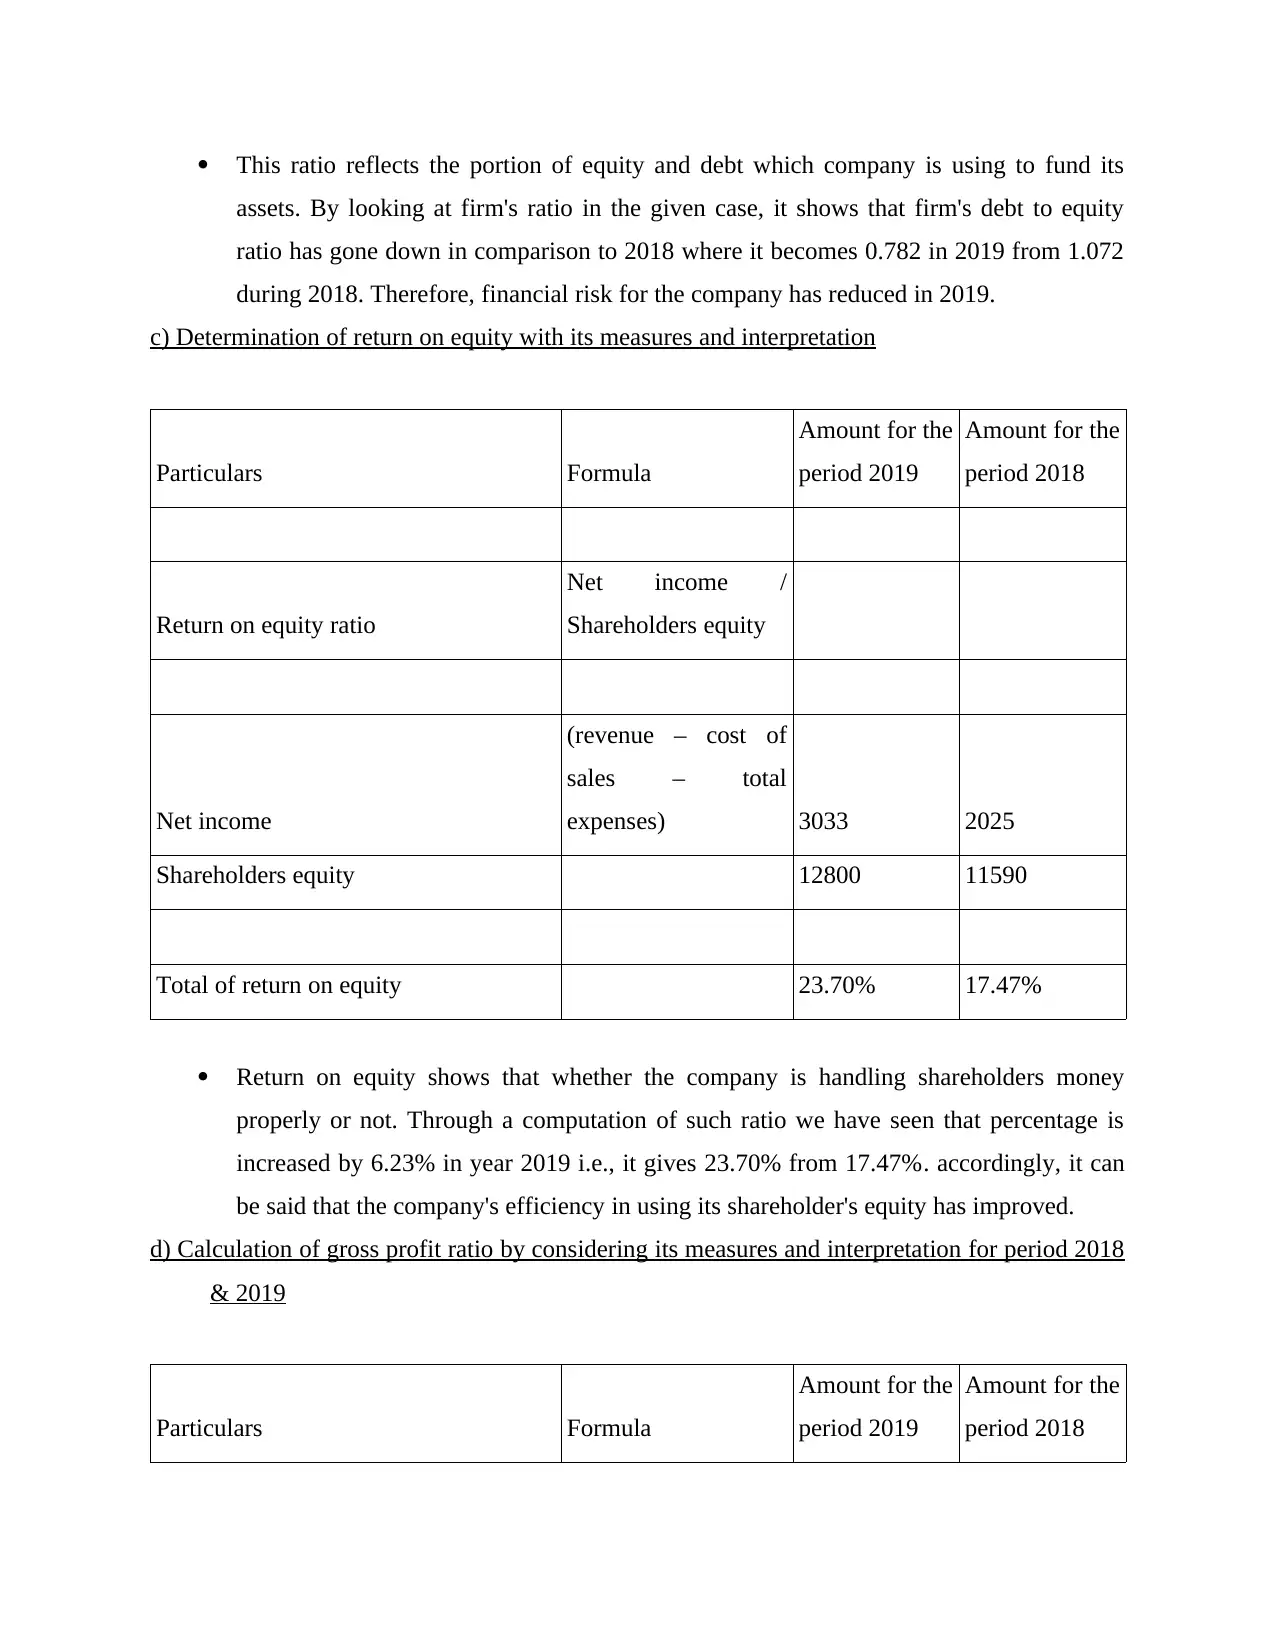
c) Determination of return on equity with its measures and interpretation
Particulars Formula
Amount for the
period 2019
Amount for the
period 2018
Return on equity ratio
Net income /
Shareholders equity
Net income
(revenue – cost of
sales – total
expenses) 3033 2025
Shareholders equity 12800 11590
Total of return on equity 23.70% 17.47%
Return on equity shows that whether the company is handling shareholders money
properly or not. Through a computation of such ratio we have seen that percentage is
increased by 6.23% in year 2019 i.e., it gives 23.70% from 17.47%. accordingly, it can
be said that the company's efficiency in using its shareholder's equity has improved.
d) Calculation of gross profit ratio by considering its measures and interpretation for period 2018
& 2019
Particulars Formula
Amount for the
period 2019
Amount for the
period 2018
assets. By looking at firm's ratio in the given case, it shows that firm's debt to equity
ratio has gone down in comparison to 2018 where it becomes 0.782 in 2019 from 1.072
during 2018. Therefore, financial risk for the company has reduced in 2019.
c) Determination of return on equity with its measures and interpretation
Particulars Formula
Amount for the
period 2019
Amount for the
period 2018
Return on equity ratio
Net income /
Shareholders equity
Net income
(revenue – cost of
sales – total
expenses) 3033 2025
Shareholders equity 12800 11590
Total of return on equity 23.70% 17.47%
Return on equity shows that whether the company is handling shareholders money
properly or not. Through a computation of such ratio we have seen that percentage is
increased by 6.23% in year 2019 i.e., it gives 23.70% from 17.47%. accordingly, it can
be said that the company's efficiency in using its shareholder's equity has improved.
d) Calculation of gross profit ratio by considering its measures and interpretation for period 2018
& 2019
Particulars Formula
Amount for the
period 2019
Amount for the
period 2018
⊘ This is a preview!⊘
Do you want full access?
Subscribe today to unlock all pages.
Trusted by 1+ million students worldwide

Gross profit ratio
Gross profit / net
sales
Gross profit
(revenue – cost of
sales) 12188 10695
Net sales 18200 16481
Total of gross profit ratio 66.97% 64.89%
Gross profit ratio reflects the profitability of company i.e., how efficiently firm is
performing and generating good earnings over a particular period. Moreover, the above
quoted calculation has improved in 2019 i.e., entity is producing 66.97% profit from its
operations by comparing it with result generated during 2018 i.e., of 64.89%.
e) Two users of financial statement
1) Government: The stated authority uses such information to know whether firm has paid
appropriate amount of tax or not.
2) Investors: They will require financial statements to know the firms position and for
understanding a performance of their investment.
Q4.
a) Assessement of following projects using two methods:
b) Pay back period method
Project 1:
Year Cash inflows Cumulative cash inflows
1 175000 175000
2 175000 350000
3 175000 525000
Paraphrase This Document
Need a fresh take? Get an instant paraphrase of this document with our AI Paraphraser
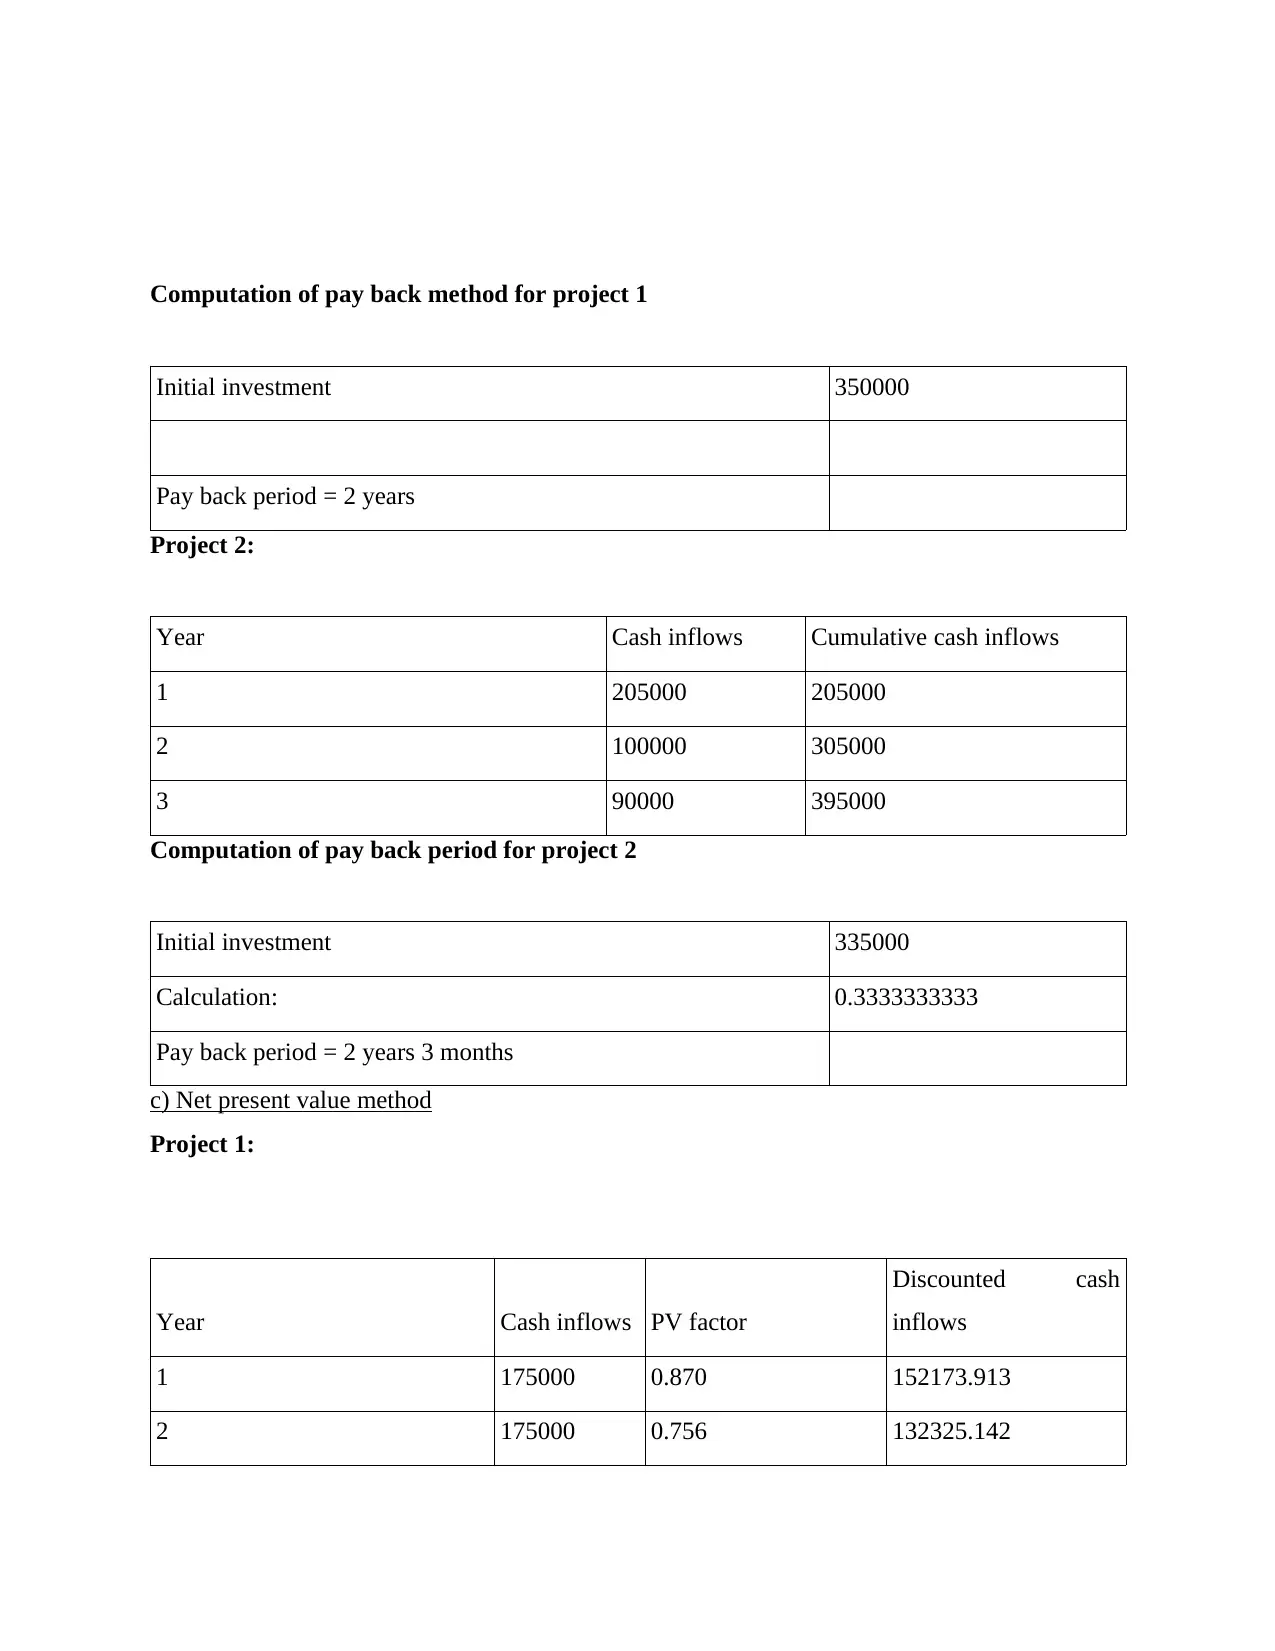
Computation of pay back method for project 1
Initial investment 350000
Pay back period = 2 years
Project 2:
Year Cash inflows Cumulative cash inflows
1 205000 205000
2 100000 305000
3 90000 395000
Computation of pay back period for project 2
Initial investment 335000
Calculation: 0.3333333333
Pay back period = 2 years 3 months
c) Net present value method
Project 1:
Year Cash inflows PV factor
Discounted cash
inflows
1 175000 0.870 152173.913
2 175000 0.756 132325.142
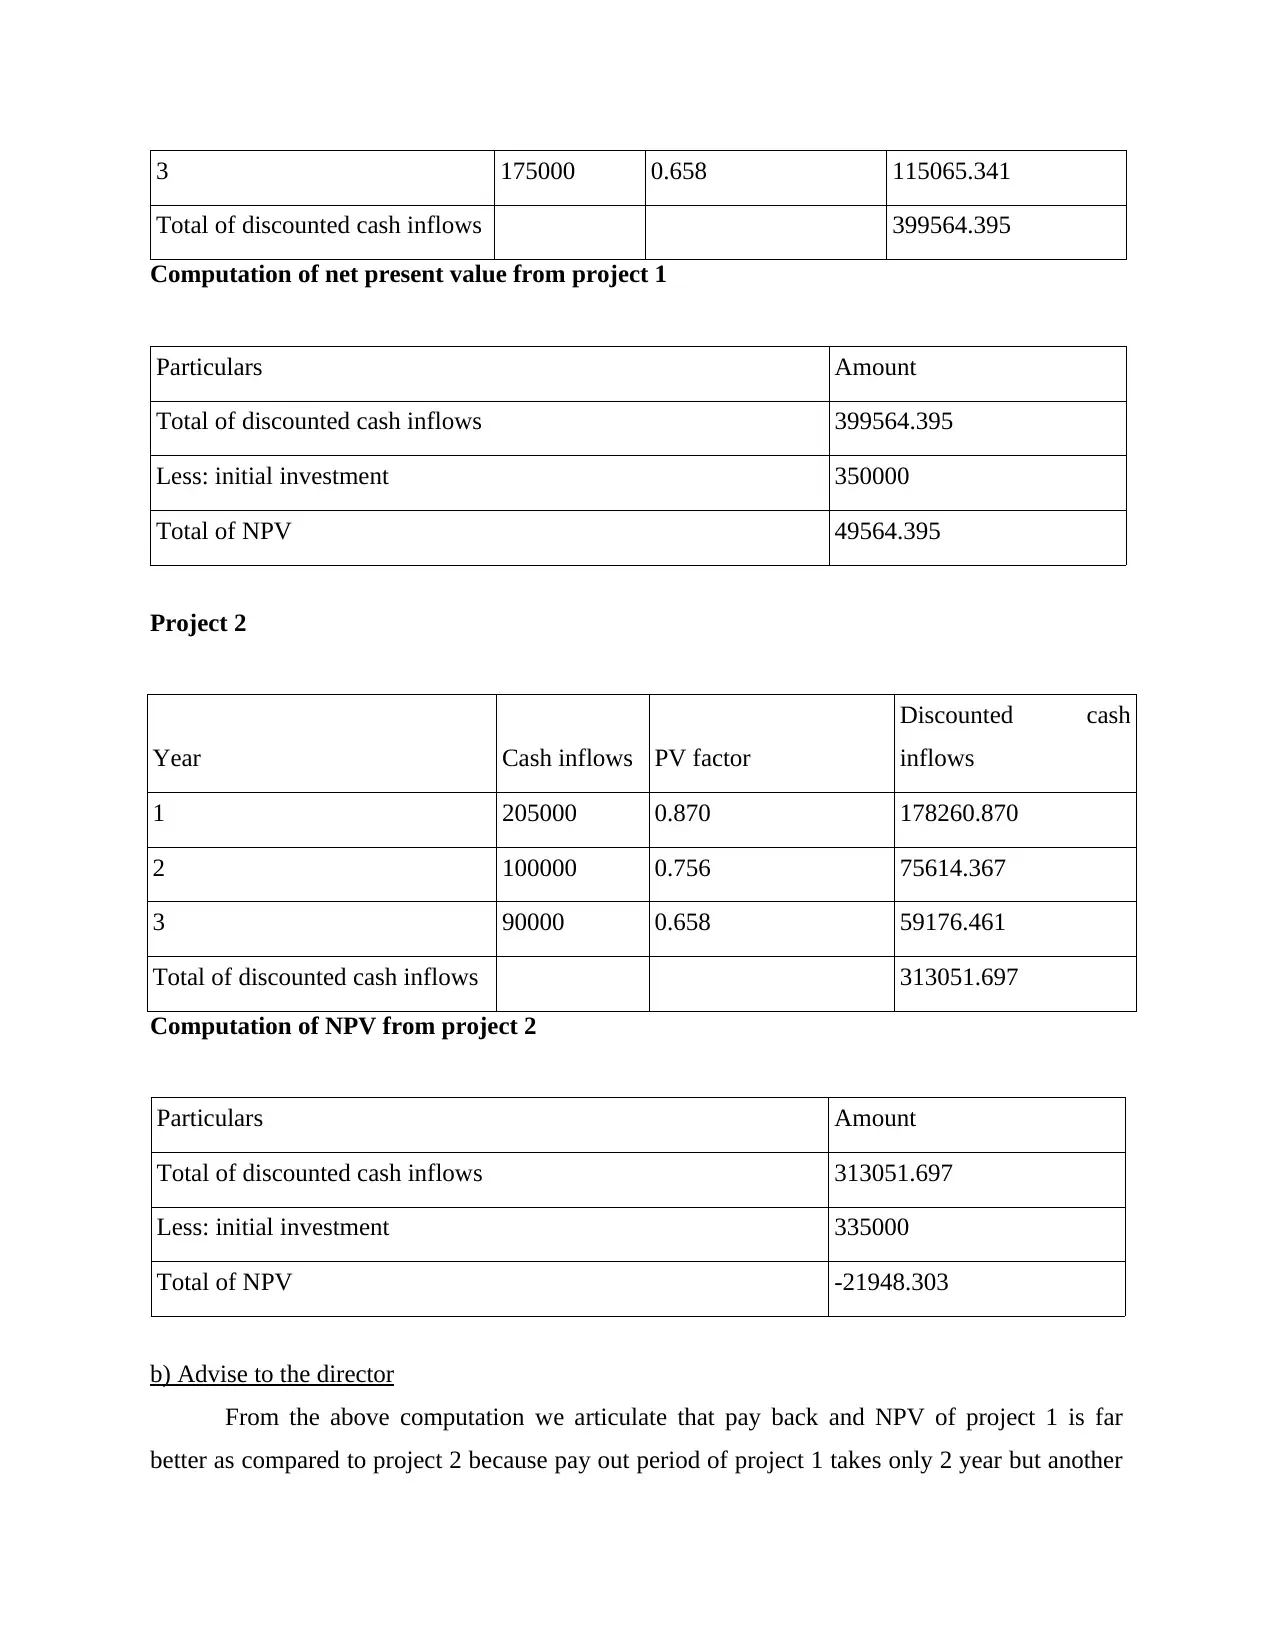
3 175000 0.658 115065.341
Total of discounted cash inflows 399564.395
Computation of net present value from project 1
Particulars Amount
Total of discounted cash inflows 399564.395
Less: initial investment 350000
Total of NPV 49564.395
Project 2
Year Cash inflows PV factor
Discounted cash
inflows
1 205000 0.870 178260.870
2 100000 0.756 75614.367
3 90000 0.658 59176.461
Total of discounted cash inflows 313051.697
Computation of NPV from project 2
Particulars Amount
Total of discounted cash inflows 313051.697
Less: initial investment 335000
Total of NPV -21948.303
b) Advise to the director
From the above computation we articulate that pay back and NPV of project 1 is far
better as compared to project 2 because pay out period of project 1 takes only 2 year but another
Total of discounted cash inflows 399564.395
Computation of net present value from project 1
Particulars Amount
Total of discounted cash inflows 399564.395
Less: initial investment 350000
Total of NPV 49564.395
Project 2
Year Cash inflows PV factor
Discounted cash
inflows
1 205000 0.870 178260.870
2 100000 0.756 75614.367
3 90000 0.658 59176.461
Total of discounted cash inflows 313051.697
Computation of NPV from project 2
Particulars Amount
Total of discounted cash inflows 313051.697
Less: initial investment 335000
Total of NPV -21948.303
b) Advise to the director
From the above computation we articulate that pay back and NPV of project 1 is far
better as compared to project 2 because pay out period of project 1 takes only 2 year but another
⊘ This is a preview!⊘
Do you want full access?
Subscribe today to unlock all pages.
Trusted by 1+ million students worldwide
1 out of 15
Related Documents


Your All-in-One AI-Powered Toolkit for Academic Success.
+13062052269
info@desklib.com
Available 24*7 on WhatsApp / Email
![[object Object]](/_next/static/media/star-bottom.7253800d.svg)
Unlock your academic potential
Copyright © 2020–2026 A2Z Services. All Rights Reserved. Developed and managed by ZUCOL.