Financial Analysis Report: Comprehensive Financial Review

Verified

Added on  2020/05/28

|6
|857
|39
Report
AI Summary
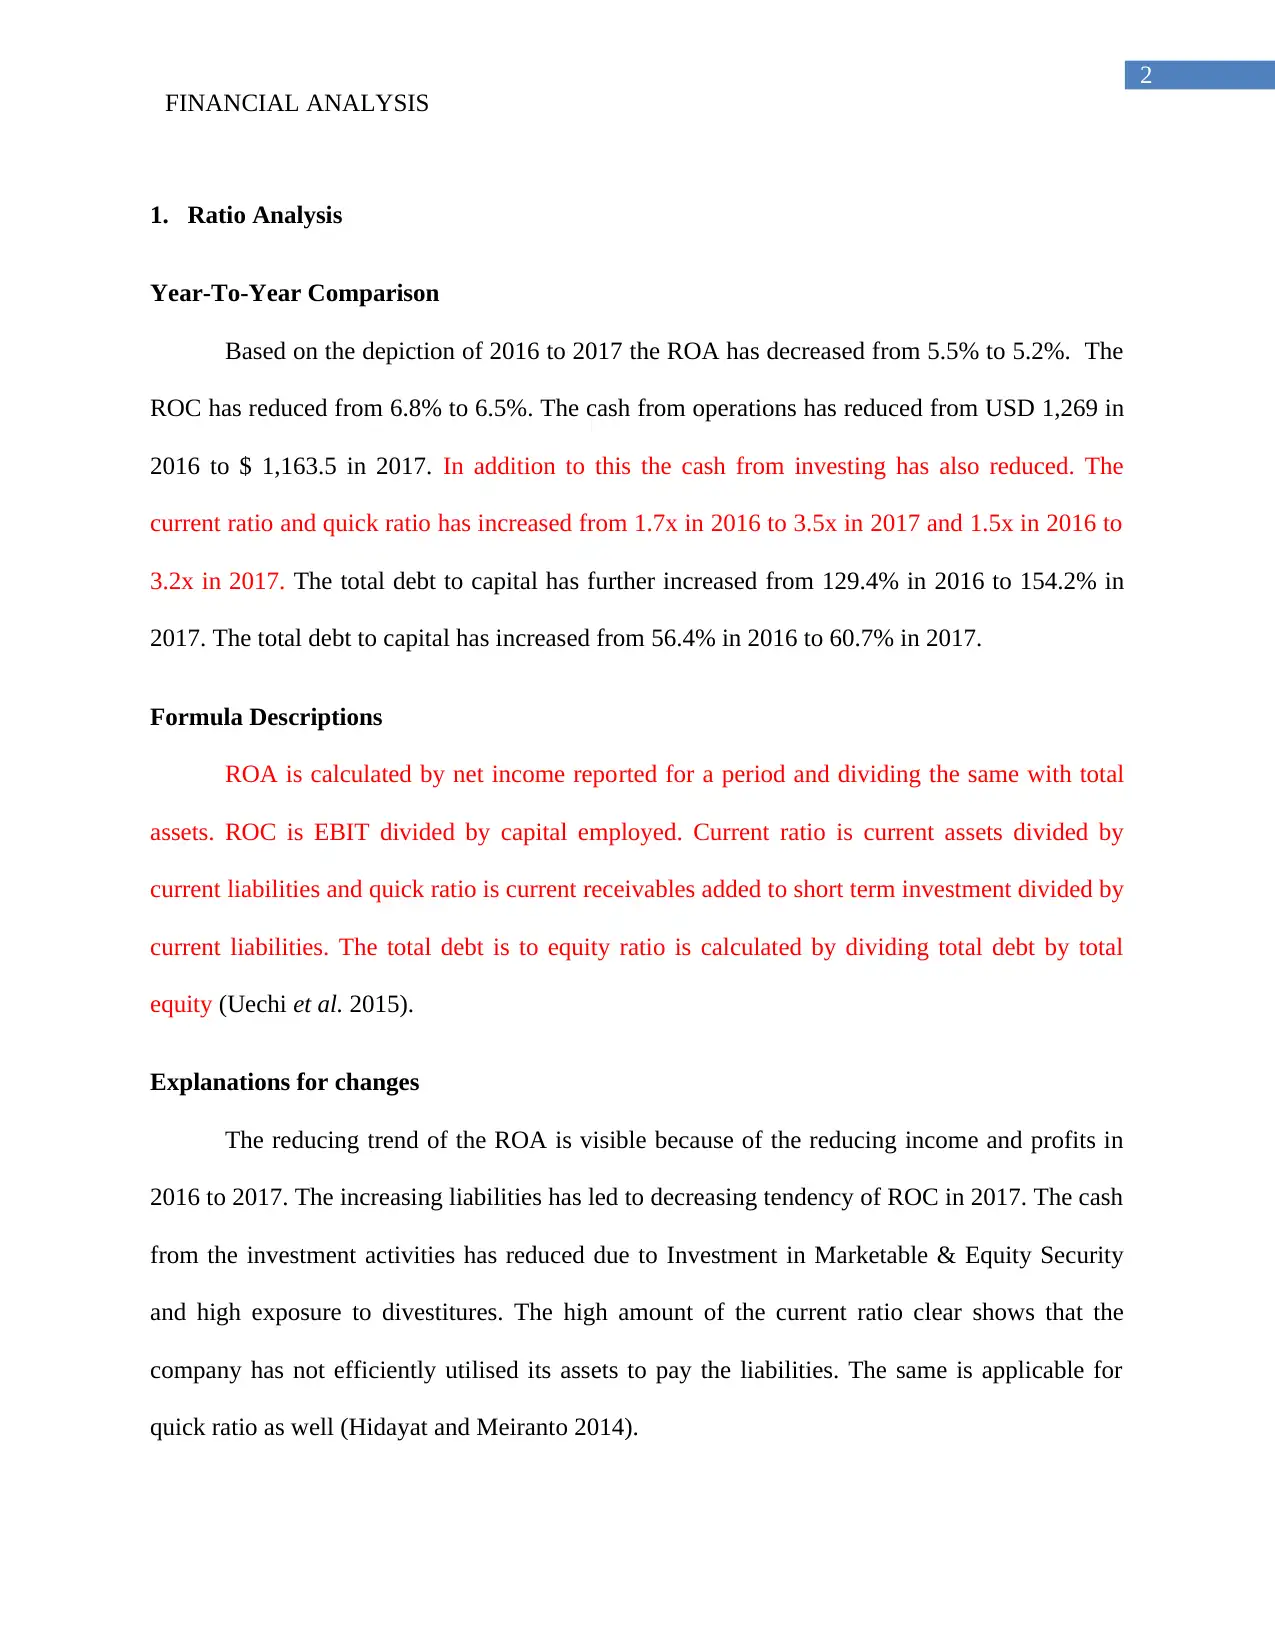
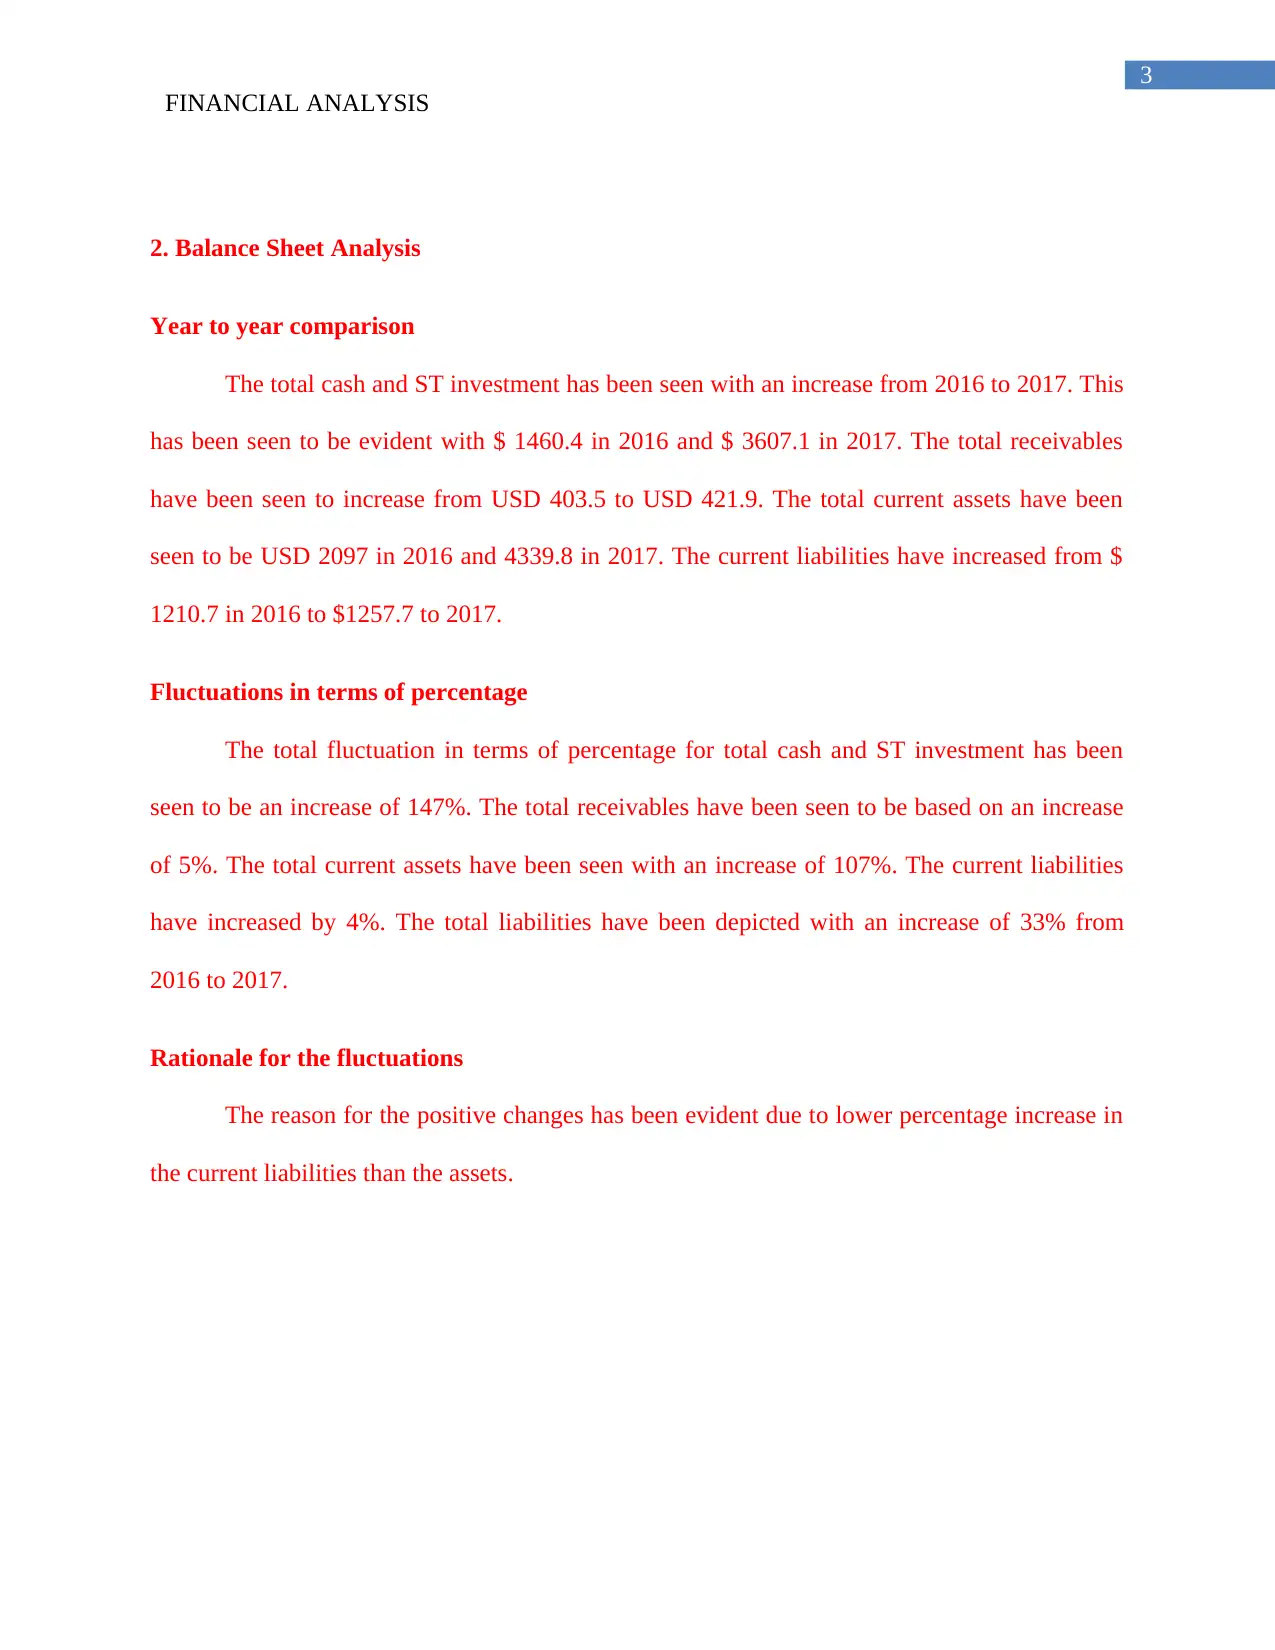
This financial analysis report examines a company's performance from 2016 to 2017, focusing on ratio analysis, balance sheet, and income statement analysis. The report begins with an overview of key financial ratios like ROA, ROC, current ratio, and debt to capital, comparing their values across the two years and explaining the observed changes. The balance sheet analysis highlights fluctuations in total cash, investments, receivables, current assets, and liabilities, providing percentage changes and underlying rationales. Finally, the income statement analysis explores changes in total revenue, gross profit, operating expenses, and operating income, offering percentage increases and explanations for the trends. The report utilizes financial formulas and provides references to support its findings, offering a comprehensive view of the company's financial health and performance over the specified period.
Document Page
Running head: FINANCIAL ANALYSIS
Financial Analysis
Name of Student:
Name of University:
Author’s Note:
tabler-icon-diamond-filled.svg

Paraphrase This Document

Need a fresh take? Get an instant paraphrase of this document with our AI Paraphraser
Document Page
1
FINANCIAL ANALYSIS
Table of Contents
1. Ratio Analysis..........................................................................................................................2
Year-To-Year Comparison..........................................................................................................2
Formula Descriptions...................................................................................................................2
Explanations for changes.............................................................................................................2
2. Balance Sheet Analysis................................................................................................................3
Year to year comparison..............................................................................................................3
Fluctuations in terms of percentage.............................................................................................3
Rationale for the fluctuations.......................................................................................................3
3. Income statement analysis...........................................................................................................3
Year to year comparison..............................................................................................................3
Fluctuations in terms of percentage.............................................................................................4
Rationale for the fluctuations.......................................................................................................4
Reference List..................................................................................................................................5
Document Page
2
FINANCIAL ANALYSIS
1. Ratio Analysis
Year-To-Year Comparison
Based on the depiction of 2016 to 2017 the ROA has decreased from 5.5% to 5.2%. The
ROC has reduced from 6.8% to 6.5%. The cash from operations has reduced from USD 1,269 in
2016 to $ 1,163.5 in 2017. In addition to this the cash from investing has also reduced. The
current ratio and quick ratio has increased from 1.7x in 2016 to 3.5x in 2017 and 1.5x in 2016 to
3.2x in 2017. The total debt to capital has further increased from 129.4% in 2016 to 154.2% in
2017. The total debt to capital has increased from 56.4% in 2016 to 60.7% in 2017.
Formula Descriptions
ROA is calculated by net income reported for a period and dividing the same with total
assets. ROC is EBIT divided by capital employed. Current ratio is current assets divided by
current liabilities and quick ratio is current receivables added to short term investment divided by
current liabilities. The total debt is to equity ratio is calculated by dividing total debt by total
equity (Uechi et al. 2015).
Explanations for changes
The reducing trend of the ROA is visible because of the reducing income and profits in
2016 to 2017. The increasing liabilities has led to decreasing tendency of ROC in 2017. The cash
from the investment activities has reduced due to Investment in Marketable & Equity Security
and high exposure to divestitures. The high amount of the current ratio clear shows that the
company has not efficiently utilised its assets to pay the liabilities. The same is applicable for
quick ratio as well (Hidayat and Meiranto 2014).
Document Page
3
FINANCIAL ANALYSIS
2. Balance Sheet Analysis
Year to year comparison
The total cash and ST investment has been seen with an increase from 2016 to 2017. This
has been seen to be evident with $ 1460.4 in 2016 and $ 3607.1 in 2017. The total receivables
have been seen to increase from USD 403.5 to USD 421.9. The total current assets have been
seen to be USD 2097 in 2016 and 4339.8 in 2017. The current liabilities have increased from $
1210.7 in 2016 to $1257.7 to 2017.
Fluctuations in terms of percentage
The total fluctuation in terms of percentage for total cash and ST investment has been
seen to be an increase of 147%. The total receivables have been seen to be based on an increase
of 5%. The total current assets have been seen with an increase of 107%. The current liabilities
have increased by 4%. The total liabilities have been depicted with an increase of 33% from
2016 to 2017.
Rationale for the fluctuations
The reason for the positive changes has been evident due to lower percentage increase in
the current liabilities than the assets.
tabler-icon-diamond-filled.svg

Paraphrase This Document

Need a fresh take? Get an instant paraphrase of this document with our AI Paraphraser
Document Page
4
FINANCIAL ANALYSIS
3. Income statement analysis
Year to year comparison
The year to year comparison of total revenue has shown an increase of total revenue from
$ 4145.8 in 2016 to $ 4453.3 in 2017. The gross profit has shown an increase from $1964.4 in
2016 to $ 2161 in 2017. The other operating expenses has shown an increase from $ 302.3 in
2016 to 353.2 in 2017. The operating income has hiked from $ 1662.1 in 2016 to $ 1807.8 in
2017.
Fluctuations in terms of percentage
Revenue has been depicted with a percentage increase of 7%. The percentage increase in the
gross profit has been seen with 10%. The percentage increase in the operating income has been
seen to be 9%.
Rationale for the fluctuations
The rationale for the increasing gross profit, operating income and total revenue is due to
higher return from sales and thin increase in cost of goods sold.
Document Page
5
FINANCIAL ANALYSIS
Reference List
Hidayat, M. A. and Meiranto, W. (2014) ‘Prediksi Financial Distress Perusahaan Manufaktur Di
Indonesia’, Diponegoro Journal of Accounting, 3(ISSN (Online): 2337-3806), pp. 1–11.
Uechi, L., Akutsu, T., Stanley, H. E., Marcus, A. J. and Kenett, D. Y. (2015) ‘Sector dominance
ratio analysis of financial markets’, Physica A: Statistical Mechanics and its Applications, 421,
pp. 488–509. doi: 10.1016/j.physa.2014.11.055.
chevron_up_icon
1 out of 6
circle_padding
hide_on_mobile
zoom_out_icon
[object Object]