Financial Performance Analysis: H&R REIT vs. RioCan - 2016-2017

Verified

Added on  2021/04/21

|10
|1635
|16
Report
AI Summary
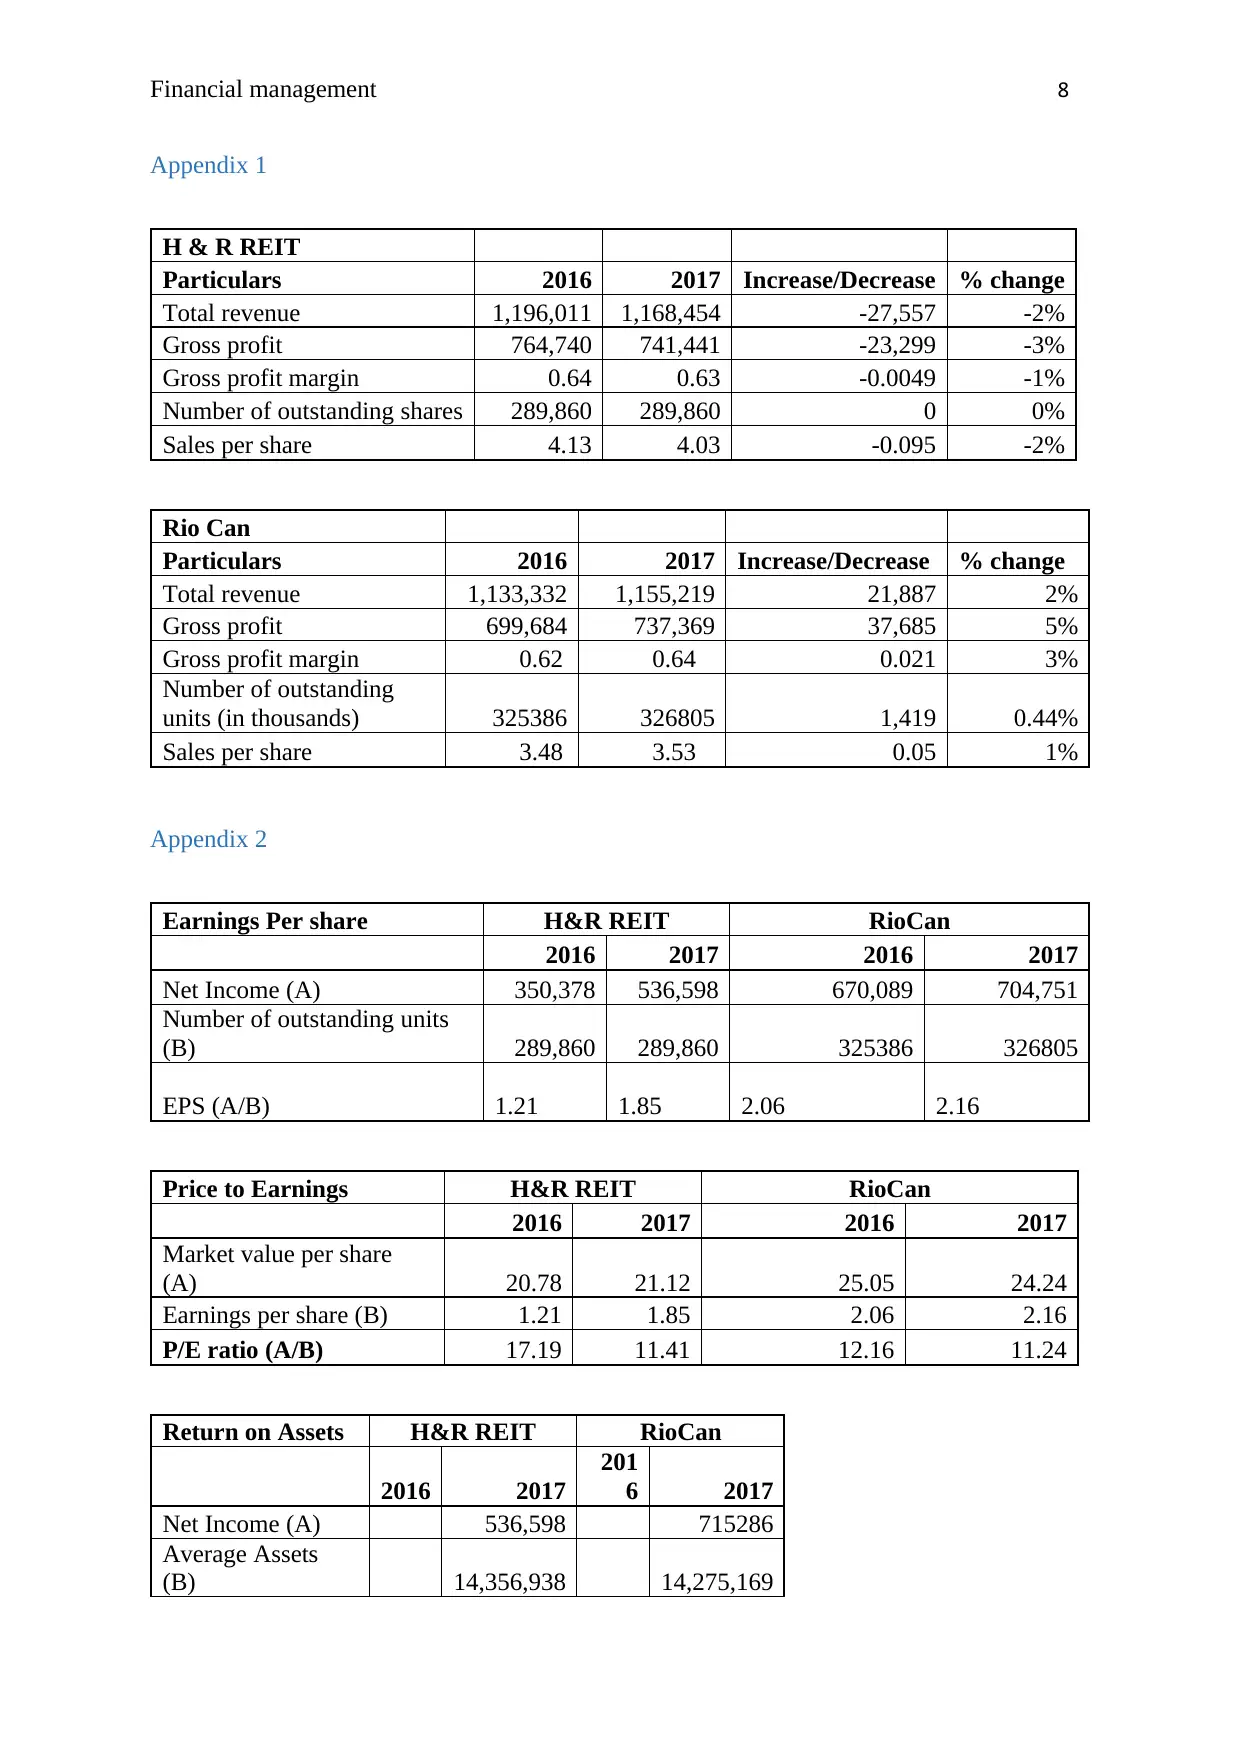
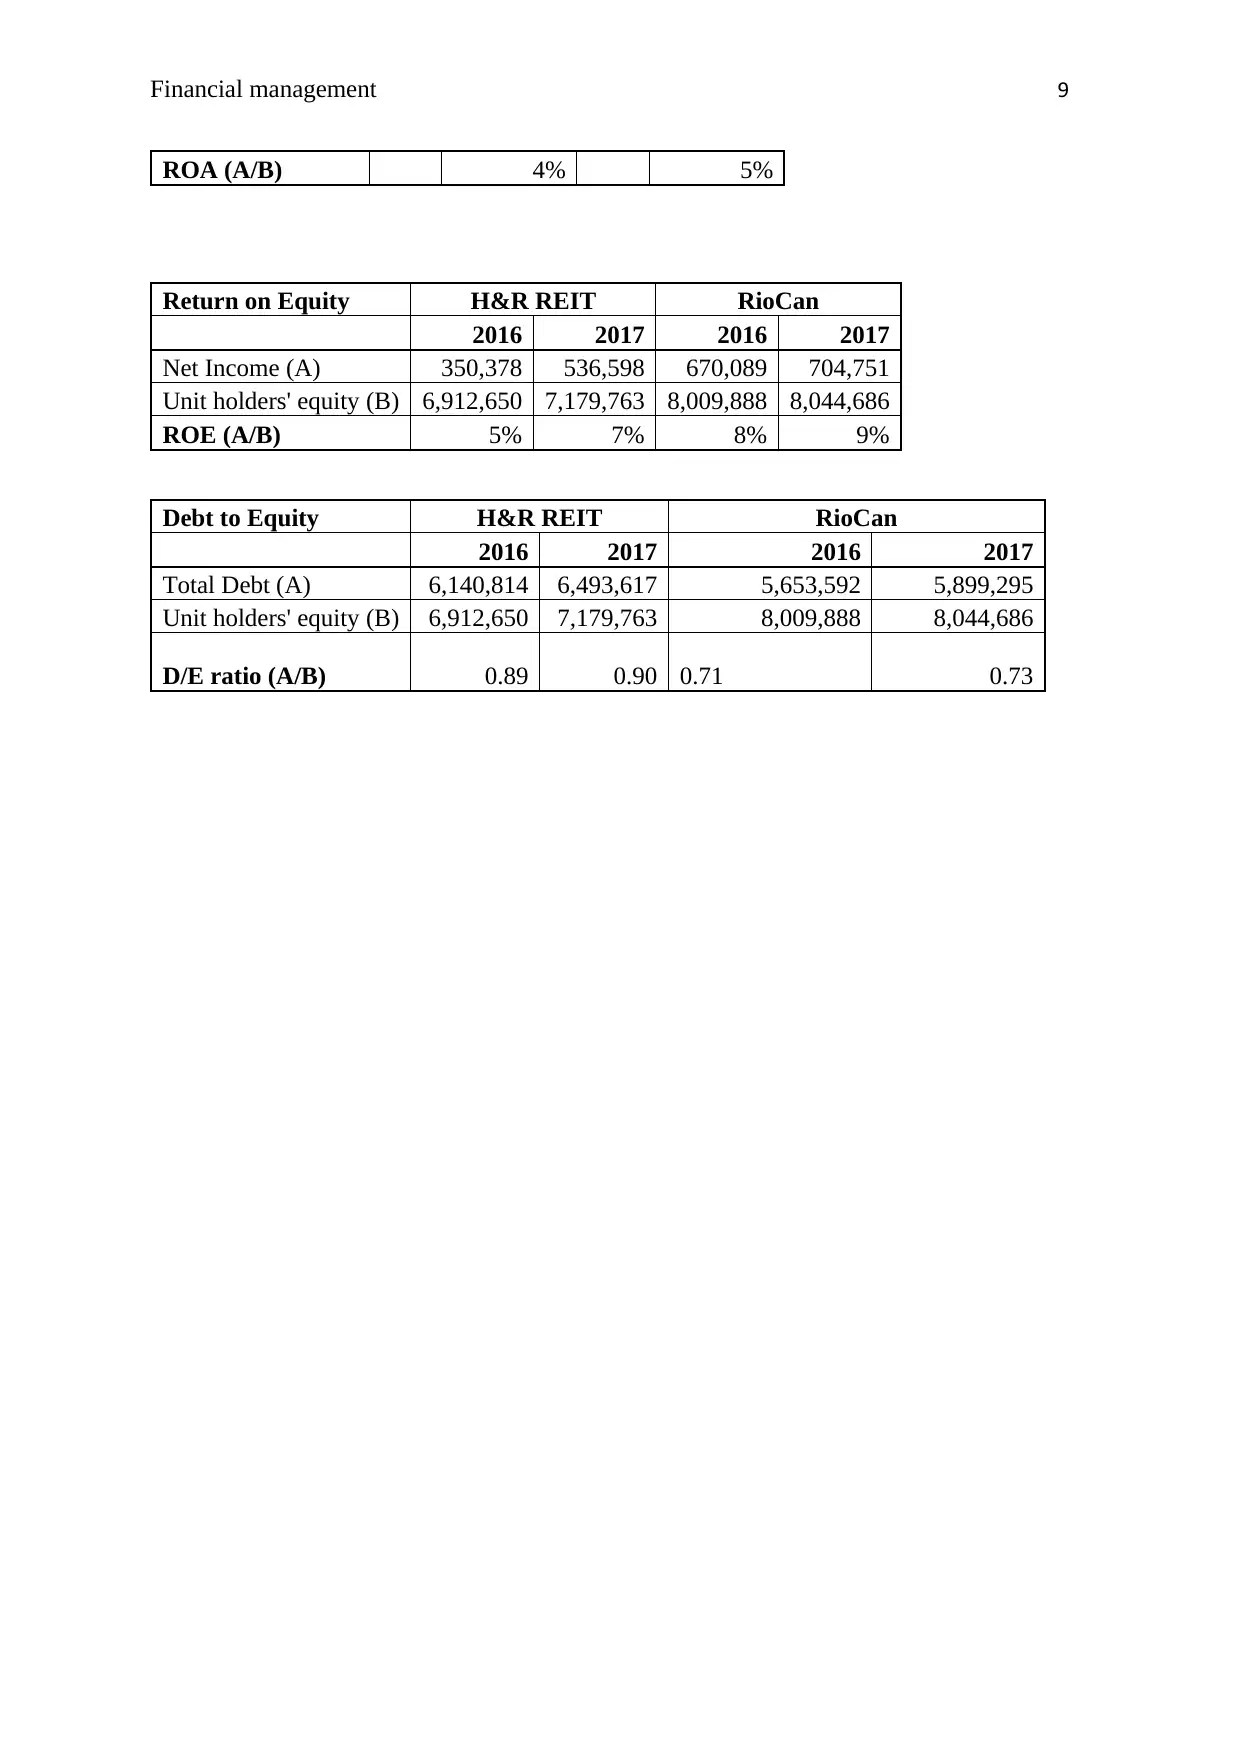
This report presents a comprehensive financial analysis of H&R REIT and RioCan, two real estate investment trusts, for the years 2016 and 2017. The analysis includes both horizontal and ratio analysis techniques. Horizontal analysis examines the changes in financial statement items over the two-year period, focusing on total revenue, sales per common share, and gross profit margin. Ratio analysis calculates and interprets key financial ratios, such as earnings per share (EPS), price-to-earnings (P/E) ratio, return on assets (ROA), return on equity (ROE), and debt-to-equity (D/E) ratio, to assess the companies' profitability, efficiency, and financial leverage. The report concludes with a comparison of the two companies' financial performances and provides a recommendation for investment purposes, suggesting that RioCan has performed better than H&R REIT. The appendices include detailed financial data and ratio calculations.
Document Page
RUNNING HEAD: FINANCIAL MANAGEMENT
Financial analysis
tabler-icon-diamond-filled.svg

Paraphrase This Document

Need a fresh take? Get an instant paraphrase of this document with our AI Paraphraser
Document Page
Financial management 1
Contents
Introduction................................................................................................................................2
H & R Real Estate Investment Trust..........................................................................................2
Rio-Can......................................................................................................................................3
Horizontal analysis.....................................................................................................................4
Ratio analysis.............................................................................................................................4
Conclusion and recommendation...............................................................................................5
References..................................................................................................................................6
Appendix 1.................................................................................................................................7
Appendix 2.................................................................................................................................7
Document Page
Financial management 2
Introduction
The report contains the analysis of the financial statements of H&R REIT and RioCan which
includes ratio and horizontal analysis. It also includes the recommendation and conclusion
part which deals with the findings of the analysis.
H & R Real Estate Investment Trust
Income statement for the year 2016-2017
(In thousands of Canadian dollars) 2016 2017
Property operating income:
Rentals from investment properties 1,196,011 1,168,454
Property operating costs -431,271 -427,013
764,740 741,441
Net income from equity accounted investments 48,341 167,407
Other income 20,353 1,040
Finance cost - operations -287,325 -270,358
Finance income 4,715 4,999
Fair value adjustments on financial instruments -33,830 27,049
Trust expenses -29,852 -18,111
Fair value adjustment on real estate assets 133,738 1,796
Loss on sale of real estate assets, net of related costs -8,167 -7729
Gain (loss) on foreign exchange -8,944 -17,903
Transaction costs -13,483 0
Net income before income taxes 590,286 629,631
Income tax recovery (expense) -201,541 38,239
Net income 388,745 667,870
Other comprehensive income (loss): -38,367 -131,272
Total comprehensive income all attributable to unit
holders 350,378 536,598
Balance sheet 2016-2017
(In thousands of Canadian dollars) 2016 2017
Assets
Real estate assets:
Investment properties 12,564,144 13,074,123
Properties under development 118,268 83,132
12,682,412 13,157,255
Equity accounted investments 1,051,187 1,125,135
Document Page
Financial management 3
Assets classified as held for sale 211,550 0
Other assets 161,842 234,189
Cash and cash equivalents 48,021 42,284
Total Assets 14,155,012 14,558,863
Liabilities and Unit holders' Equity
Liabilities
Mortgages payable 4,001,451 3,958,631
Debentures payable 1,491,591 1,852,790
Exchangeable units 370,533 341,321
Deferred tax liability 386,775 325,131
Liabilities classified as held for sale 126,815 0
Bank indebtedness 647,772 682,196
Accounts payable and accrued liabilities 217,425 219,031
7,242,362 7,379,100
Unit holders' equity 6,912,650 7,179,763
Total Liabilities and Equity 14,155,012 14,558,863
Rio-Can
Income statement for the year 2016-2017
(In thousands of Canadian dollars) 2016 2017
Revenue
Rentals from investment properties 1,103,884 1,140,665
Property and asset management fees 13,186 14,554
Residential inventory sales 16,262 0
1,133,332 1,155,219
Operating costs
Rental operating costs
Recoverable under tenant leases 397,776 399,580
Non-recoverable costs 19,684 18,270
Residential inventory cost of sales 16,188 0
433,648 417,850
Operating income 699,684 737,369
Other income
Interest income 5,744 7,586
Income from equity accounted investments 9,972 15,719
Fair value gains on investment properties,
net 182,888 136,942
Investment and other income 33,268 57,014
231,872 217,261
Other expenses
Interest costs 179,527 171,418
General and administrative 52,220 52,560
Internal leasing costs 10,931 10,882
tabler-icon-diamond-filled.svg

Paraphrase This Document

Need a fresh take? Get an instant paraphrase of this document with our AI Paraphraser
Document Page
Financial management 4
Transaction and other costs 9,577 11,825
252,255 246,685
Income before income taxes 679,301 707,945
Deferred income tax recovery 3,850 320
Net income from discontinued operations 147,687 7,021
Net income 830,838 715,286
Balance sheet 2016-2017
(In thousands of Canadian dollars) 2016 2017
Assets
Investment properties 13,287,038 13,160,244
Deferred tax assets 11,609 11,929
Equity accounted investments 185,278 176,256
Mortgages and loans receivable 118,017 145,873
Residential inventory 48,414 132,003
Assets classified as held for sale 60,530 410,178
Receivables and other assets 408,508 269,870
Cash and cash equivalents 54,336 70,225
Total Assets 14,173,760 14,376,578
Liabilities and Unit holders' Equity
Liabilities
Mortgages payable 3,405,568 2,300,247
Debentures payable 2,248,024 2,694,619
Bank loans 0 904,429
Liabilities classified as held for sale 0 32,670
Accounts payable and accrued liabilities 510,280 399,927
6,163,872 6,331,892
Unit holders' equity 8,009,888 8,044,686
Total Liabilities and Equity 14,173,760 14,376,578
Horizontal analysis
Referring to Appendix 1, a horizontal analysis of following three items is done for H&R
REIT and RioCan:
ï‚· Total revenue: As per the analysis, it can be said that there is a 2% decrease in the
revenue of H&R REIT, whereas the same has been increased in case of Rio Can by
2% in 2017 (Weygandt, Kimmel and Kieso, 2009).
Document Page
Financial management 5
 Sales per common share: H&R REIT’s sales per share has also reduced by 2% and
Rio Can reported 1% increase in its sales per common share.
ï‚· Gross profit Margin: A decrease by 1% has been noticed in the gross profit of H&R
REIT. In contrast to it, Rio Can increases the same by 3% (Needles and Powers,
2010).
Ratio analysis
Referring to Appendix 2, following are the ratios calculated for both the companies, in order
to measure their performance.
ï‚· Earnings per share: RioCan EPS is more than H&R REIT EPS in both the years. It
was 2.06 and 2.16 in 2016 and 2017 respectively. Reason being, the net income
available to unit holders of RioCan is much more than that of H&R (Tracy, 2012).
 P/E Ratio: From investors’ point of view, high P/E ratio means company is offering
higher returns. H&R REIT has high P/E as compare to latter company, which means it
stocks are expensive and company may offer high returns on them (Leach, 2010).
ï‚· Dividend yield and Dividend Coverage: Both the companies has not declared any
dividend in the recent two years, which makes these ratios Zero.
 Return on Assets: It can be seen that RioCan’s ROA is more than that of H&R by 1%.
This is due to more income and less assets, in comparison with H&R.
 Return on Equity: RioCan’s ROE is also more than H&R, which means the company
provides more return to its unit holders. In 2017, it was 9% whereas for H&R, the
same was 7%. Reason behind this is difference in the net income of both the
companies is more than the difference between their unit holders’ equity (Sharan,
2015).
ï‚· Debt to Equity: D/E ratio of H&R REIT is more than RioCan, which means most of
the assets of the company are financed through debts. This is due to increase in the
Document Page
Financial management 6
overall debt over the year and as a result, it is risky to invest in such companies
(Vickerstaff and Johal, 2014).
Conclusion and recommendation
From the above report, it can be concluded that horizontal and ratio analysis are two most
appropriate tools, used for evaluating financial statements. It can be recommended that,
RioCan has performed very well as compare to H&R REIT. It can be taken into consideration
for investment purposes. So on a whole, it can be said that RioCan is the best option among
the two, for making investment.
tabler-icon-diamond-filled.svg

Paraphrase This Document

Need a fresh take? Get an instant paraphrase of this document with our AI Paraphraser
Document Page
Financial management 7
References
Leach, R., (2010). Ratios made simple: a beginner's guide to the key financial ratios. Britain:
Harriman House Limited.
Needles, B.E. and Powers, M. (2010). Financial accounting. 11th ed. USA: Cengage
Learning.
Sharan, V., (2015). Fundamentals of Financial Management. 3rd ed. New Delhi: Pearson
Education India.
Tracy, A. (2012). Ratio analysis fundamentals: how 17 financial ratios can allow you to
analyse any business on the planet. Ratio Analysis. Net.
Vickerstaff, B. and Johal, P. (2014). Financial Accounting. Routledge.
Weygandt, J.J., Kimmel, P.D. and Kieso, D.E. (2009). Managerial accounting: tools for
business decision making. 5th ed. USA: John Wiley & Sons.
Document Page
Financial management 8
Appendix 1
H & R REIT
Particulars 2016 2017 Increase/Decrease % change
Total revenue 1,196,011 1,168,454 -27,557 -2%
Gross profit 764,740 741,441 -23,299 -3%
Gross profit margin 0.64 0.63 -0.0049 -1%
Number of outstanding shares 289,860 289,860 0 0%
Sales per share 4.13 4.03 -0.095 -2%
Rio Can
Particulars 2016 2017 Increase/Decrease % change
Total revenue 1,133,332 1,155,219 21,887 2%
Gross profit 699,684 737,369 37,685 5%
Gross profit margin 0.62 0.64 0.021 3%
Number of outstanding
units (in thousands) 325386 326805 1,419 0.44%
Sales per share 3.48 3.53 0.05 1%
Appendix 2
Earnings Per share H&R REIT RioCan
2016 2017 2016 2017
Net Income (A) 350,378 536,598 670,089 704,751
Number of outstanding units
(B) 289,860 289,860 325386 326805
EPS (A/B) 1.21 1.85 2.06 2.16
Price to Earnings H&R REIT RioCan
2016 2017 2016 2017
Market value per share
(A) 20.78 21.12 25.05 24.24
Earnings per share (B) 1.21 1.85 2.06 2.16
P/E ratio (A/B) 17.19 11.41 12.16 11.24
Return on Assets H&R REIT RioCan
2016 2017
201
6 2017
Net Income (A) 536,598 715286
Average Assets
(B) 14,356,938 14,275,169
Document Page
Financial management 9
ROA (A/B) 4% 5%
Return on Equity H&R REIT RioCan
2016 2017 2016 2017
Net Income (A) 350,378 536,598 670,089 704,751
Unit holders' equity (B) 6,912,650 7,179,763 8,009,888 8,044,686
ROE (A/B) 5% 7% 8% 9%
Debt to Equity H&R REIT RioCan
2016 2017 2016 2017
Total Debt (A) 6,140,814 6,493,617 5,653,592 5,899,295
Unit holders' equity (B) 6,912,650 7,179,763 8,009,888 8,044,686
D/E ratio (A/B) 0.89 0.90 0.71 0.73
chevron_up_icon
1 out of 10
circle_padding
hide_on_mobile
zoom_out_icon
[object Object]