Financial Performance Analysis of Apollo Tourism and Leisure Limited
VerifiedAdded on 2019/10/30
|31
|4544
|159
Report
AI Summary
This report presents a comprehensive financial analysis of Apollo Tourism and Leisure Limited (ATL). It begins with an introduction to the company, including its CEO, home office, products, and auditors. The report then delves into the industry situation and ATL's future plans, highlighting the growth in the tourism sector. The core of the analysis focuses on ATL's financial statements, including the statement of financial performance, statement of financial position, and statement of cash flows, examining trends in gross profit, net income, and key accounting policies. Ratio analysis is conducted to assess liquidity, profitability, long-term solvency, and cash flow adequacy. The report uses trend analysis techniques and compares ATL's performance to industry norms. The conclusion summarizes the findings, provides recommendations, and evaluates ATL's overall performance, with a rationale for the analysis and findings. The report also includes appendices with supporting data and calculations.
Running head: INTRODUCTION TO ACCOUNTING AND FINANCE
Introduction to Accounting and Finance
Name of the Student:
Name of the University:
Author’s Note:
Course ID:
Introduction to Accounting and Finance
Name of the Student:
Name of the University:
Author’s Note:
Course ID:
Paraphrase This Document
Need a fresh take? Get an instant paraphrase of this document with our AI Paraphraser
1INTRODUCTION TO ACCOUNTING AND FINANCE
Table of Contents
1. Introduction:................................................................................................................................4
1.1 Name of CEO:.......................................................................................................................4
1.2 Home office:..........................................................................................................................4
1.3 Ending date of the latest financial year:................................................................................4
1.4 Principal products or services:...............................................................................................4
1.5 Main geographic area of activity:..........................................................................................4
1.6 Independent auditor and its view about the financial statements:.........................................4
1.7 Recent stock price and dividend per share:...........................................................................5
2. Industry situation and organisational plans:................................................................................5
2.1 Industry and its outlook:........................................................................................................5
2.2 Future plans of the organisation:...........................................................................................5
3. Financial statement analysis:.......................................................................................................6
3.1 Statement of financial performance:......................................................................................6
3.1.1 Gross profit, income from operations and net income for the past five years along with
increase or decrease in amounts:.............................................................................................6
3.1.2 Trend analysis technique:...............................................................................................7
3.1.3 Significant accounting policies:......................................................................................7
3.1.4 Trends and items different from the industry norms:.....................................................7
2INTRODUCTION TO ACCOUNTING AND FINANCE
3.2 Statement of financial position:.............................................................................................7
3.2.1 Validity of accounting equation for the past three years:...............................................7
3.2.2 Trend analysis technique:...............................................................................................8
3.2.3 Significant accounting policies:......................................................................................8
3.2.4 Trends and items different from the industry norms:.....................................................8
3.3 Statement of cash flows:........................................................................................................8
3.3.1 Comparison of operating cash flows with net income:..................................................8
3.3.2 Expansion through investing activities:..........................................................................9
3.3.3 Most important source of financing:...............................................................................9
3.3.4 Increase or decrease in cash over the past years:............................................................9
3.4 Ratio analysis:......................................................................................................................10
3.4.1 Liquidity ratios:............................................................................................................10
3.4.2 Profitability ratios:........................................................................................................10
3.4.3 Long-term solvency ratios:...........................................................................................10
3.4.4 Cash flow adequacy:.....................................................................................................11
3.4.5 Market strength ratios:..................................................................................................11
4. Conclusion:................................................................................................................................11
4.1 Summary of findings and recommendations:......................................................................11
4.2 Performance of the organisation based on analysis:............................................................12
4.3 Rationale for the decision:...................................................................................................12
⊘ This is a preview!⊘
Do you want full access?
Subscribe today to unlock all pages.
Trusted by 1+ million students worldwide
3INTRODUCTION TO ACCOUNTING AND FINANCE
References:....................................................................................................................................13
Appendices:...................................................................................................................................15
References:....................................................................................................................................13
Appendices:...................................................................................................................................15
Paraphrase This Document
Need a fresh take? Get an instant paraphrase of this document with our AI Paraphraser
4INTRODUCTION TO ACCOUNTING AND FINANCE
1. Introduction:
The organisation that has been selected here to fit the purpose of this assignment is
Apollo Tourism and Leisure Limited (ATL).
1.1 Name of CEO:
From the annual report of the organisation, Luke Trouchet is the CEO and Managing
Director after the person has worked as Sales and Marketing Manager in the organisation for five
years.
1.2 Home office:
The home office of ATL is located at 698 Nudgee Road, Northgate QLD 4013 in
Queensland, Victoria.
1.3 Ending date of the latest financial year:
The ending date of the latest financial year for ATL is 30th June 2017.
1.4 Principal products or services:
The principal products or services of ATL include manufacturing, sales, rental and
distribution of a group of RVs like campervans, motor homes and caravans.
1.5 Main geographic area of activity:
The major areas of operations of ATL comprise of Australia, New Zealand and USA.
1.6 Independent auditor and its view about the financial statements:
The independent auditor of ATL has been identified as KPMG and according to its view;
the financial reports of the organisation comply with the Corporations Act 2001, as they provide
5INTRODUCTION TO ACCOUNTING AND FINANCE
a fair and true depiction of the overall financial position and performance of the organisation. In
addition, the consolidated financial statements are prepared in accordance with the International
Financial Reporting Standards (IFRS) and Corporations Regulations 2001.
1.7 Recent stock price and dividend per share:
The most recent stock price of ATL is obtained as $1.39 as on 30th September 2017. The
dividend per share of the organisation has been obtained as $0.02 as on 30th June 2017.
2. Industry situation and organisational plans:
2.1 Industry and its outlook:
It has been observed that tourism and leisure sector of Australia has experienced a
significant growth in 2017 despite the moderations associated with the global economic
conditions. Some of the major insights into the industry are depicted as follows:
The global visitors in Australia have increased to 8.5 million with a percent increase of
8.9% in 2016 (Deloitte Australia 2017).
The growth in trips related to the domestic front has minimised since February 2017
coupled with corporate travel uptick inadequate in countering the growth stalling in travel
of domestic leisure.
The international economic conditions have become favourably oriented for the industry.
There has been modest performance of the hotel sector of Australia in the initial half of
2017, as the room occupancies have averaged 68% on the back of 0.3% growth.
⊘ This is a preview!⊘
Do you want full access?
Subscribe today to unlock all pages.
Trusted by 1+ million students worldwide
6INTRODUCTION TO ACCOUNTING AND FINANCE
2.2 Future plans of the organisation:
ATL has continued to invest considerable cost and time in its systems of information
technology for delivering cost savings and enhanced efficiencies. These systems are proprietary
in nature and the third party suppliers maintain them, while the other systems are operated under
licence. However, there is significant threat of cyber attacks or delay in internet or
communication facilities, it might have negative effect on the short-term financial position and
long-term effect on supplier and client satisfaction. In order to deal with such issues, the
organisation has put adequate safeguards and control in place for ensuring future progress and
growth in the market.
3. Financial statement analysis:
3.1 Statement of financial performance:
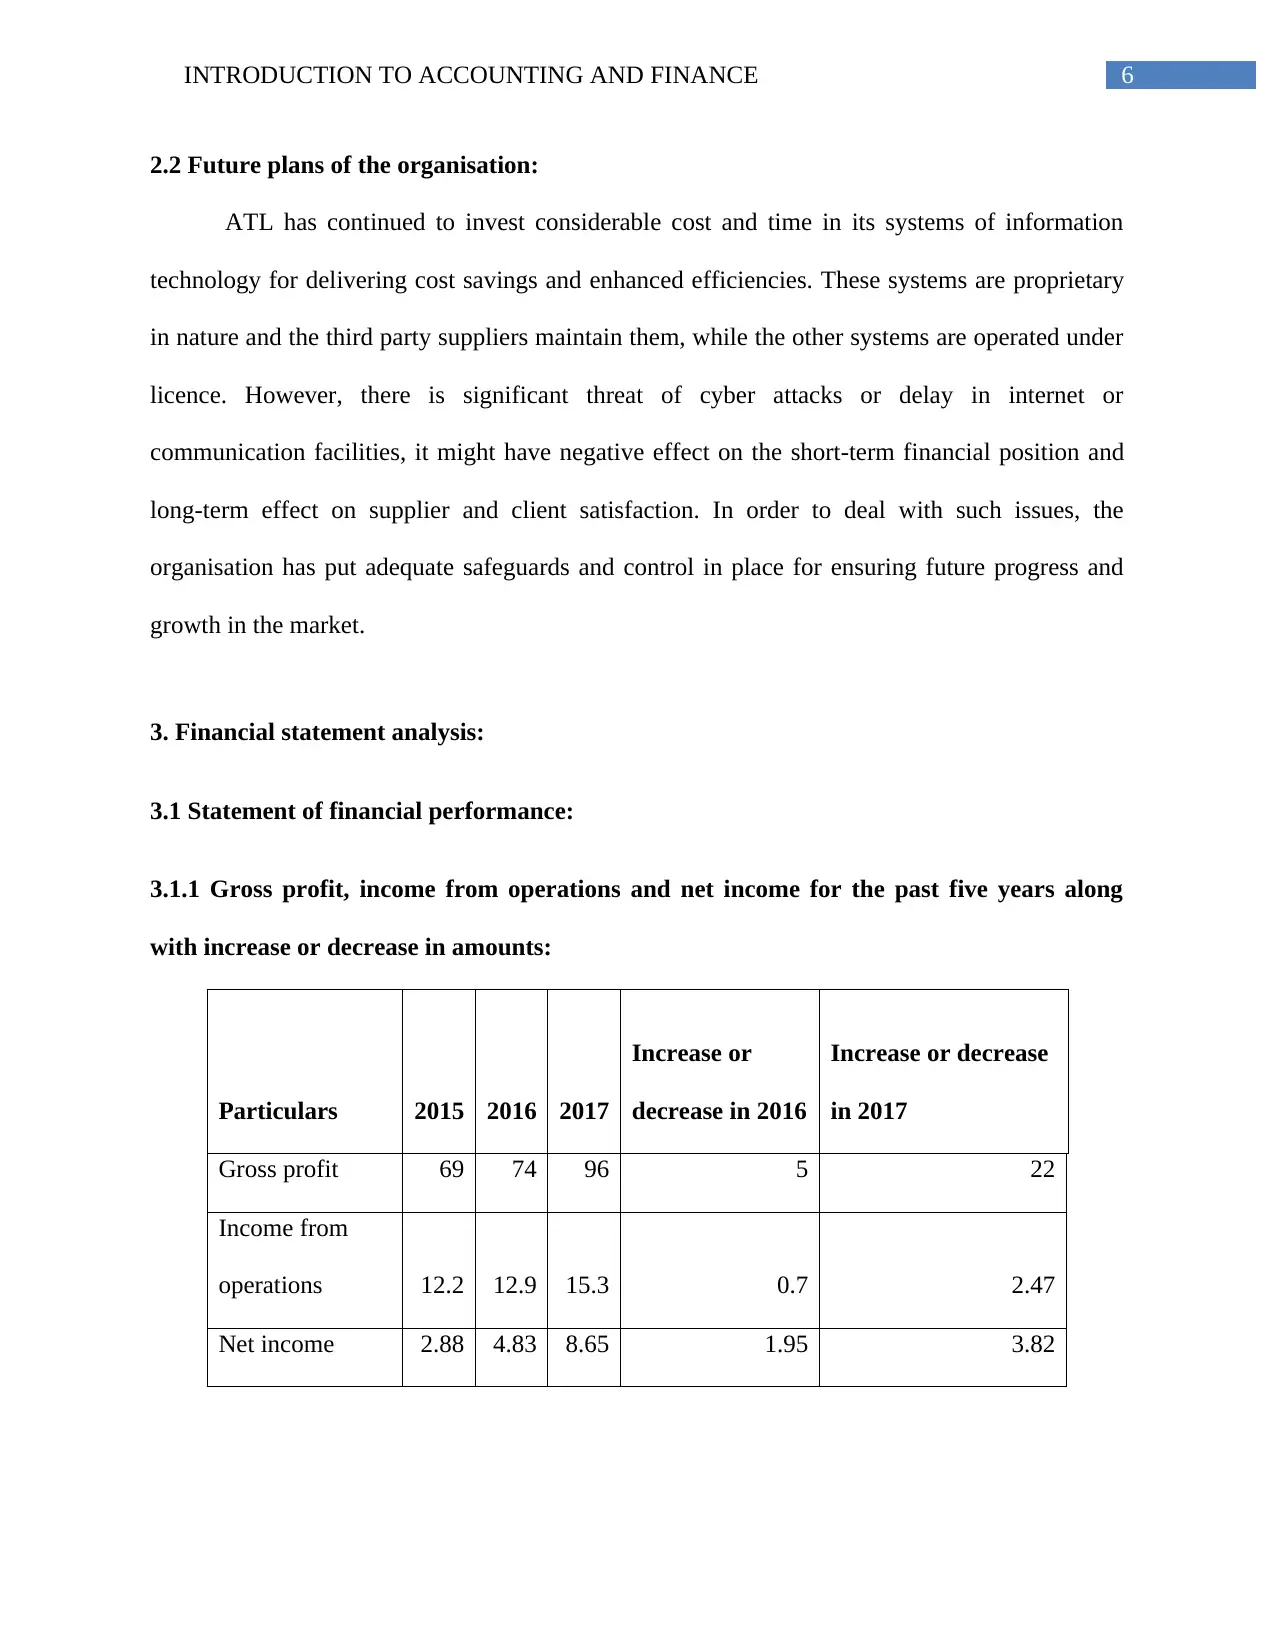
3.1.1 Gross profit, income from operations and net income for the past five years along
with increase or decrease in amounts:
Particulars 2015 2016 2017
Increase or
decrease in 2016
Increase or decrease
in 2017
Gross profit 69 74 96 5 22
Income from
operations 12.2 12.9 15.3 0.7 2.47
Net income 2.88 4.83 8.65 1.95 3.82
2.2 Future plans of the organisation:
ATL has continued to invest considerable cost and time in its systems of information
technology for delivering cost savings and enhanced efficiencies. These systems are proprietary
in nature and the third party suppliers maintain them, while the other systems are operated under
licence. However, there is significant threat of cyber attacks or delay in internet or
communication facilities, it might have negative effect on the short-term financial position and
long-term effect on supplier and client satisfaction. In order to deal with such issues, the
organisation has put adequate safeguards and control in place for ensuring future progress and
growth in the market.
3. Financial statement analysis:
3.1 Statement of financial performance:
3.1.1 Gross profit, income from operations and net income for the past five years along
with increase or decrease in amounts:
Particulars 2015 2016 2017
Increase or
decrease in 2016
Increase or decrease
in 2017
Gross profit 69 74 96 5 22
Income from
operations 12.2 12.9 15.3 0.7 2.47
Net income 2.88 4.83 8.65 1.95 3.82
Paraphrase This Document
Need a fresh take? Get an instant paraphrase of this document with our AI Paraphraser
7INTRODUCTION TO ACCOUNTING AND FINANCE
From the above table, it could be stated that the gross profit of ATL has increased over
the three-year period and the trend is inherent in case of operating income and net income as
well. This is because of the increased number of both domestic and global visitors in the nation.
3.1.2 Trend analysis technique:
The trend analysis technique of ATL has been presented in the form of a table (Refer to
Appendices, Appendix 4). From the table, it has been found that the revenue margin of the
organisation has increased heavily in 2017 along with the cost of sales. However, the gross
income has increased in tandem as well. Even though there is increase in overall operating
expenses over the years, the net income of the organisation has increased possibly due to the
rising demand and effective quality of services (Benson, Faff and Smith 2014).
3.1.3 Significant accounting policies:
The most significant accounting policies of ATL comprise of consolidation, in which the
control is accomplished at the time of exposure to variable returns from its association with the
investee and it has the ability to influence those returns through the investee power (Asx.com.au
2017).
3.1.4 Trends and items different from the industry norms:
Based on the above table, it could be identified that the organisation has presented the
items in accordance with the industrial norms and all the relevant disclosures have been made
accordingly.
8INTRODUCTION TO ACCOUNTING AND FINANCE
3.2 Statement of financial position:
3.2.1 Validity of accounting equation for the past three years:
In accordance with the balance sheet statement of the organisation (Refer to Appendices,
Appendix 2), it could be stated that the value of total assets stood at $161 million, $170 million
and $317 million in 2015, 2016 and 2017 respectively. On the other hand, the liabilities stood at
$135 million, $139 million and $215 million in 2015, 2016 and 2017 respectively. The equity
values stood at $161 million, $170 million and $317 million in 2015, 2016 and 2017
respectively. By adding up the liability and equity values, it is equal to the overall asset base.
3.2.2 Trend analysis technique:
The trend analysis technique of ATL has been presented in the form of a table (Refer to
Appendices, Appendix 5). It has been found that there is sufficient increase in total current assets
over the years due to the significant increase in cash and cash equivalents. The same trend is
observed in case of non-current assets and total assets with the increase in value of property,
plant and equipment (Cahan 2016).
3.2.3 Significant accounting policies:
The organisation uses the fair value measurement for gauging the financial instruments
like derivatives at fair value at each balance sheet date. The associate investment is a significant
accounting policy, in which the investment in associate is realised initially at cost (Brief and
Peasnell 2013).
⊘ This is a preview!⊘
Do you want full access?
Subscribe today to unlock all pages.
Trusted by 1+ million students worldwide
9INTRODUCTION TO ACCOUNTING AND FINANCE
3.2.4 Trends and items different from the industry norms:
Most of the organisations in the industry use historical cost method to measure the
financial instruments, while ATL uses fair value measurement for the same and this is the only
difference in relation to asset measurement (Brousseau et al. 2014).
3.3 Statement of cash flows:
3.3.1 Comparison of operating cash flows with net income:
According to the cash flow statement of the organisation, it could be evaluated that the
operating cash flows have been $17 million in 2015, which has increased to $24 million in 2016.
The increase is considerable in 2017, as the operating cash flows have been $66 million in 2017.
The similar trend is observed in case of net income as well, which denotes that the organisation
has focused on maximising its retained earnings base and the amount is used to invest in
operating activities. As a result, it has helped in increasing the overall cash flows from the
operating activities of the organisation (Cheng, Man and Yi 2013).
3.3.2 Expansion through investing activities:
From the cash flow statements of the organisation, it has been found that there has been
decline in capital expenditure over the years, which denotes that ATL has minimised its
expenditure on capital projects over the years. Thus, the expansion policy of the organisation has
been slowing down over the years.
3.3.3 Most important source of financing:
From the evaluation of the balance sheet statements of the organisation, it could be stated
that ATL relies more on debt financing, instead of equity financing. This is because the
organisation raises more funds through bank loans, since the investors are not willing to invest in
Paraphrase This Document
Need a fresh take? Get an instant paraphrase of this document with our AI Paraphraser
10INTRODUCTION TO ACCOUNTING AND FINANCE
the shares of the organisation due to undiversified product lines and services (Loughran and
McDonald 2016).
3.3.4 Increase or decrease in cash over the past years:
In accordance with the cash flow statement of the organisation, it could be stated that the
overall cash base has increased from $2.27 million in 2015 to $2.34 million in 2016 and the
increase is considerable in 2016, as it has been $43 million in 2017. This is because the
organisation has managed to minimise the payment time of the debtors; thus, resulting in
increased cash availability (McLaney and Atril 2014).
3.4 Ratio analysis:
3.4.1 Liquidity ratios:
The liquidity ratios of ATL for the years 2015, 2016 and 2017 have been demonstrated in
the form of a table (Refer to Appendices, Appendix 6). From the ratios computed, it has been
evaluated that the organisation has been struggling to meet off its current obligations due to the
rising burden of short-term liabilities (Scholes 2015). In addition, the organisation has been
struggling to discharge its inventory at a faster rate due to falling demand and the debtors are
making delays in clearing their short-term dues. Hence, the company has been going through
poor solvency position.
3.4.2 Profitability ratios:
The profitability ratios of ATL for the years 2015, 2016 and 2017 have been
demonstrated in the form of a table (Refer to Appendices, Appendix 6). According to the ratios
computed, it could be stated that the profit margin of the organisation is below the industrial
standard and the organisation has not been able to generate sufficient returns on equity. This is
11INTRODUCTION TO ACCOUNTING AND FINANCE
because of the inability of the organisation to cope up with competition and the declining trust
and confidence of the investors (Stent, Bradbury and Hooks 2017). Hence, in terms of
profitability, ATL fails to maintain the desired profit level.
3.4.3 Long-term solvency ratios:
The long-term solvency ratios of ATL for the years 2015, 2016 and 2017 have been
demonstrated in the form of a table (Refer to Appendices, Appendix 7). According to the ratios,
even though the organisation has been able to minimise the debt burden, it is still huge in
contrast to the industrial average. However, the higher operating income has helped the
organisation to meet off its financing costs effectively.
3.4.4 Cash flow adequacy:
The cash flow adequacy ratios of ATL for the years 2015, 2016 and 2017 have been
demonstrated in the form of a table (Refer to Appendices, Appendix 8). From the ratios
computed, it has been found that the cash flows in contrast to various items of the financial items
have been in line; however, it is below the industrial standard. Hence, there is limited amount of
cash base in ATL.
3.4.5 Market strength ratios:
The market strength ratios of ATL for the years 2015, 2016 and 2017 have been
demonstrated in the form of a table (Refer to Appendices, Appendix 9). From the computed
ratios, the company has overstated its financial position; however, the dividend payment is
minimal, since the primary focus is on maximising retained earnings (Trujillo‐Ponce 2013).
⊘ This is a preview!⊘
Do you want full access?
Subscribe today to unlock all pages.
Trusted by 1+ million students worldwide
1 out of 31
Related Documents


Your All-in-One AI-Powered Toolkit for Academic Success.
+13062052269
info@desklib.com
Available 24*7 on WhatsApp / Email
![[object Object]](/_next/static/media/star-bottom.7253800d.svg)
Unlock your academic potential
Copyright © 2020–2026 A2Z Services. All Rights Reserved. Developed and managed by ZUCOL.