Financial Performance Analysis: Tesco and Sainsbury Comparison
VerifiedAdded on 2019/12/03
|12
|2806
|110
Report
AI Summary
This report presents a financial analysis of Tesco and Sainsbury, two major retail companies. It examines their financial statements, including income statements and balance sheets, to assess their profitability, liquidity, efficiency, and solvency. The analysis involves calculating and interpreting various financial ratios such as gross profit ratio, operating profit ratio, current ratio, quick ratio, total assets turnover ratio, inventory turnover ratio, debt-equity ratio, and times interest ratio. The report compares the financial performance of both companies over a period of time, highlighting trends and providing insights into how different users of financial statements, including managers, shareholders, employees, government, financial institutions, and investors, might interpret the results. The report concludes with a summary of the key findings and their implications for the stakeholders. This analysis helps understand the financial health and performance of Tesco and Sainsbury, offering valuable information for decision-making.
FINANCIAL ACCOUNTING
Paraphrase This Document
Need a fresh take? Get an instant paraphrase of this document with our AI Paraphraser
TABLE OF CONTENTS
INTRODUCTION................................................................................................................................1
Users of financial statements............................................................................................1
Analysis of financial statements of Sainsbury for different users....................................2
Analysis of financial statements of Tesco for different users...........................................6
CONCLUSION....................................................................................................................................7
REFERENCES.....................................................................................................................................8
INDEX OF TABLES
Table 1: Financial statements - Sainsbury...........................................................................................2
Table 2: Ratio Analysis- Tesco............................................................................................................4
Table 1: Financial statements - Sainsbury...........................................................................................2
Table 2: Ratio Analysis- Tesco............................................................................................................4
⊘ This is a preview!⊘
Do you want full access?
Subscribe today to unlock all pages.
Trusted by 1+ million students worldwide
INTRODUCTION
Every organization prepares its financial statements in the form of income statements and
balance sheet. Income statement shows the profitability of business whereas balance sheet shows the
financial position of it (Scott, 2014). There are different users of financial statements such as
customers, employees, managers, government and investors. Moreover, their needs about the
financial information of company also tend to vary. Therefore, financial statements should satisfy
the needs of different users by providing useful information to them. In addition to it, it can also be
used for the analysis purpose between two or more companies. In this report, the financial
statements of Tesco and Sainsbury will be discussed as both are retail sector companies and explain
the way in which organization’s financial statements satisfy its users.
Users of financial statements
The objective of financial statements is to provide information about the financial position
as well as performance of organization. The information is considered to be useful for the users in
making economic decisions (Schroeder, Clark and Cathey, 2011). There are mainly two groups of
users, that is, internal as well as external.
Internal Users: Internal users are the part of company’s operating activities such as
managers, owners and employees.
Managers: They require financial statements so as to increase the profitability as well as
financial position of business. In Tesco and Sainsbury, management includes board of directors,
operating board and the committees. Board of directors are responsible to create long term
sustainable value for its shareholders by an effective and strategic planning (Edwards, 2013).
However, operating board is responsible to manage day to day operating activities of company.
Owners: Shareholders are the owners of organization. They make investment in the form of
shares with an objective of high return and capital appreciation. Tesco and Sainsbury collect its
funds by issuing the share capital. They need financial information to know the profitability of
business and to take necessary decisions about their invested funds.
Employees: Employees are very much concerned about the job security, high salary and
their employment terms (Ibson, 2008). Therefore, they want to know Tesco and Sainsbury’s
stability and profitability position.
External Users: External users are considered as the outsiders for organization such as
government, financial institutions and investors (Stickney and et.al., 2009)
Government: Government needs the accounting information of both companies for the
purpose of economic growth. They want to know the correctness of tax declared by Tesco and
1 | P a g e
Paraphrase This Document
Need a fresh take? Get an instant paraphrase of this document with our AI Paraphraser
Sainsbury in the tax return. Government also tracks economic progress by analyzing the financial
statements of different sectors of economy.
Financial Institutions: Banks provide credit facility to Tesco and Sainsbury for various
purposes. Hence, they use financial statement to know the financial health of business and take
effective decision for lending purpose (Lebas and Stolowy, 2006).
Investors: Investors make investment in company with the purpose of generating high
return. They predict expected dividend and the risk factor associated with the investment (Wantao
and Ramanathan, 2008). Hence, they need financial statements of Tesco and Sainsbury to know the
profitability and also the fluctuations in profits.
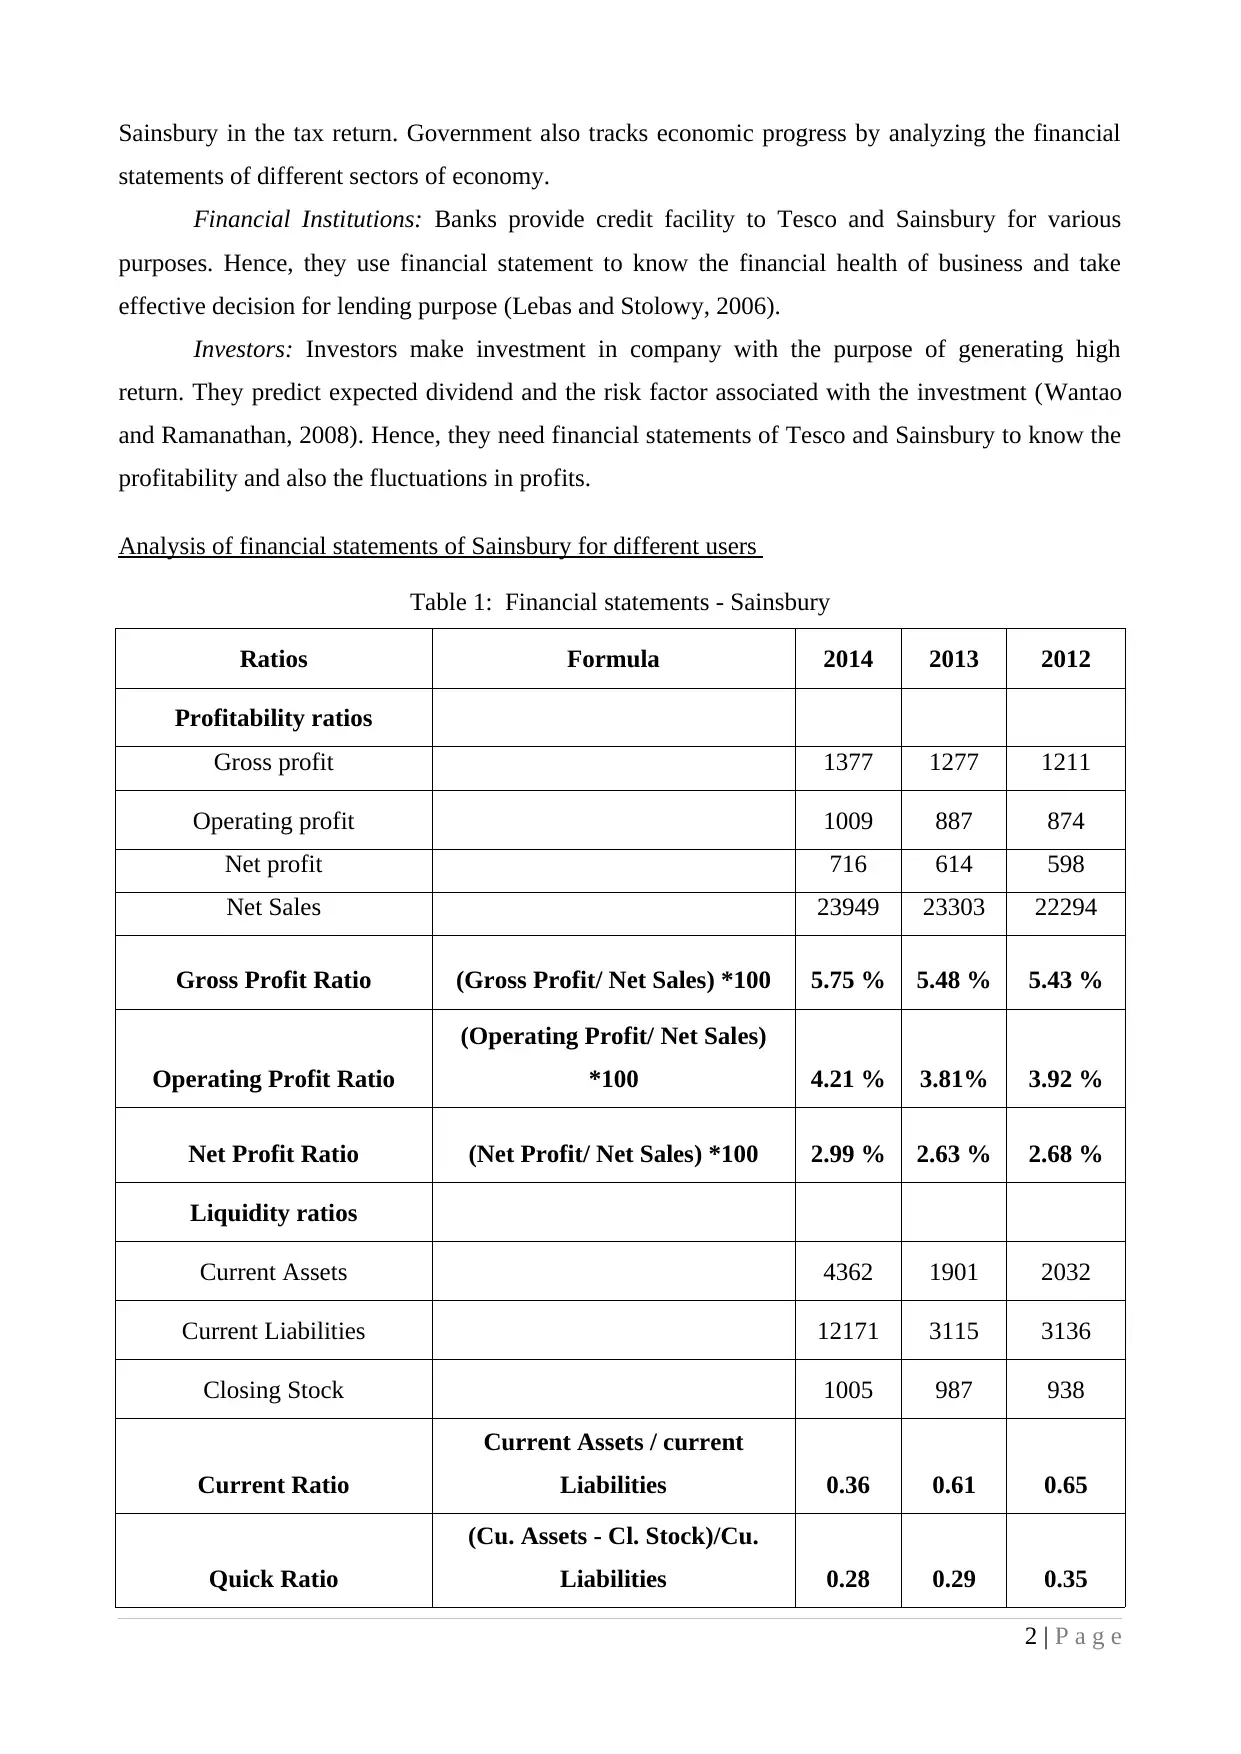
Analysis of financial statements of Sainsbury for different users
Table 1: Financial statements - Sainsbury
Ratios Formula 2014 2013 2012
Profitability ratios
Gross profit 1377 1277 1211
Operating profit 1009 887 874
Net profit 716 614 598
Net Sales 23949 23303 22294
Gross Profit Ratio (Gross Profit/ Net Sales) *100 5.75 % 5.48 % 5.43 %
Operating Profit Ratio
(Operating Profit/ Net Sales)
*100 4.21 % 3.81% 3.92 %
Net Profit Ratio (Net Profit/ Net Sales) *100 2.99 % 2.63 % 2.68 %
Liquidity ratios
Current Assets 4362 1901 2032
Current Liabilities 12171 3115 3136
Closing Stock 1005 987 938
Current Ratio
Current Assets / current
Liabilities 0.36 0.61 0.65
Quick Ratio
(Cu. Assets - Cl. Stock)/Cu.
Liabilities 0.28 0.29 0.35
2 | P a g e
statements of different sectors of economy.
Financial Institutions: Banks provide credit facility to Tesco and Sainsbury for various
purposes. Hence, they use financial statement to know the financial health of business and take
effective decision for lending purpose (Lebas and Stolowy, 2006).
Investors: Investors make investment in company with the purpose of generating high
return. They predict expected dividend and the risk factor associated with the investment (Wantao
and Ramanathan, 2008). Hence, they need financial statements of Tesco and Sainsbury to know the
profitability and also the fluctuations in profits.
Analysis of financial statements of Sainsbury for different users
Table 1: Financial statements - Sainsbury
Ratios Formula 2014 2013 2012
Profitability ratios
Gross profit 1377 1277 1211
Operating profit 1009 887 874
Net profit 716 614 598
Net Sales 23949 23303 22294
Gross Profit Ratio (Gross Profit/ Net Sales) *100 5.75 % 5.48 % 5.43 %
Operating Profit Ratio
(Operating Profit/ Net Sales)
*100 4.21 % 3.81% 3.92 %
Net Profit Ratio (Net Profit/ Net Sales) *100 2.99 % 2.63 % 2.68 %
Liquidity ratios
Current Assets 4362 1901 2032
Current Liabilities 12171 3115 3136
Closing Stock 1005 987 938
Current Ratio
Current Assets / current
Liabilities 0.36 0.61 0.65
Quick Ratio
(Cu. Assets - Cl. Stock)/Cu.
Liabilities 0.28 0.29 0.35
2 | P a g e
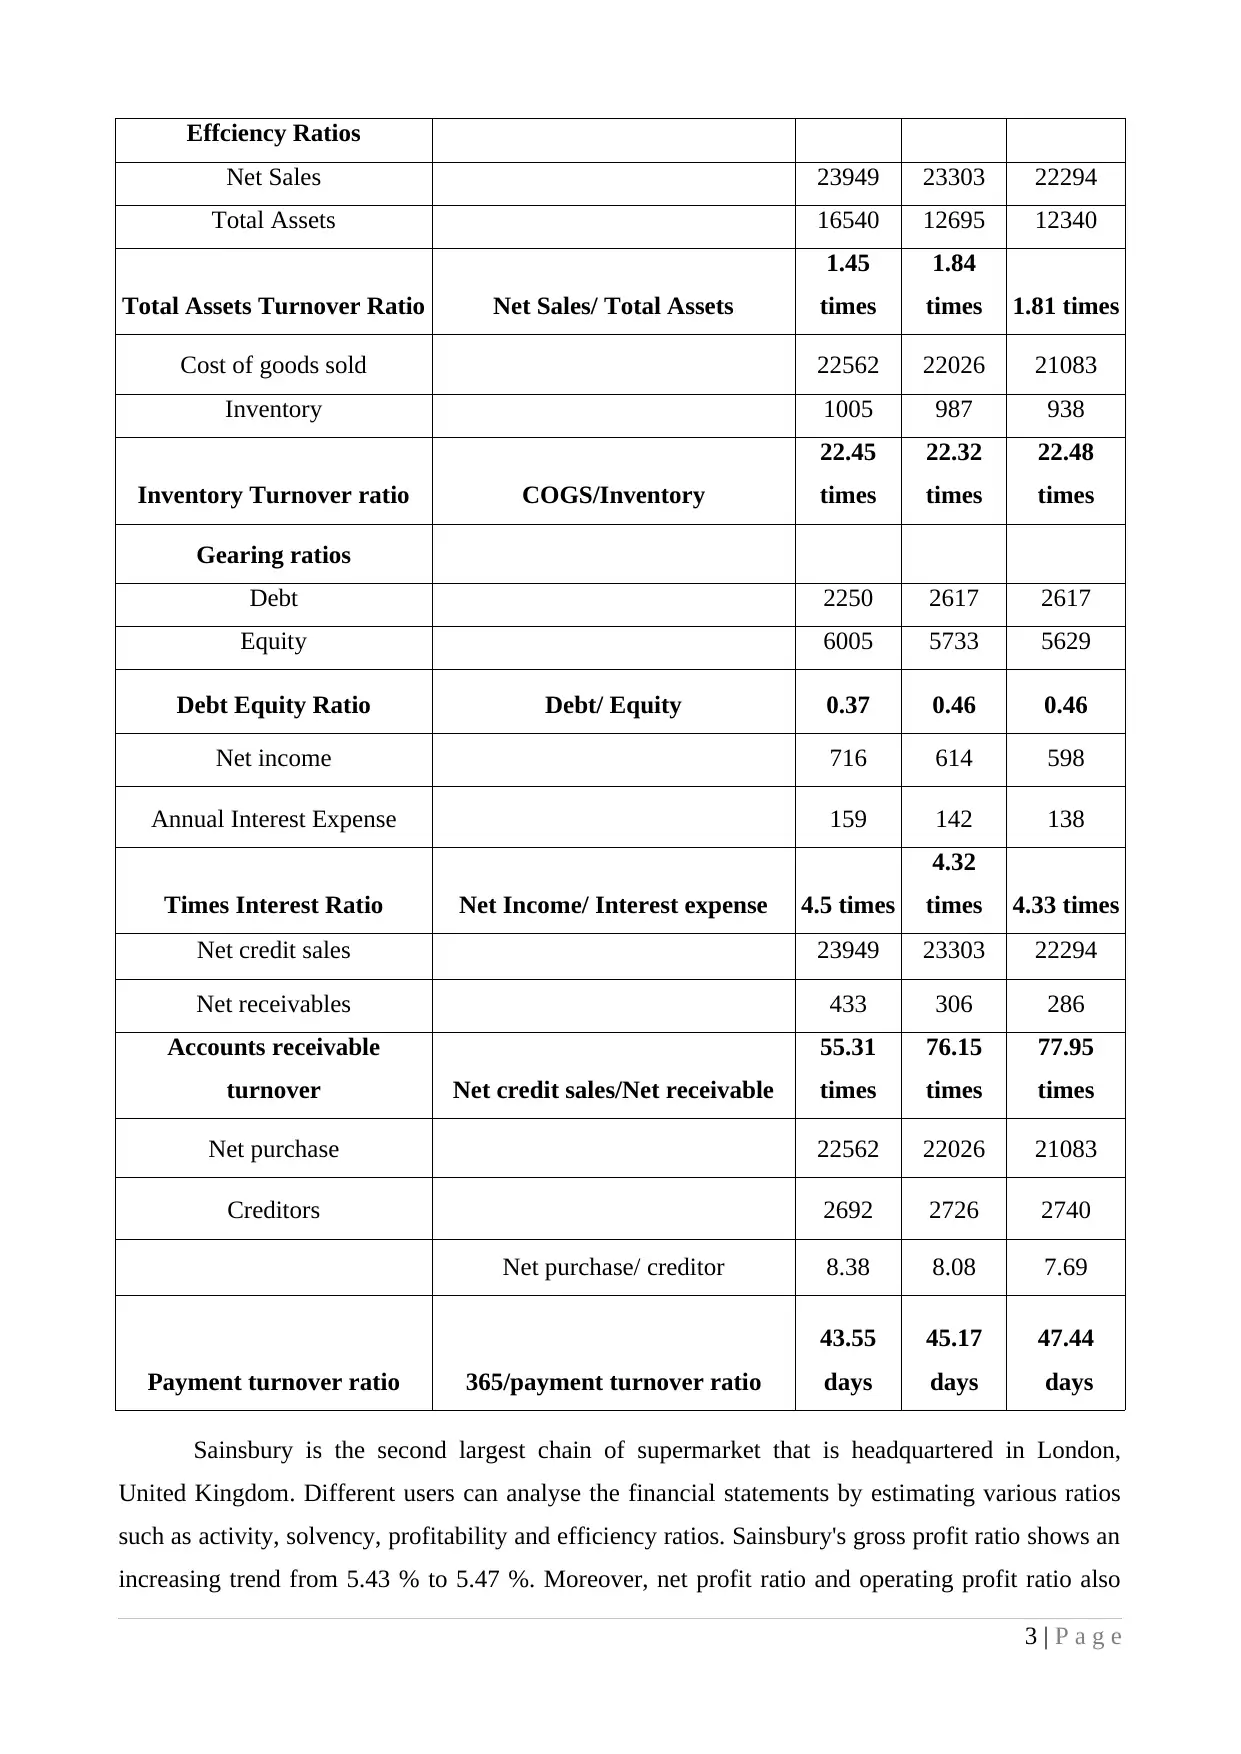
Effciency Ratios
Net Sales 23949 23303 22294
Total Assets 16540 12695 12340
Total Assets Turnover Ratio Net Sales/ Total Assets
1.45
times
1.84
times 1.81 times
Cost of goods sold 22562 22026 21083
Inventory 1005 987 938
Inventory Turnover ratio COGS/Inventory
22.45
times
22.32
times
22.48
times
Gearing ratios
Debt 2250 2617 2617
Equity 6005 5733 5629
Debt Equity Ratio Debt/ Equity 0.37 0.46 0.46
Net income 716 614 598
Annual Interest Expense 159 142 138
Times Interest Ratio Net Income/ Interest expense 4.5 times
4.32
times 4.33 times
Net credit sales 23949 23303 22294
Net receivables 433 306 286
Accounts receivable
turnover Net credit sales/Net receivable
55.31
times
76.15
times
77.95
times
Net purchase 22562 22026 21083
Creditors 2692 2726 2740
Net purchase/ creditor 8.38 8.08 7.69
Payment turnover ratio 365/payment turnover ratio
43.55
days
45.17
days
47.44
days
Sainsbury is the second largest chain of supermarket that is headquartered in London,
United Kingdom. Different users can analyse the financial statements by estimating various ratios
such as activity, solvency, profitability and efficiency ratios. Sainsbury's gross profit ratio shows an
increasing trend from 5.43 % to 5.47 %. Moreover, net profit ratio and operating profit ratio also
3 | P a g e
⊘ This is a preview!⊘
Do you want full access?
Subscribe today to unlock all pages.
Trusted by 1+ million students worldwide
increases to 2.99% and 4.21% respectively. Therefore, it is favourable for various users such as
shareholders, managers and investors since the profitability is rising (Goyal and Goyal, 2012).
However, current ratio as well as quick ratio has decreased to 0.36 and 0.28 respectively. It shows
that less liquid assets are available to meet Sainsbury's short term requirement. Therefore, it will
have an adverse impact on the operations of business as well as users. On the contrary, total assets
and inventory turnover ratio decreased to 1.45 and 22.45 which shows that assets and inventory are
employed at less efficiency (Rajasekaran, 2011). Therefore, managers implement rules and
regulations strictly so as to increase the efficiency of assets. Debt equity ratio decreased to 0.37 and
time interest ratio increased to 4.50. It shows that Sainsbury is getting higher funds from lenders
and fewer amounts from shareholders. Time interest ratio increased to 4.50 which helps the
creditors and investors to evaluate that the creditworthiness of Sainsbury (Cotter and Hutchinson,
2011). However, accounts receivable and payable ratio decreased to 55.31 and 43.55 respectively. It
indicates quick collection from debtors and fast payment to creditors (Tulsian, 2002). Thus, it is
clear that managers have to take necessary steps to increase the liquidity and efficiency of assets.
Shareholders will be satisfied because earning per share of company has increased to 32.80p from
30.80p. Moreover, dividend per share has also increased from 16.70p to 17.30p. On the contrary,
financial institutions do not lend very much credit facility because of lowering the liquid position
and turnover ratio (Constantin, 2013).
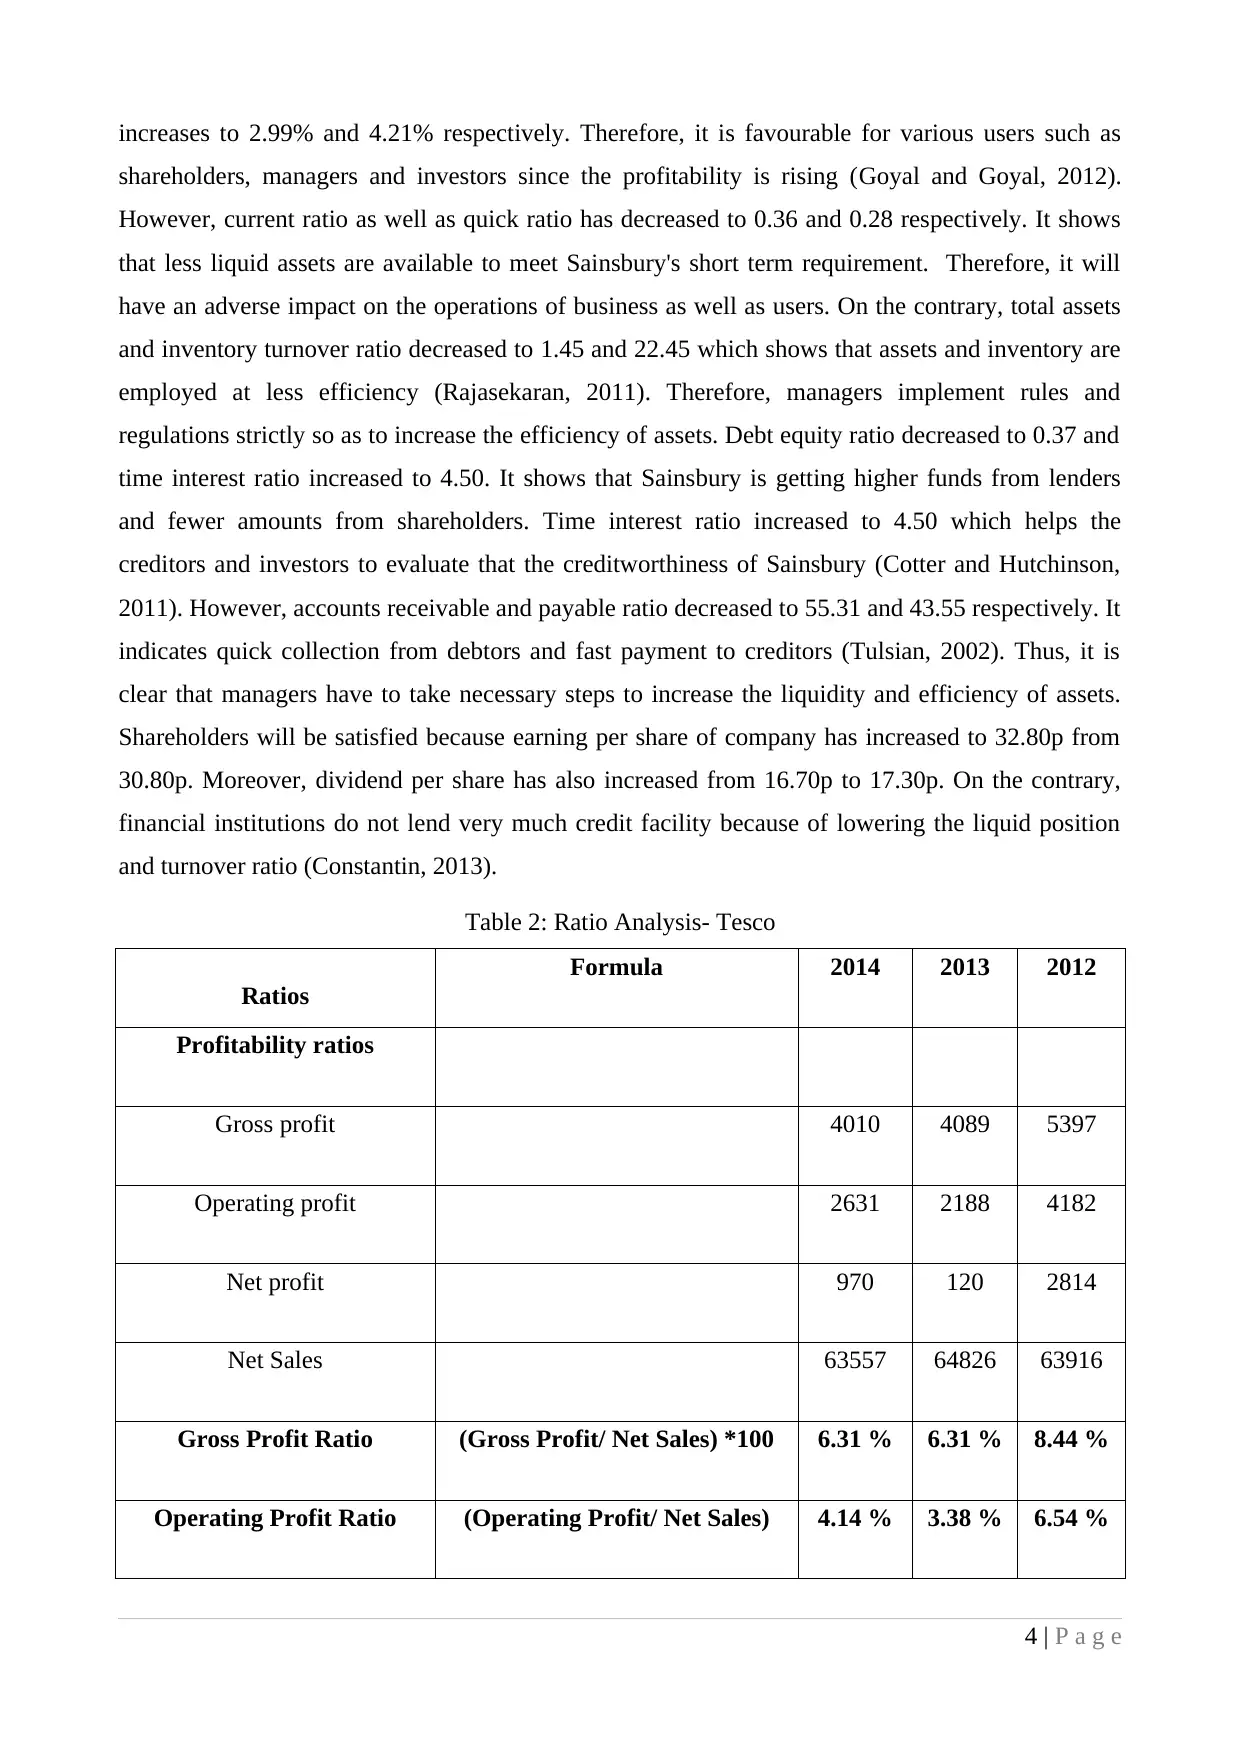
Table 2: Ratio Analysis- Tesco
Ratios
Formula 2014 2013 2012
Profitability ratios
Gross profit 4010 4089 5397
Operating profit 2631 2188 4182
Net profit 970 120 2814
Net Sales 63557 64826 63916
Gross Profit Ratio (Gross Profit/ Net Sales) *100 6.31 % 6.31 % 8.44 %
Operating Profit Ratio (Operating Profit/ Net Sales) 4.14 % 3.38 % 6.54 %
4 | P a g e
shareholders, managers and investors since the profitability is rising (Goyal and Goyal, 2012).
However, current ratio as well as quick ratio has decreased to 0.36 and 0.28 respectively. It shows
that less liquid assets are available to meet Sainsbury's short term requirement. Therefore, it will
have an adverse impact on the operations of business as well as users. On the contrary, total assets
and inventory turnover ratio decreased to 1.45 and 22.45 which shows that assets and inventory are
employed at less efficiency (Rajasekaran, 2011). Therefore, managers implement rules and
regulations strictly so as to increase the efficiency of assets. Debt equity ratio decreased to 0.37 and
time interest ratio increased to 4.50. It shows that Sainsbury is getting higher funds from lenders
and fewer amounts from shareholders. Time interest ratio increased to 4.50 which helps the
creditors and investors to evaluate that the creditworthiness of Sainsbury (Cotter and Hutchinson,
2011). However, accounts receivable and payable ratio decreased to 55.31 and 43.55 respectively. It
indicates quick collection from debtors and fast payment to creditors (Tulsian, 2002). Thus, it is
clear that managers have to take necessary steps to increase the liquidity and efficiency of assets.
Shareholders will be satisfied because earning per share of company has increased to 32.80p from
30.80p. Moreover, dividend per share has also increased from 16.70p to 17.30p. On the contrary,
financial institutions do not lend very much credit facility because of lowering the liquid position
and turnover ratio (Constantin, 2013).
Table 2: Ratio Analysis- Tesco
Ratios
Formula 2014 2013 2012
Profitability ratios
Gross profit 4010 4089 5397
Operating profit 2631 2188 4182
Net profit 970 120 2814
Net Sales 63557 64826 63916
Gross Profit Ratio (Gross Profit/ Net Sales) *100 6.31 % 6.31 % 8.44 %
Operating Profit Ratio (Operating Profit/ Net Sales) 4.14 % 3.38 % 6.54 %
4 | P a g e
Paraphrase This Document
Need a fresh take? Get an instant paraphrase of this document with our AI Paraphraser
*100
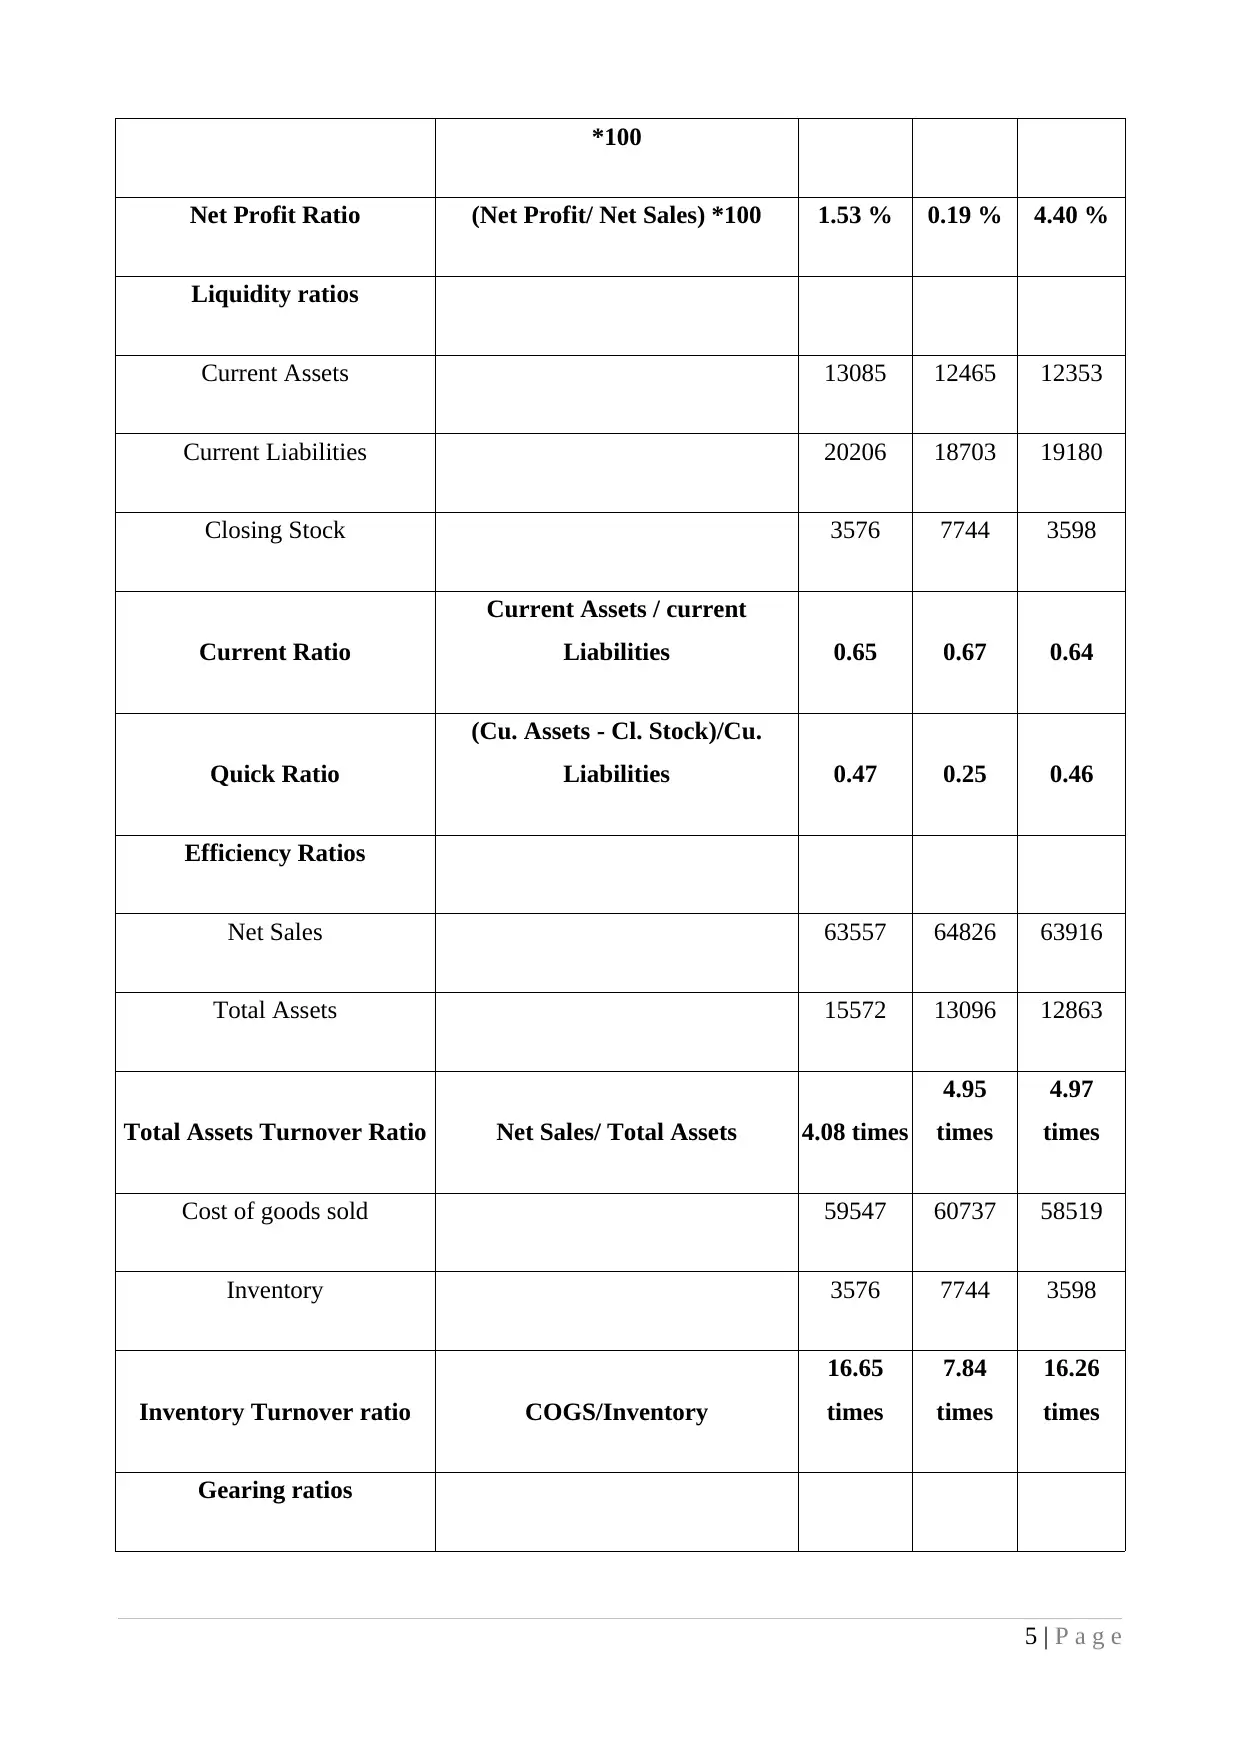
Net Profit Ratio (Net Profit/ Net Sales) *100 1.53 % 0.19 % 4.40 %
Liquidity ratios
Current Assets 13085 12465 12353
Current Liabilities 20206 18703 19180
Closing Stock 3576 7744 3598
Current Ratio
Current Assets / current
Liabilities 0.65 0.67 0.64
Quick Ratio
(Cu. Assets - Cl. Stock)/Cu.
Liabilities 0.47 0.25 0.46
Efficiency Ratios
Net Sales 63557 64826 63916
Total Assets 15572 13096 12863
Total Assets Turnover Ratio Net Sales/ Total Assets 4.08 times
4.95
times
4.97
times
Cost of goods sold 59547 60737 58519
Inventory 3576 7744 3598
Inventory Turnover ratio COGS/Inventory
16.65
times
7.84
times
16.26
times
Gearing ratios
5 | P a g e
Debt 9303 10068 9911
Equity 14772 16661 17801
Debt Equity Ratio Debt/ Equity 0.63 0.60 0.56
Net income 970 120 2814
Annual Interest Expense 564 459 411
Times Interest Ratio Net Income/ Interest expense 1.72 times
0.26
times
6.85
times
Net credit sales 63557 64826 63916
Net receivables 2190 2525 2657
Accounts receivable turnover Net credit sales/Net receivable
29.021
times
25.67
times
24.06
times
Net purchase 59547 60735 58519
Creditors 10595 11094 11234
Net purchase/ creditor 5.62 5.47 5.21
Payment turnover ratio 365/payment turnover ratio
64.94
days
66.67
days
70.07
days
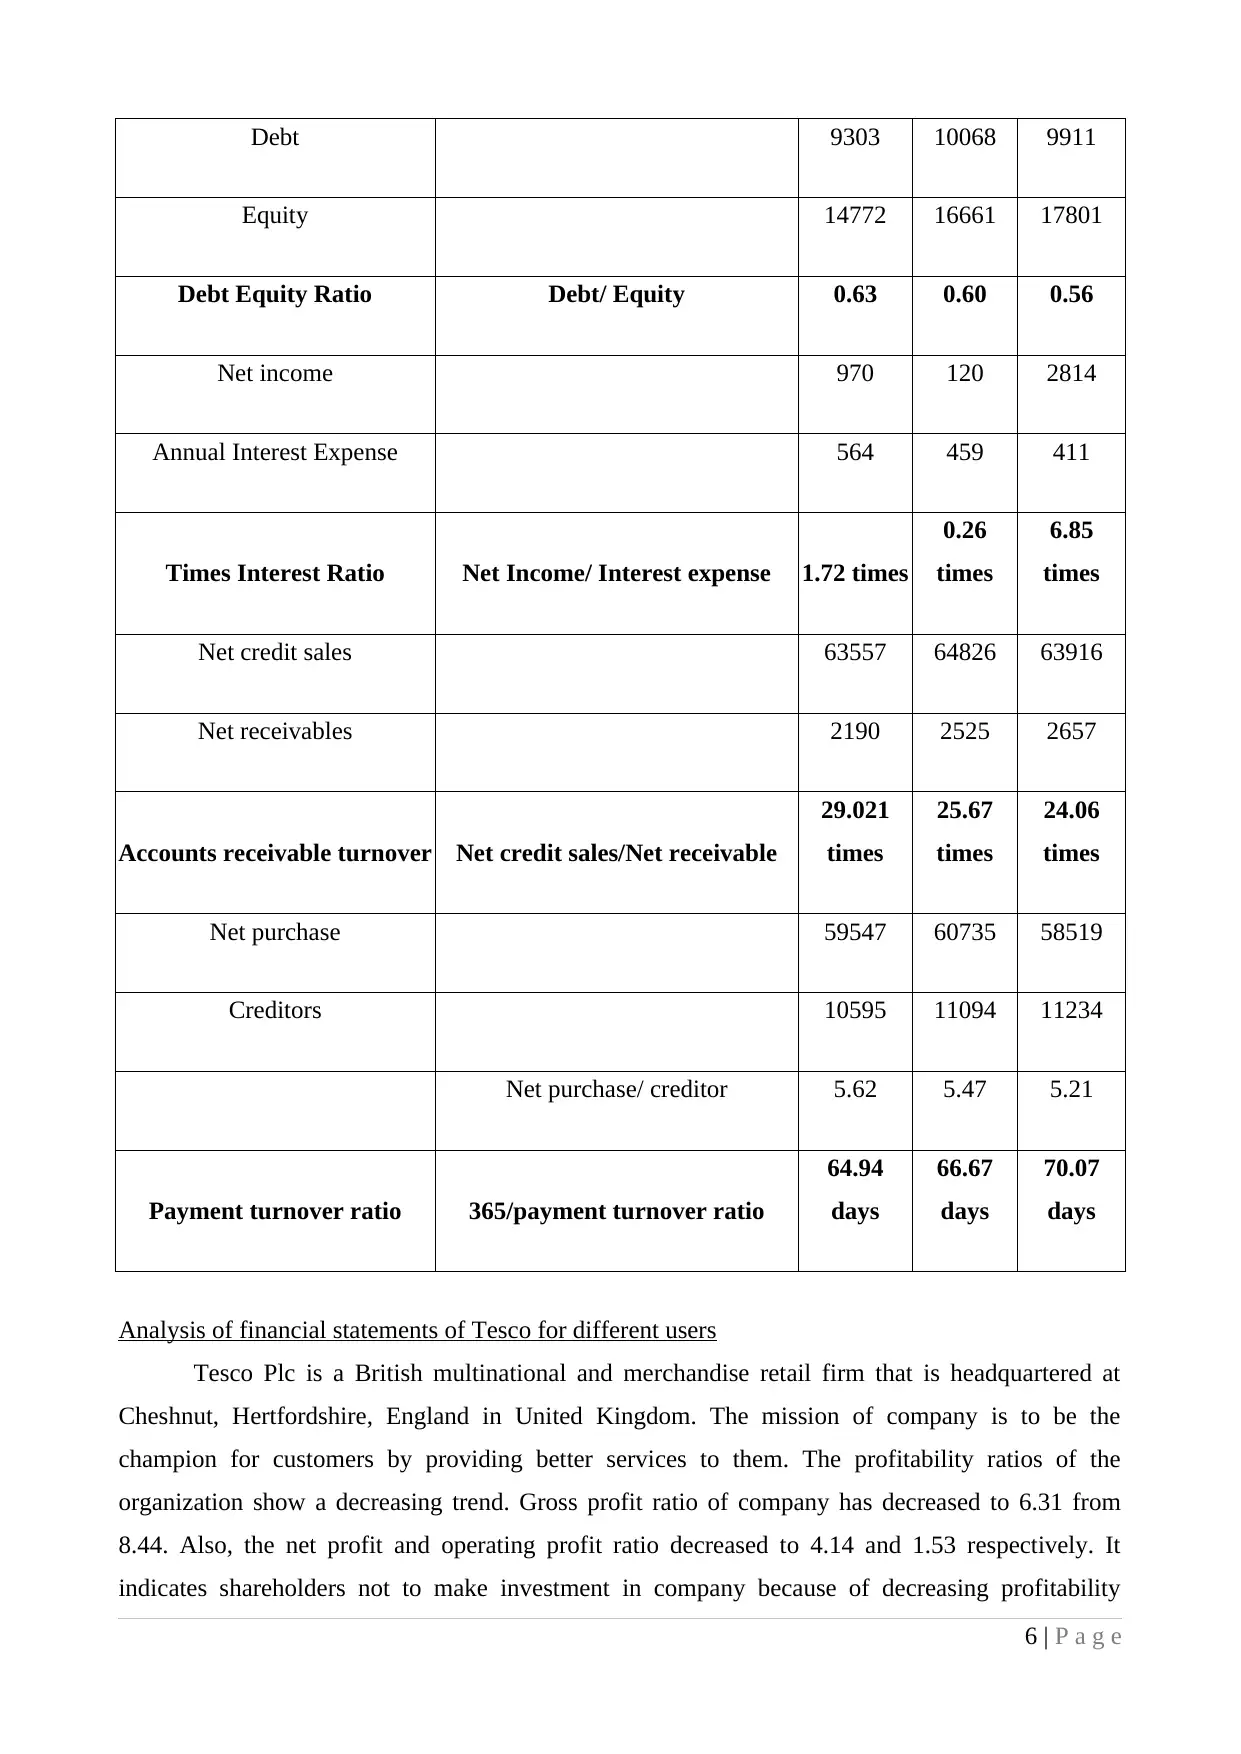
Analysis of financial statements of Tesco for different users
Tesco Plc is a British multinational and merchandise retail firm that is headquartered at
Cheshnut, Hertfordshire, England in United Kingdom. The mission of company is to be the
champion for customers by providing better services to them. The profitability ratios of the
organization show a decreasing trend. Gross profit ratio of company has decreased to 6.31 from
8.44. Also, the net profit and operating profit ratio decreased to 4.14 and 1.53 respectively. It
indicates shareholders not to make investment in company because of decreasing profitability
6 | P a g e
Equity 14772 16661 17801
Debt Equity Ratio Debt/ Equity 0.63 0.60 0.56
Net income 970 120 2814
Annual Interest Expense 564 459 411
Times Interest Ratio Net Income/ Interest expense 1.72 times
0.26
times
6.85
times
Net credit sales 63557 64826 63916
Net receivables 2190 2525 2657
Accounts receivable turnover Net credit sales/Net receivable
29.021
times
25.67
times
24.06
times
Net purchase 59547 60735 58519
Creditors 10595 11094 11234
Net purchase/ creditor 5.62 5.47 5.21
Payment turnover ratio 365/payment turnover ratio
64.94
days
66.67
days
70.07
days
Analysis of financial statements of Tesco for different users
Tesco Plc is a British multinational and merchandise retail firm that is headquartered at
Cheshnut, Hertfordshire, England in United Kingdom. The mission of company is to be the
champion for customers by providing better services to them. The profitability ratios of the
organization show a decreasing trend. Gross profit ratio of company has decreased to 6.31 from
8.44. Also, the net profit and operating profit ratio decreased to 4.14 and 1.53 respectively. It
indicates shareholders not to make investment in company because of decreasing profitability
6 | P a g e
⊘ This is a preview!⊘
Do you want full access?
Subscribe today to unlock all pages.
Trusted by 1+ million students worldwide
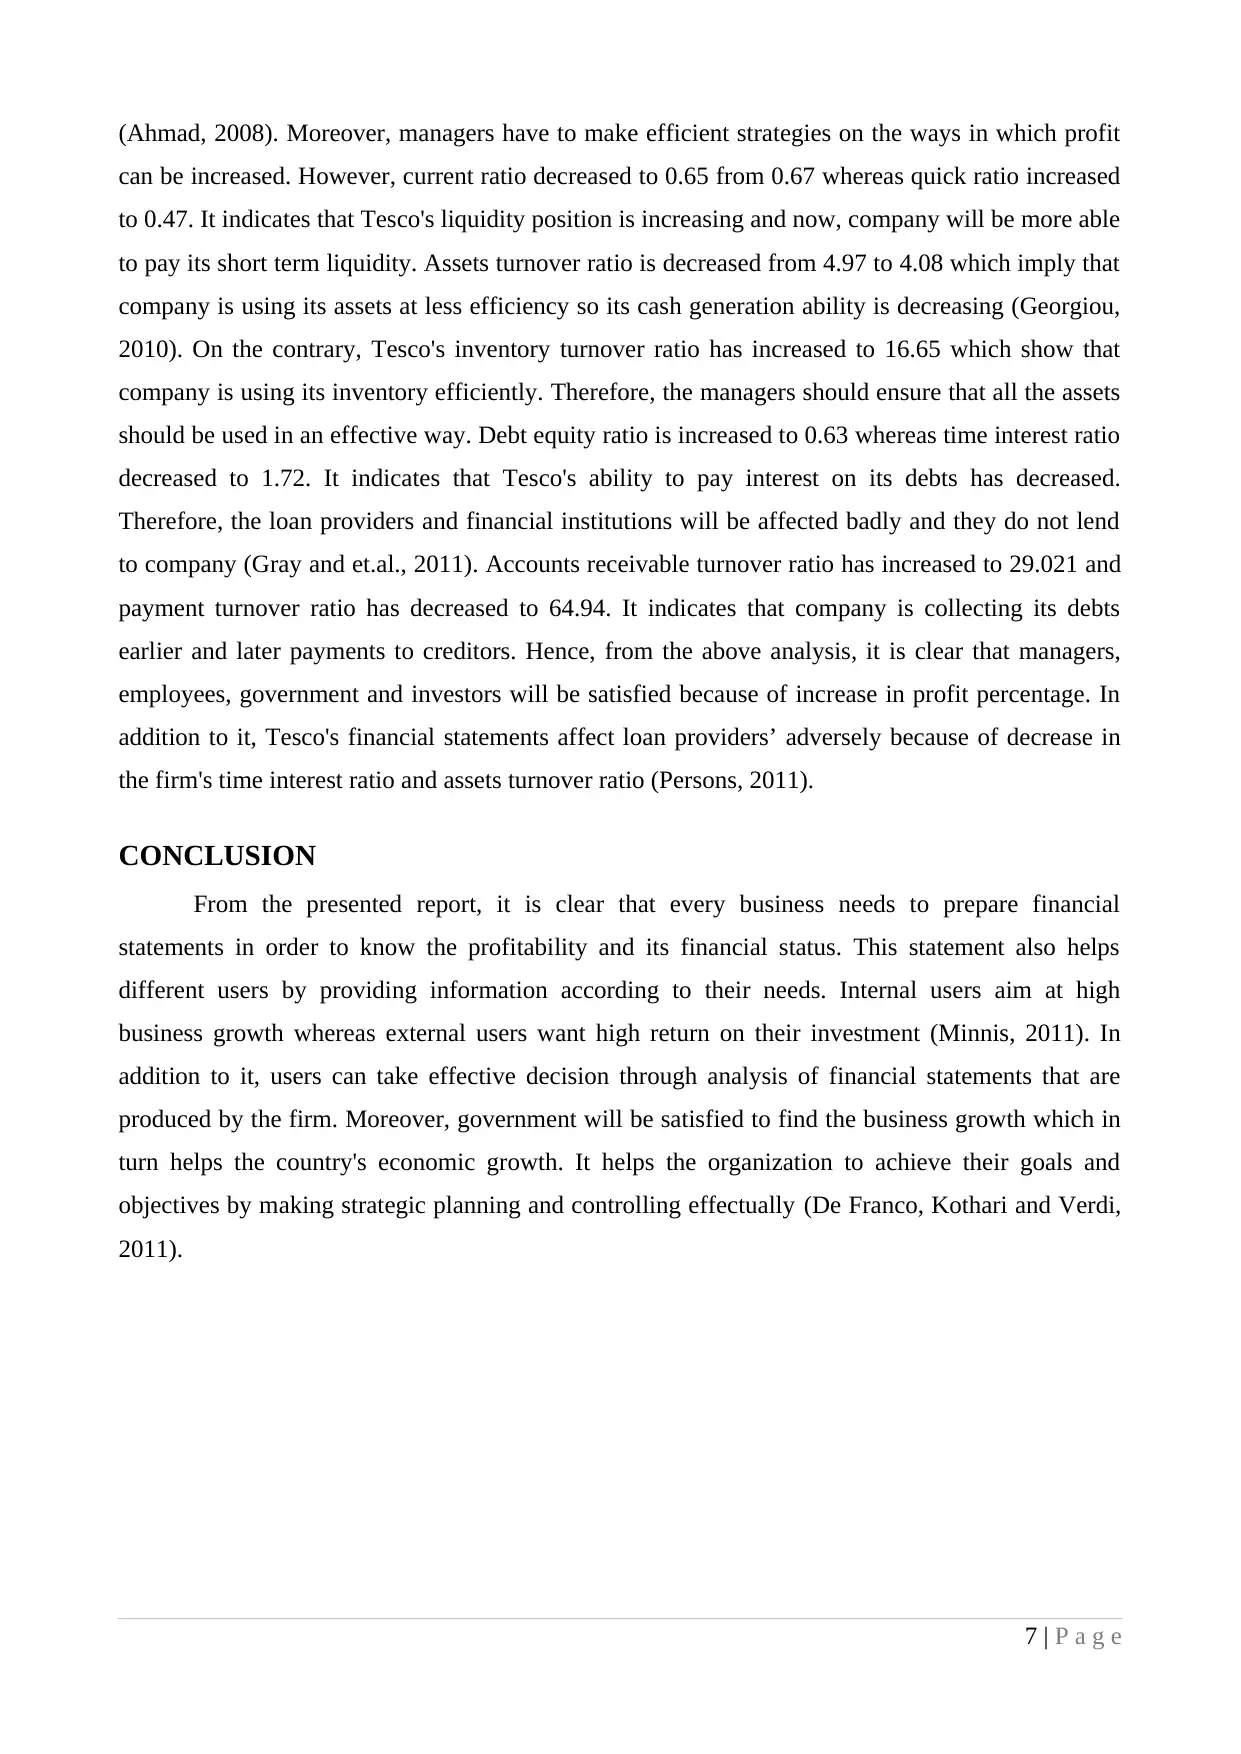
(Ahmad, 2008). Moreover, managers have to make efficient strategies on the ways in which profit
can be increased. However, current ratio decreased to 0.65 from 0.67 whereas quick ratio increased
to 0.47. It indicates that Tesco's liquidity position is increasing and now, company will be more able
to pay its short term liquidity. Assets turnover ratio is decreased from 4.97 to 4.08 which imply that
company is using its assets at less efficiency so its cash generation ability is decreasing (Georgiou,
2010). On the contrary, Tesco's inventory turnover ratio has increased to 16.65 which show that
company is using its inventory efficiently. Therefore, the managers should ensure that all the assets
should be used in an effective way. Debt equity ratio is increased to 0.63 whereas time interest ratio
decreased to 1.72. It indicates that Tesco's ability to pay interest on its debts has decreased.
Therefore, the loan providers and financial institutions will be affected badly and they do not lend
to company (Gray and et.al., 2011). Accounts receivable turnover ratio has increased to 29.021 and
payment turnover ratio has decreased to 64.94. It indicates that company is collecting its debts
earlier and later payments to creditors. Hence, from the above analysis, it is clear that managers,
employees, government and investors will be satisfied because of increase in profit percentage. In
addition to it, Tesco's financial statements affect loan providers’ adversely because of decrease in
the firm's time interest ratio and assets turnover ratio (Persons, 2011).
CONCLUSION
From the presented report, it is clear that every business needs to prepare financial
statements in order to know the profitability and its financial status. This statement also helps
different users by providing information according to their needs. Internal users aim at high
business growth whereas external users want high return on their investment (Minnis, 2011). In
addition to it, users can take effective decision through analysis of financial statements that are
produced by the firm. Moreover, government will be satisfied to find the business growth which in
turn helps the country's economic growth. It helps the organization to achieve their goals and
objectives by making strategic planning and controlling effectually (De Franco, Kothari and Verdi,
2011).
7 | P a g e
Paraphrase This Document
Need a fresh take? Get an instant paraphrase of this document with our AI Paraphraser
REFERENCES
Books and Journals
Ahmad, N., 2008. Financial Accounting. Atlantic publishers & Dist.
De Franco, G., Kothari, S. P. and Verdi, R. S., 2011. The benefits of financial statement
comparability. Journal of Accounting Research. 49(4). pp. 895-931.
Edwards, J. R., 2013. A History of Financial Accounting (RLE Accounting). Routledge.
Georgiou, G., 2010. The IASB standard-setting process: Participation and perceptions of financial
statement users. The British Accounting Review. 42(2). pp.103-118.
Goyal, K. V. and Goyal R., 2012. Financial Accounting. 4th edition. PHI Learning Pvt. Ltd.
Gray, G. L. and et. al., 2011. Perceptions and misperceptions regarding the unqualified auditor's
report by financial statement preparers, users, and auditors. Accounting Horizons. 25(4). pp.
659-684.
Ibson, C., 2008. Financial Reporting and Analysis: Using Accounting Information. 11th edition.
Cengage Learning.
Lebas, M. and Stolowy, H., 2006. Financial Accounting and Reporting: A Global Perspective.
Cengage Learning.
Minnis, M., 2011. The value of financial statement verification in debt financing: Evidence from
private US firms. Journal of Accounting Research. 49(2). pp. 457-506.
Persons, O. S., 2011. Using financial statement data to identify factors associated with fraudulent
financial reporting. Journal of Applied Business Research (JABR). 11(3). pp. 38-46.
Rajasekaran, V., 2011. Financial Accounting. Pearson Education India.
Schroeder, R. G., Clark, M. W. and Cathey, J. M., 2011. Financial accounting theory and analysis:
text and cases. John Wiley and Sons.
Scott, W. R., 2014. Financial accounting theory. Pearson Education Canada.
Stickney, C. and et. al., 2009. Financial accounting: an introduction to concepts, methods and uses.
Cengage Learning.
Tulsian, C. P., 2002. Financial Accounting. Pearson Education India.
Wantao, Y. and Ramanathan, R., 2008. An assessment of operational efficiencies in the UK retail
sector. International Journal Of Retail And Distribution Management. 36(11). pp. 861-882.
Online
8 | P a g e
Constantin, F. D., 2013. The users of accounting information and their needs. [PDF]. Available
through: <http://fse.tibiscus.ro/anale/lucrari2013/lucrari_vol_xix_2013_032.pdf>.
[Accessed on 2nd November 2015].
Cotter, J. and Hutchinson, W. R., 2011. The impact of accounting reporting techniques on earning
enhancement in the UK retailing sector. [Online]. Available through:
<http://www.tandfonline.com/doi/abs/10.1080/095939699342615>. [Accessed on 2nd
November 2015].
9 | P a g e
⊘ This is a preview!⊘
Do you want full access?
Subscribe today to unlock all pages.
Trusted by 1+ million students worldwide
1 out of 12
Related Documents


Your All-in-One AI-Powered Toolkit for Academic Success.
+13062052269
info@desklib.com
Available 24*7 on WhatsApp / Email
![[object Object]](/_next/static/media/star-bottom.7253800d.svg)
Unlock your academic potential
Copyright © 2020–2026 A2Z Services. All Rights Reserved. Developed and managed by ZUCOL.