Managing Financial Resources: Analysis and Investment Decision
VerifiedAdded on 2023/01/12
|9
|2624
|40
Report
AI Summary
This report delves into the critical aspects of financial resource management through the analysis of financial statements. It begins with an introduction to the significance of financial statements and their diverse applications, catering to the needs of various decision-makers. The main body of the report explores the uses of financial statements, including income statements, balance sheets, and cash flow statements, and how these statements cater to the needs of investors, bankers, suppliers, and government entities. The report then provides a comparative analysis between for-profit and non-profit organizations' financial statements. Furthermore, it conducts a detailed ratio analysis, including gearing ratio, earnings per share, dividend per share, dividend yield, dividend cover, and price-earnings ratio, to assess the financial health and performance of Aurora PLC. Based on this analysis, the report concludes with an investment recommendation for James, advising whether or not to invest in Aurora PLC, supported by the financial data and ratio outcomes. The report underscores the pivotal role of financial statements in strategic decision-making and offers insights into the investment potential of Aurora PLC. The report concludes with an overview of financial statements and their significance for business organizations and stakeholders.

Managing financial
resources
resources
Paraphrase This Document
Need a fresh take? Get an instant paraphrase of this document with our AI Paraphraser

TABLE OF CONTENTS
INTRODUCTION......................................................................................................................3
MAIN BODY.............................................................................................................................3
Uses of financial statements and assessing the needs of various decision makers................3
Analysing and interpreting the financial statement................................................................5
Advising whether to invest or not in Aurora Plc....................................................................8
CONCLUSION..........................................................................................................................8
REFERENCES...........................................................................................................................9
INTRODUCTION
The success of the organization mainly depends upon how effectively the
management is utilizing the various resources of the organization for running the business
effectively. It is the responsibility of the management to make sure that all the financial
resources are used properly and is also required to make decisions with respect to monitoring
and managing the business operations. This report presents about the various uses of financial
statements along with the needs of different decision makers. It also includes ratio analysis of
company, based on which decision is required to be drawn.
MAIN BODY
Uses of financial statements and assessing the needs of various decision makers
The financial statements are prepared based on the financial transactions of the
business. The most common financial statements are income statements, balance sheet and
the cash flow statement. The form of financial statements varies from one organization to
another but the basic purpose remains the same (Drake, Hales and Rees, 2019). It provides a
complete understanding about the company’s progress based on which business decisions are
taken. It helps the user of the information to make valuable decisions with regards to effective
allocation of resources. Financial statement also helps the management in taking decisions
with respect investment, business expansion, entering into contract with others etc.
Balance sheet indicates the financial position of the business at a specific period. It
depicts about the what assets owned, how much the company owes to the lenders and vendors
and also it shows about the net worth of the business. It basically provides the current status
of the company with respect to liquidity, funding and solvency position.
The income statement measures the financial performance of the business. It tells
about the profit or loss the business incurred in an accounting year. It also shows about the
various expenses incurred in that particular period (Sedláček, 2016). This statement also
provides information about the ability of the company to generate profit, it also reveals the
revenue of from the business operation.
The cash flow statement provides the information about the cash inflow and outflow
which cannot be identified using income statement or balance sheet. It also shows about the
cash flow from various other activities. It also helps in analysing the nature of cash spending
and disbursements.
⊘ This is a preview!⊘
Do you want full access?
Subscribe today to unlock all pages.
Trusted by 1+ million students worldwide
The financial statements help in assisting with the needs of its different users for
decision making. Some of the key decision makers are stated below.
Investors
Investors uses financial statements for the purpose of assessing the finances. It helps
in knowing about the company’s solvency position with respect to long term or short term
(Hirzel, and et.al, 2016). They consider looking at the amount of debt in the company’s
capital structure and the resources available to pay off those debt effectively and efficiently.
Better solvency position helps in getting more investment from the investors.
Bankers
The banking institutions also uses financials statements for the purpose of identifying
the ability of the company to pay off its debt (Bajgier and et.al , 2019). Based on which
decision is made whether provide further loan and advances to the company or not. It is very
useful for the financial institutions.
Suppliers
The suppliers of the company are also very interested in using the financial statement
of the company in order to know the credit worthiness of it which is extremely fundamental
for taking choice regarding whether to offer merchandise and ventures on credit or not. For
this, suppliers are required to assess the financial information of the company in order to
determine the growth prospects of the business. Also, helps in determining whether the
company can pay back the money on time or not.
Government
Government uses financial statements information with the purpose to know whether
the company is complying with set regulations and policies. Government can also use this
information for deciding the taxation and regulatory policies (Berisha Vokshi and Xhelili
Krasniqi, 2017). Government has nothing much to do with the financial statements of the
company they ae only interested in knowing whether company has followed all the relevant
statutory standards.
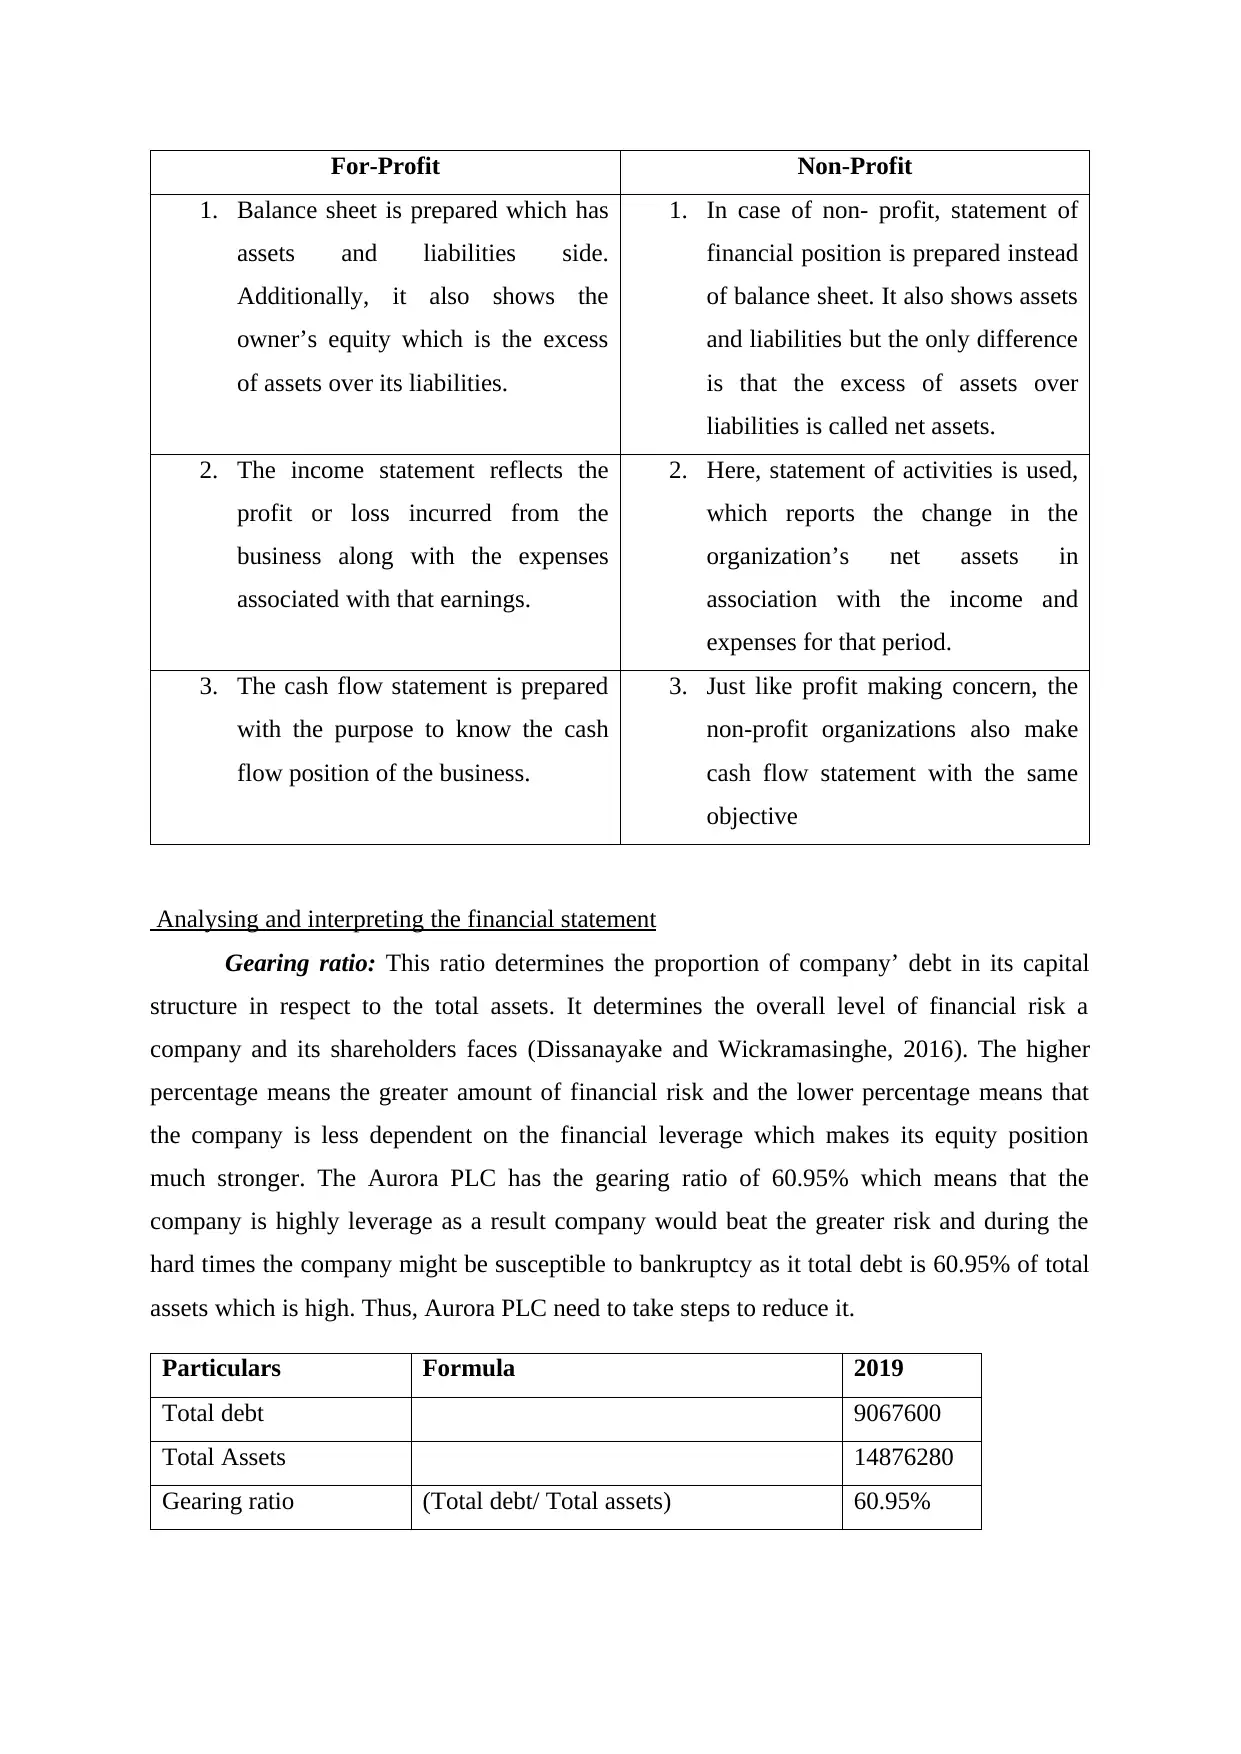
Comparison between the financial statements of different types of organizations
There are mainly to types of businesses, which are profit making and non-profit
making.
decision making. Some of the key decision makers are stated below.
Investors
Investors uses financial statements for the purpose of assessing the finances. It helps
in knowing about the company’s solvency position with respect to long term or short term
(Hirzel, and et.al, 2016). They consider looking at the amount of debt in the company’s
capital structure and the resources available to pay off those debt effectively and efficiently.
Better solvency position helps in getting more investment from the investors.
Bankers
The banking institutions also uses financials statements for the purpose of identifying
the ability of the company to pay off its debt (Bajgier and et.al , 2019). Based on which
decision is made whether provide further loan and advances to the company or not. It is very
useful for the financial institutions.
Suppliers
The suppliers of the company are also very interested in using the financial statement
of the company in order to know the credit worthiness of it which is extremely fundamental
for taking choice regarding whether to offer merchandise and ventures on credit or not. For
this, suppliers are required to assess the financial information of the company in order to
determine the growth prospects of the business. Also, helps in determining whether the
company can pay back the money on time or not.
Government
Government uses financial statements information with the purpose to know whether
the company is complying with set regulations and policies. Government can also use this
information for deciding the taxation and regulatory policies (Berisha Vokshi and Xhelili
Krasniqi, 2017). Government has nothing much to do with the financial statements of the
company they ae only interested in knowing whether company has followed all the relevant
statutory standards.
Comparison between the financial statements of different types of organizations
There are mainly to types of businesses, which are profit making and non-profit
making.
Paraphrase This Document
Need a fresh take? Get an instant paraphrase of this document with our AI Paraphraser
For-Profit Non-Profit
1. Balance sheet is prepared which has
assets and liabilities side.
Additionally, it also shows the
owner’s equity which is the excess
of assets over its liabilities.
1. In case of non- profit, statement of
financial position is prepared instead
of balance sheet. It also shows assets
and liabilities but the only difference
is that the excess of assets over
liabilities is called net assets.
2. The income statement reflects the
profit or loss incurred from the
business along with the expenses
associated with that earnings.
2. Here, statement of activities is used,
which reports the change in the
organization’s net assets in
association with the income and
expenses for that period.
3. The cash flow statement is prepared
with the purpose to know the cash
flow position of the business.
3. Just like profit making concern, the
non-profit organizations also make
cash flow statement with the same
objective
Analysing and interpreting the financial statement
Gearing ratio: This ratio determines the proportion of company’ debt in its capital
structure in respect to the total assets. It determines the overall level of financial risk a
company and its shareholders faces (Dissanayake and Wickramasinghe, 2016). The higher
percentage means the greater amount of financial risk and the lower percentage means that
the company is less dependent on the financial leverage which makes its equity position
much stronger. The Aurora PLC has the gearing ratio of 60.95% which means that the
company is highly leverage as a result company would beat the greater risk and during the
hard times the company might be susceptible to bankruptcy as it total debt is 60.95% of total
assets which is high. Thus, Aurora PLC need to take steps to reduce it.
Particulars Formula 2019
Total debt 9067600
Total Assets 14876280
Gearing ratio (Total debt/ Total assets) 60.95%
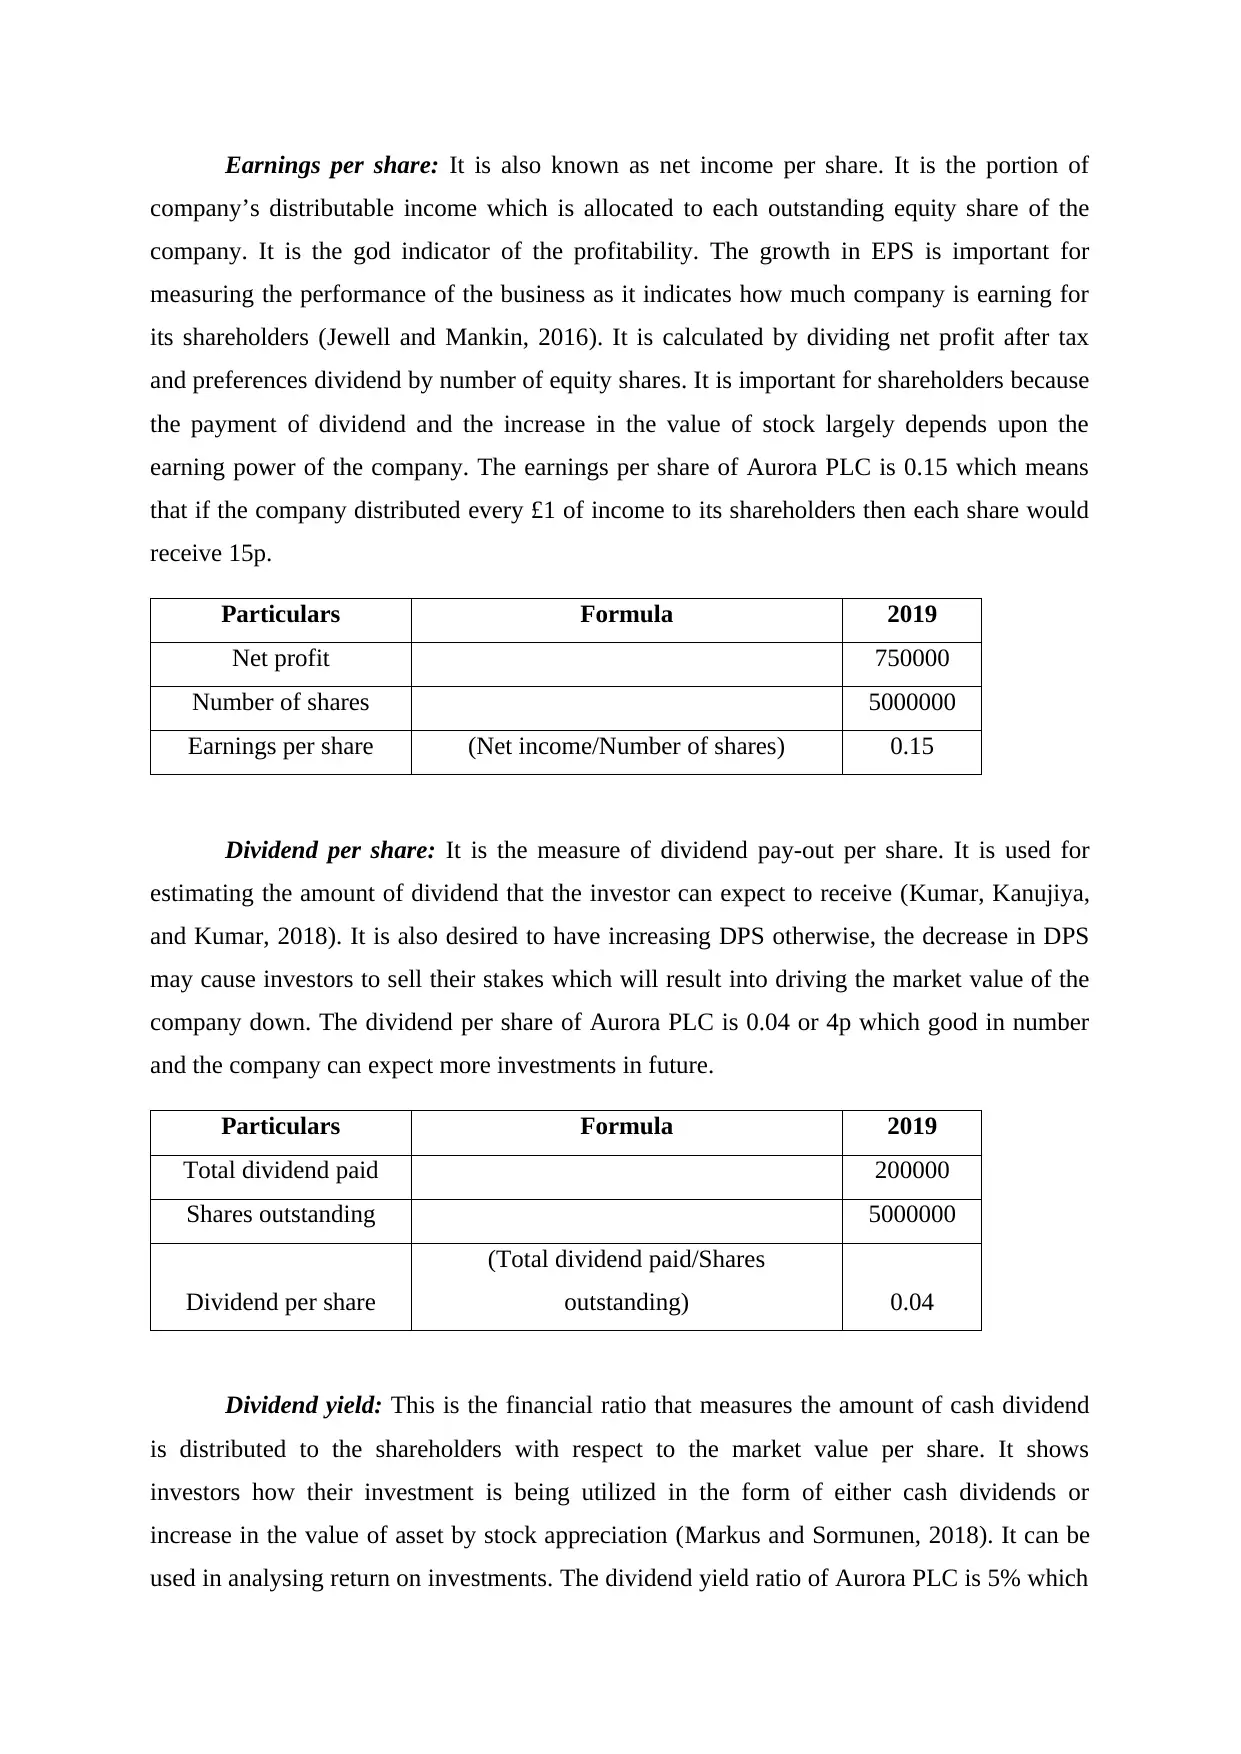
Earnings per share: It is also known as net income per share. It is the portion of
company’s distributable income which is allocated to each outstanding equity share of the
company. It is the god indicator of the profitability. The growth in EPS is important for
measuring the performance of the business as it indicates how much company is earning for
its shareholders (Jewell and Mankin, 2016). It is calculated by dividing net profit after tax
and preferences dividend by number of equity shares. It is important for shareholders because
the payment of dividend and the increase in the value of stock largely depends upon the
earning power of the company. The earnings per share of Aurora PLC is 0.15 which means
that if the company distributed every £1 of income to its shareholders then each share would
receive 15p.
Particulars Formula 2019
Net profit 750000
Number of shares 5000000
Earnings per share (Net income/Number of shares) 0.15
Dividend per share: It is the measure of dividend pay-out per share. It is used for
estimating the amount of dividend that the investor can expect to receive (Kumar, Kanujiya,
and Kumar, 2018). It is also desired to have increasing DPS otherwise, the decrease in DPS
may cause investors to sell their stakes which will result into driving the market value of the
company down. The dividend per share of Aurora PLC is 0.04 or 4p which good in number
and the company can expect more investments in future.
Particulars Formula 2019
Total dividend paid 200000
Shares outstanding 5000000
Dividend per share
(Total dividend paid/Shares
outstanding) 0.04
Dividend yield: This is the financial ratio that measures the amount of cash dividend
is distributed to the shareholders with respect to the market value per share. It shows
investors how their investment is being utilized in the form of either cash dividends or
increase in the value of asset by stock appreciation (Markus and Sormunen, 2018). It can be
used in analysing return on investments. The dividend yield ratio of Aurora PLC is 5% which
⊘ This is a preview!⊘
Do you want full access?
Subscribe today to unlock all pages.
Trusted by 1+ million students worldwide
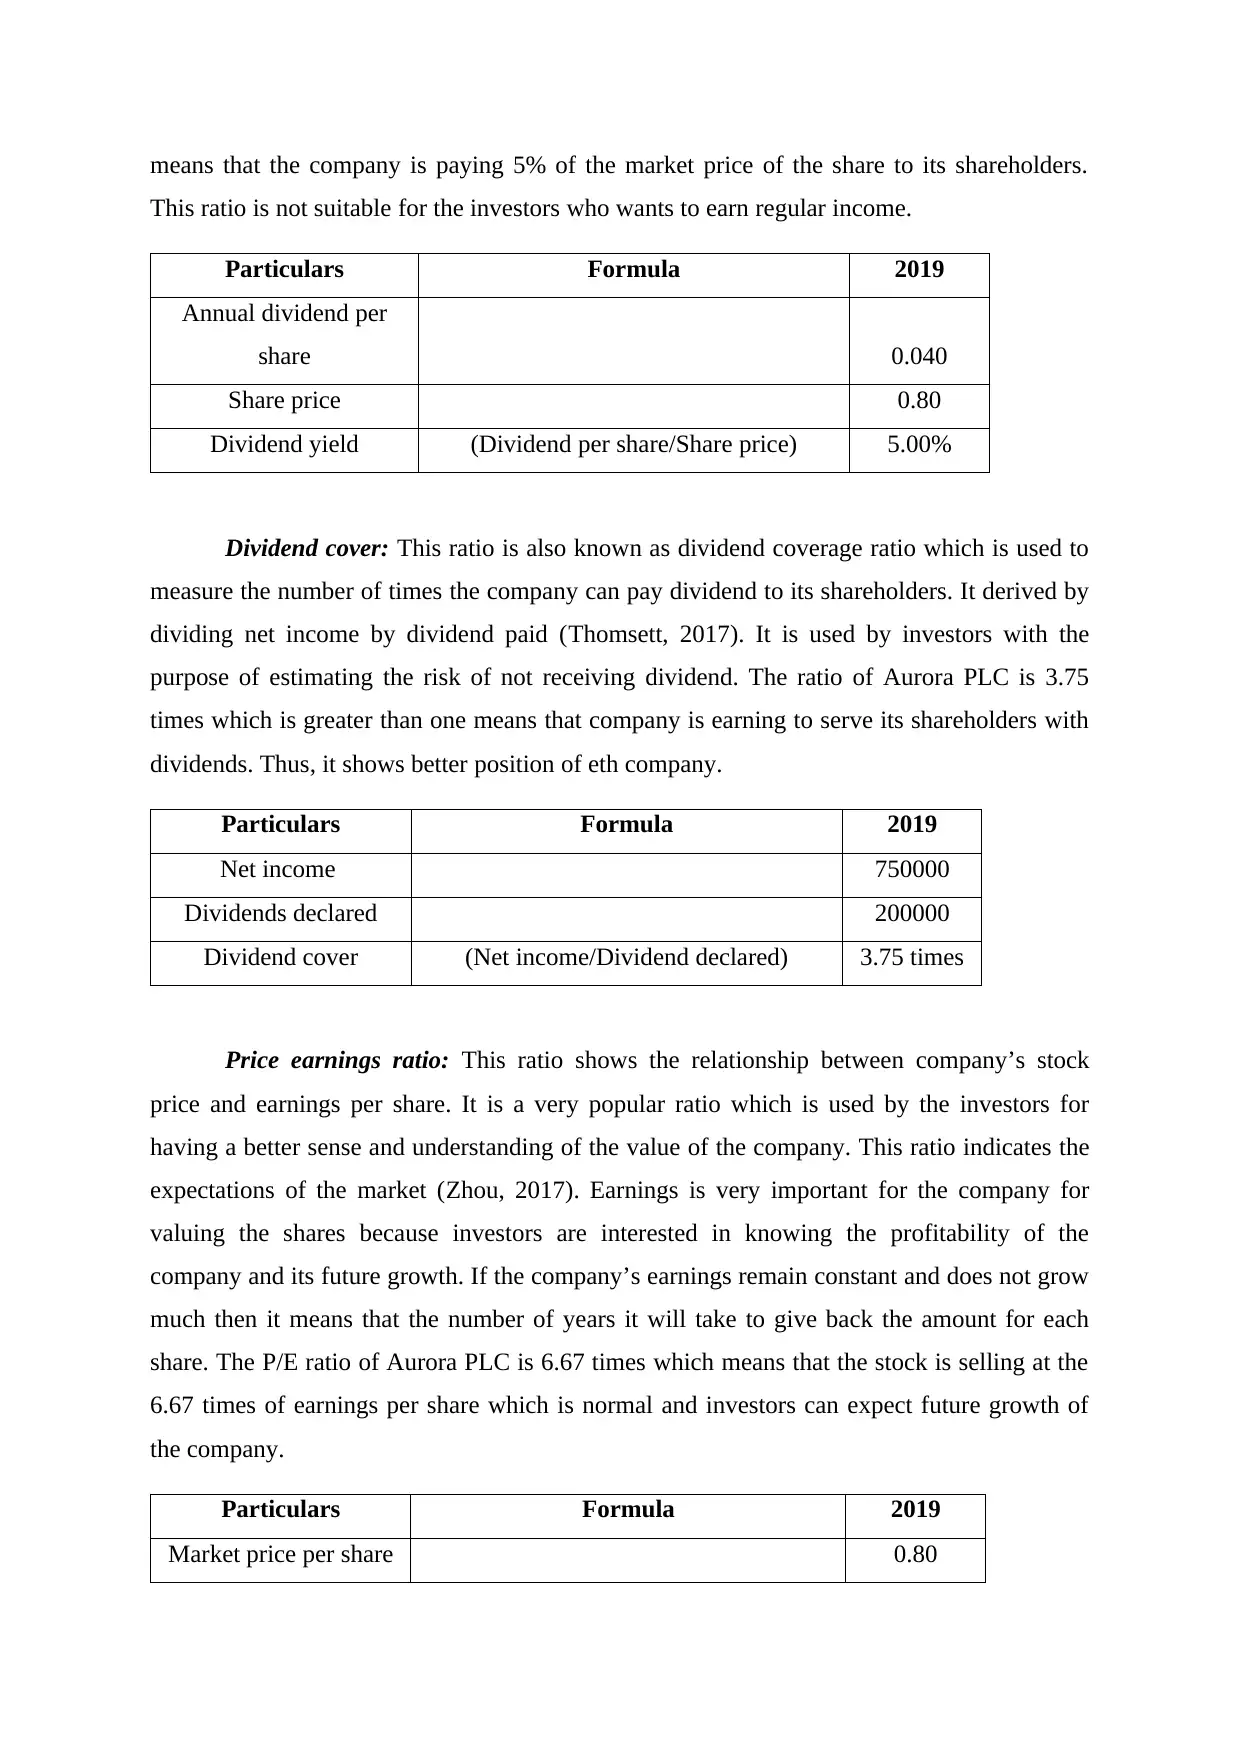
means that the company is paying 5% of the market price of the share to its shareholders.
This ratio is not suitable for the investors who wants to earn regular income.
Particulars Formula 2019
Annual dividend per
share 0.040
Share price 0.80
Dividend yield (Dividend per share/Share price) 5.00%
Dividend cover: This ratio is also known as dividend coverage ratio which is used to
measure the number of times the company can pay dividend to its shareholders. It derived by
dividing net income by dividend paid (Thomsett, 2017). It is used by investors with the
purpose of estimating the risk of not receiving dividend. The ratio of Aurora PLC is 3.75
times which is greater than one means that company is earning to serve its shareholders with
dividends. Thus, it shows better position of eth company.
Particulars Formula 2019
Net income 750000
Dividends declared 200000
Dividend cover (Net income/Dividend declared) 3.75 times
Price earnings ratio: This ratio shows the relationship between company’s stock
price and earnings per share. It is a very popular ratio which is used by the investors for
having a better sense and understanding of the value of the company. This ratio indicates the
expectations of the market (Zhou, 2017). Earnings is very important for the company for
valuing the shares because investors are interested in knowing the profitability of the
company and its future growth. If the company’s earnings remain constant and does not grow
much then it means that the number of years it will take to give back the amount for each
share. The P/E ratio of Aurora PLC is 6.67 times which means that the stock is selling at the
6.67 times of earnings per share which is normal and investors can expect future growth of
the company.
Particulars Formula 2019
Market price per share 0.80
Paraphrase This Document
Need a fresh take? Get an instant paraphrase of this document with our AI Paraphraser
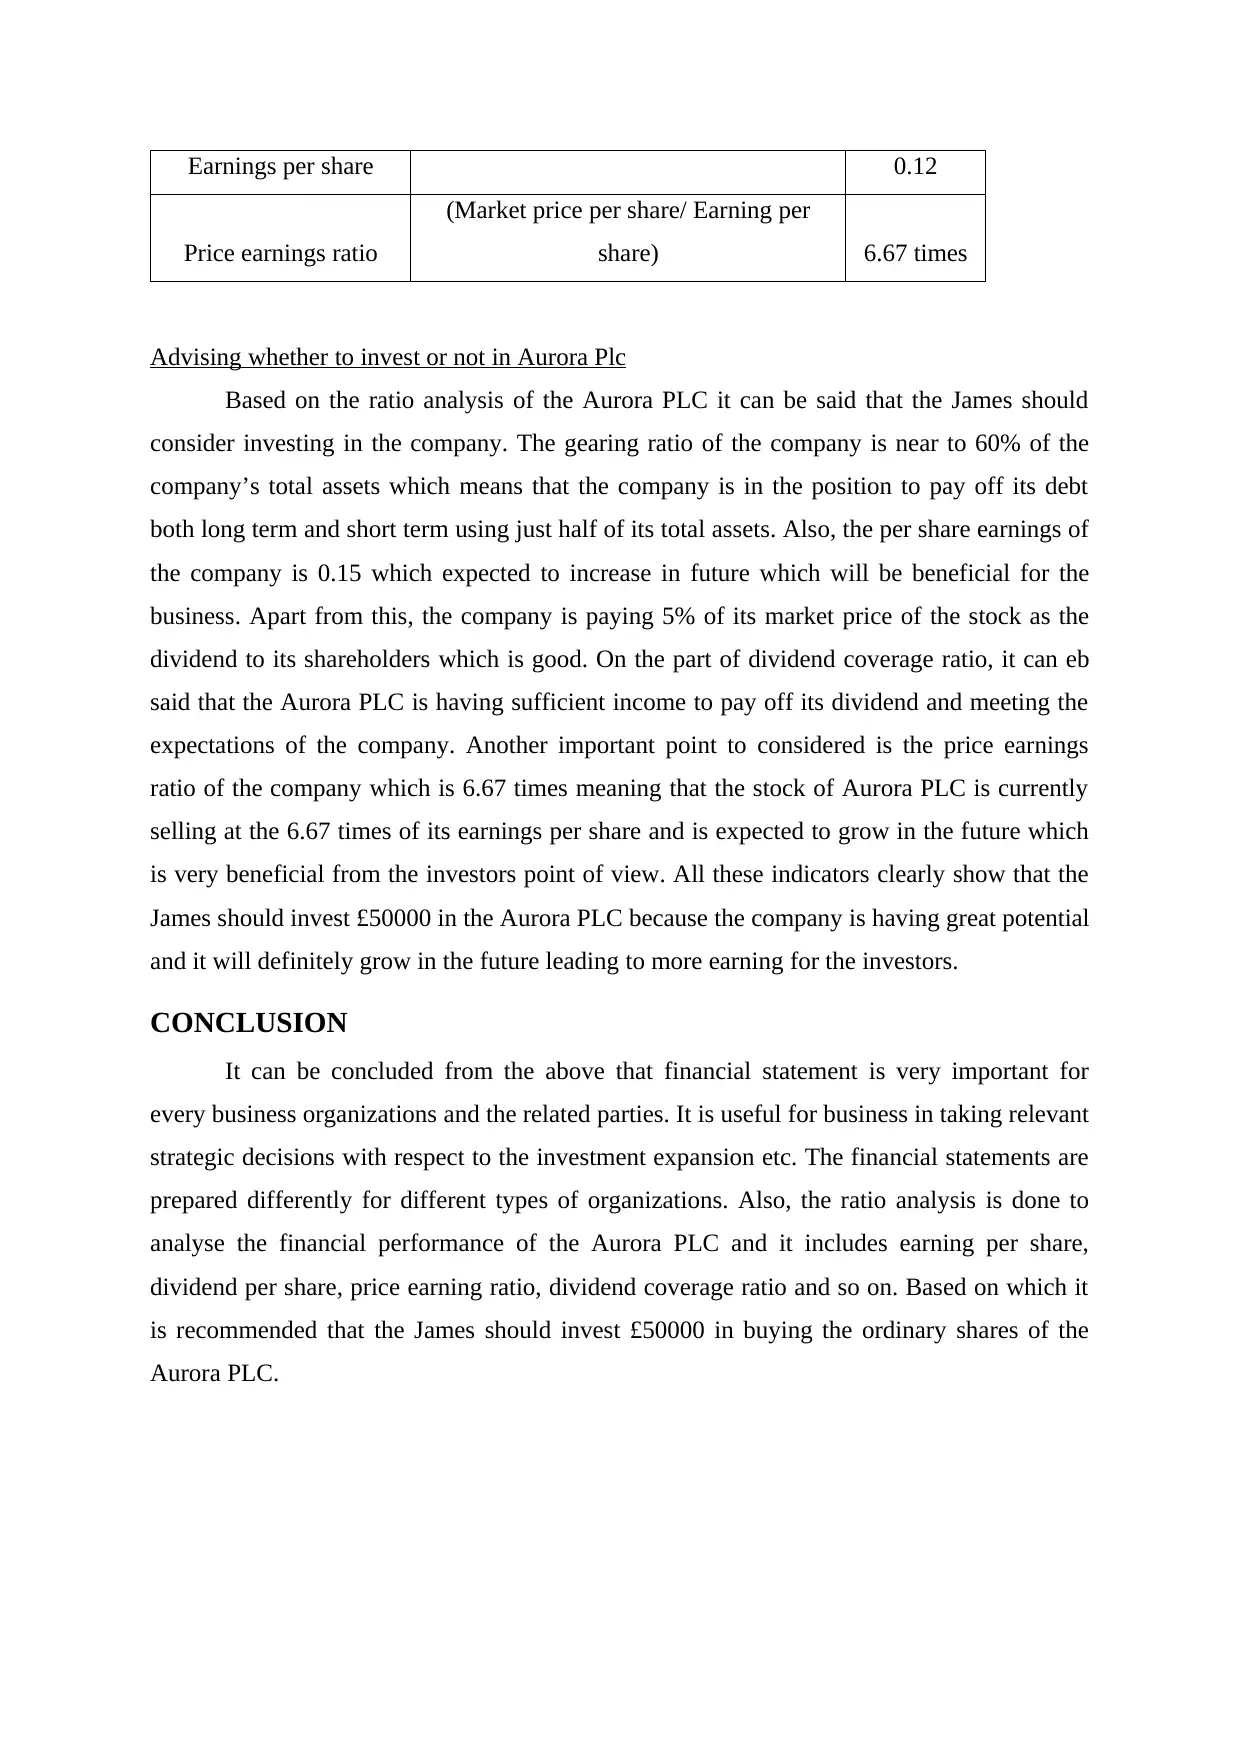
Earnings per share 0.12
Price earnings ratio
(Market price per share/ Earning per
share) 6.67 times
Advising whether to invest or not in Aurora Plc
Based on the ratio analysis of the Aurora PLC it can be said that the James should
consider investing in the company. The gearing ratio of the company is near to 60% of the
company’s total assets which means that the company is in the position to pay off its debt
both long term and short term using just half of its total assets. Also, the per share earnings of
the company is 0.15 which expected to increase in future which will be beneficial for the
business. Apart from this, the company is paying 5% of its market price of the stock as the
dividend to its shareholders which is good. On the part of dividend coverage ratio, it can eb
said that the Aurora PLC is having sufficient income to pay off its dividend and meeting the
expectations of the company. Another important point to considered is the price earnings
ratio of the company which is 6.67 times meaning that the stock of Aurora PLC is currently
selling at the 6.67 times of its earnings per share and is expected to grow in the future which
is very beneficial from the investors point of view. All these indicators clearly show that the
James should invest £50000 in the Aurora PLC because the company is having great potential
and it will definitely grow in the future leading to more earning for the investors.
CONCLUSION
It can be concluded from the above that financial statement is very important for
every business organizations and the related parties. It is useful for business in taking relevant
strategic decisions with respect to the investment expansion etc. The financial statements are
prepared differently for different types of organizations. Also, the ratio analysis is done to
analyse the financial performance of the Aurora PLC and it includes earning per share,
dividend per share, price earning ratio, dividend coverage ratio and so on. Based on which it
is recommended that the James should invest £50000 in buying the ordinary shares of the
Aurora PLC.
REFERENCES
Books and journals
Bajgier, C. M. and et.al , 2019. Providing financial account information to users. U.S. Patent
10,169,812.
Berisha Vokshi, N. and Xhelili Krasniqi, F., 2017, September. Role of Accounting
Information in Decision-Making Process, the Importance for its Users. In 2017
ENTRENOVA Conference Proceedings.
Dissanayake, S. and Wickramasinghe, M., 2016. Earnings Fluctuation on Share Price
Volatility. Account and Financial Management Journal. 1(5).
Drake, M. S., Hales, J. and Rees, L., 2019. Disclosure Overload? A Professional User
Perspective on the Usefulness of General Purpose Financial Statements. Contemporary
Accounting Research. 36(4). pp.1935-1965.
Hirzel, A. K. and et.al, 2016. Understanding online financial communities: What constitutes a
valuable information exchange for users?.
Jewell, J. J. and Mankin, J. A., 2016. What Is Your EPS? Issues In Computing And
Interpreting Earnings Per Share. Jewell, JJ and Mankin, JA (2016). What is Your EPS.
pp.48-61.
Kumar, A., Kanujiya, P. K. and Kumar, P., 2018. Impact of profitability on dividend policy
of public and private sector bank in India. Asian Man (The)-An International
Journal. 12(1). pp.43-47.
Markus, D. and Sormunen, J., 2018. A study of value investment strategies based on dividend
yield, price-to-earnings and price-to-book ratios in Swedish stock market.
Sedláček, J., 2016. Financial Statements in the Financial Decision Making. European
Financial Systems 2016. p.678.
Thomsett, M. C., 2017. The Dividend Effect. In The Mathematics of Options (pp. 79-97).
Palgrave Macmillan, Cham.
Zhou, J., 2017, July. Earnings Growth Potential Implicit in Price-Earnings Ratio. In 2017 3rd
International Conference on Economics, Social Science, Arts, Education and
Management Engineering (ESSAEME 2017). Atlantis Press.
⊘ This is a preview!⊘
Do you want full access?
Subscribe today to unlock all pages.
Trusted by 1+ million students worldwide
1 out of 9
Related Documents


Your All-in-One AI-Powered Toolkit for Academic Success.
+13062052269
info@desklib.com
Available 24*7 on WhatsApp / Email
![[object Object]](/_next/static/media/star-bottom.7253800d.svg)
Unlock your academic potential
Copyright © 2020–2026 A2Z Services. All Rights Reserved. Developed and managed by ZUCOL.