Financial Accounting and Costing Assignment Solution

Verified

Added on  2020/03/04

|10
|1170
|49
Homework Assignment
AI Summary
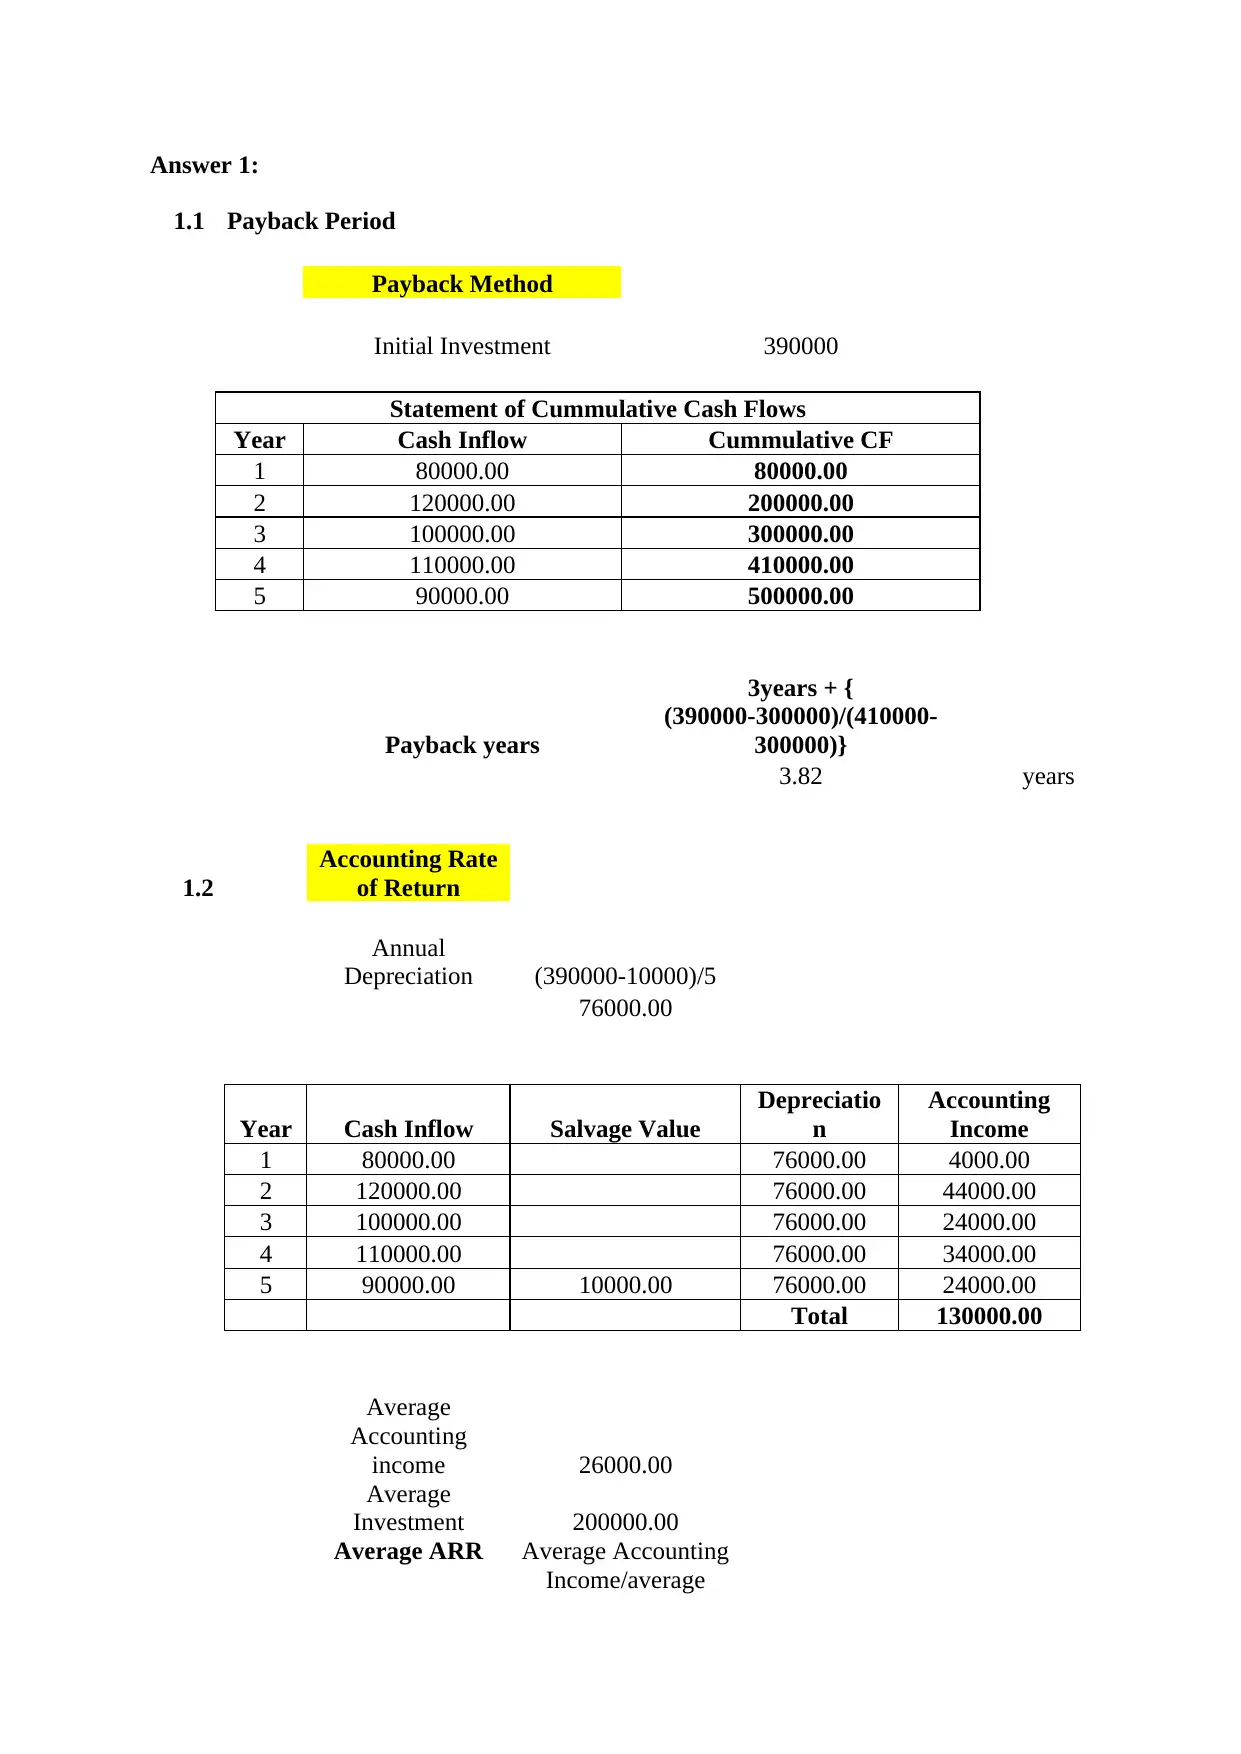
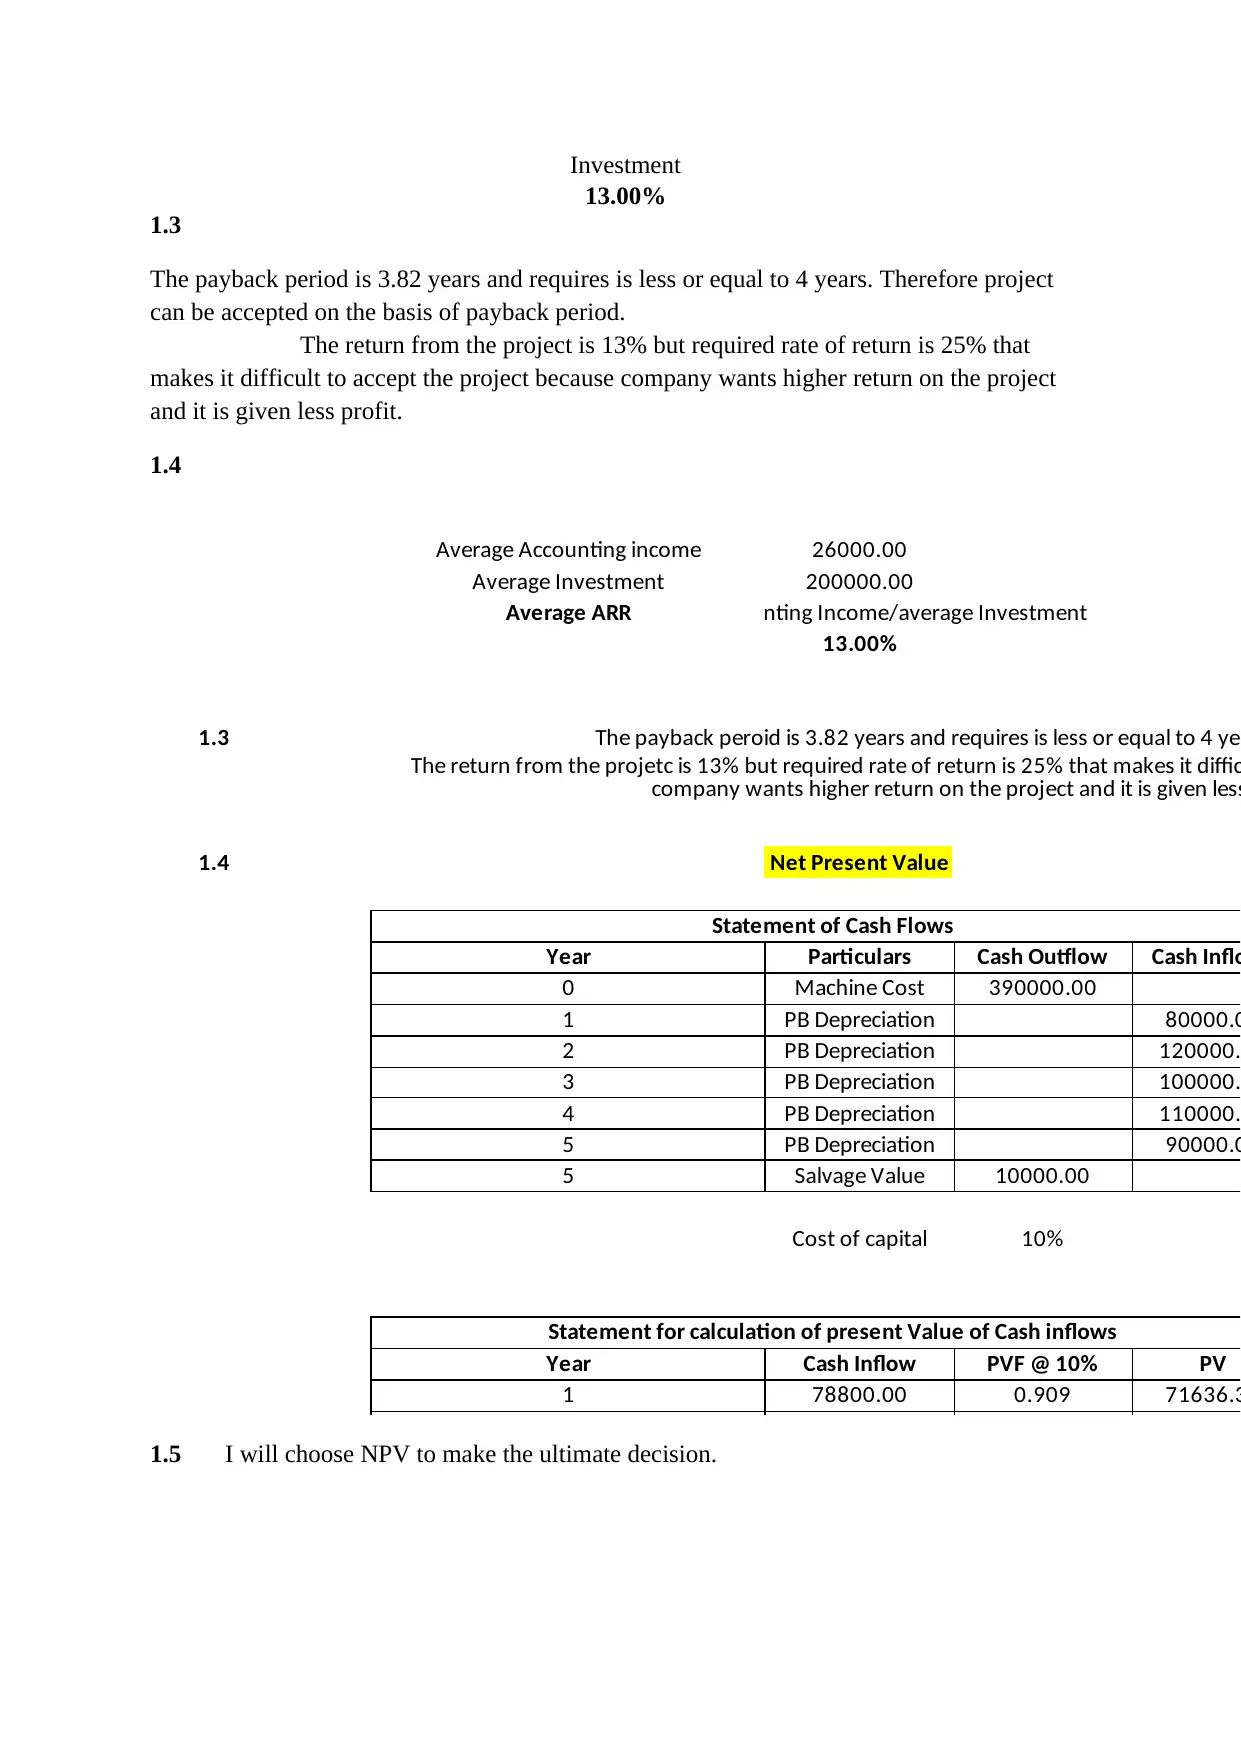
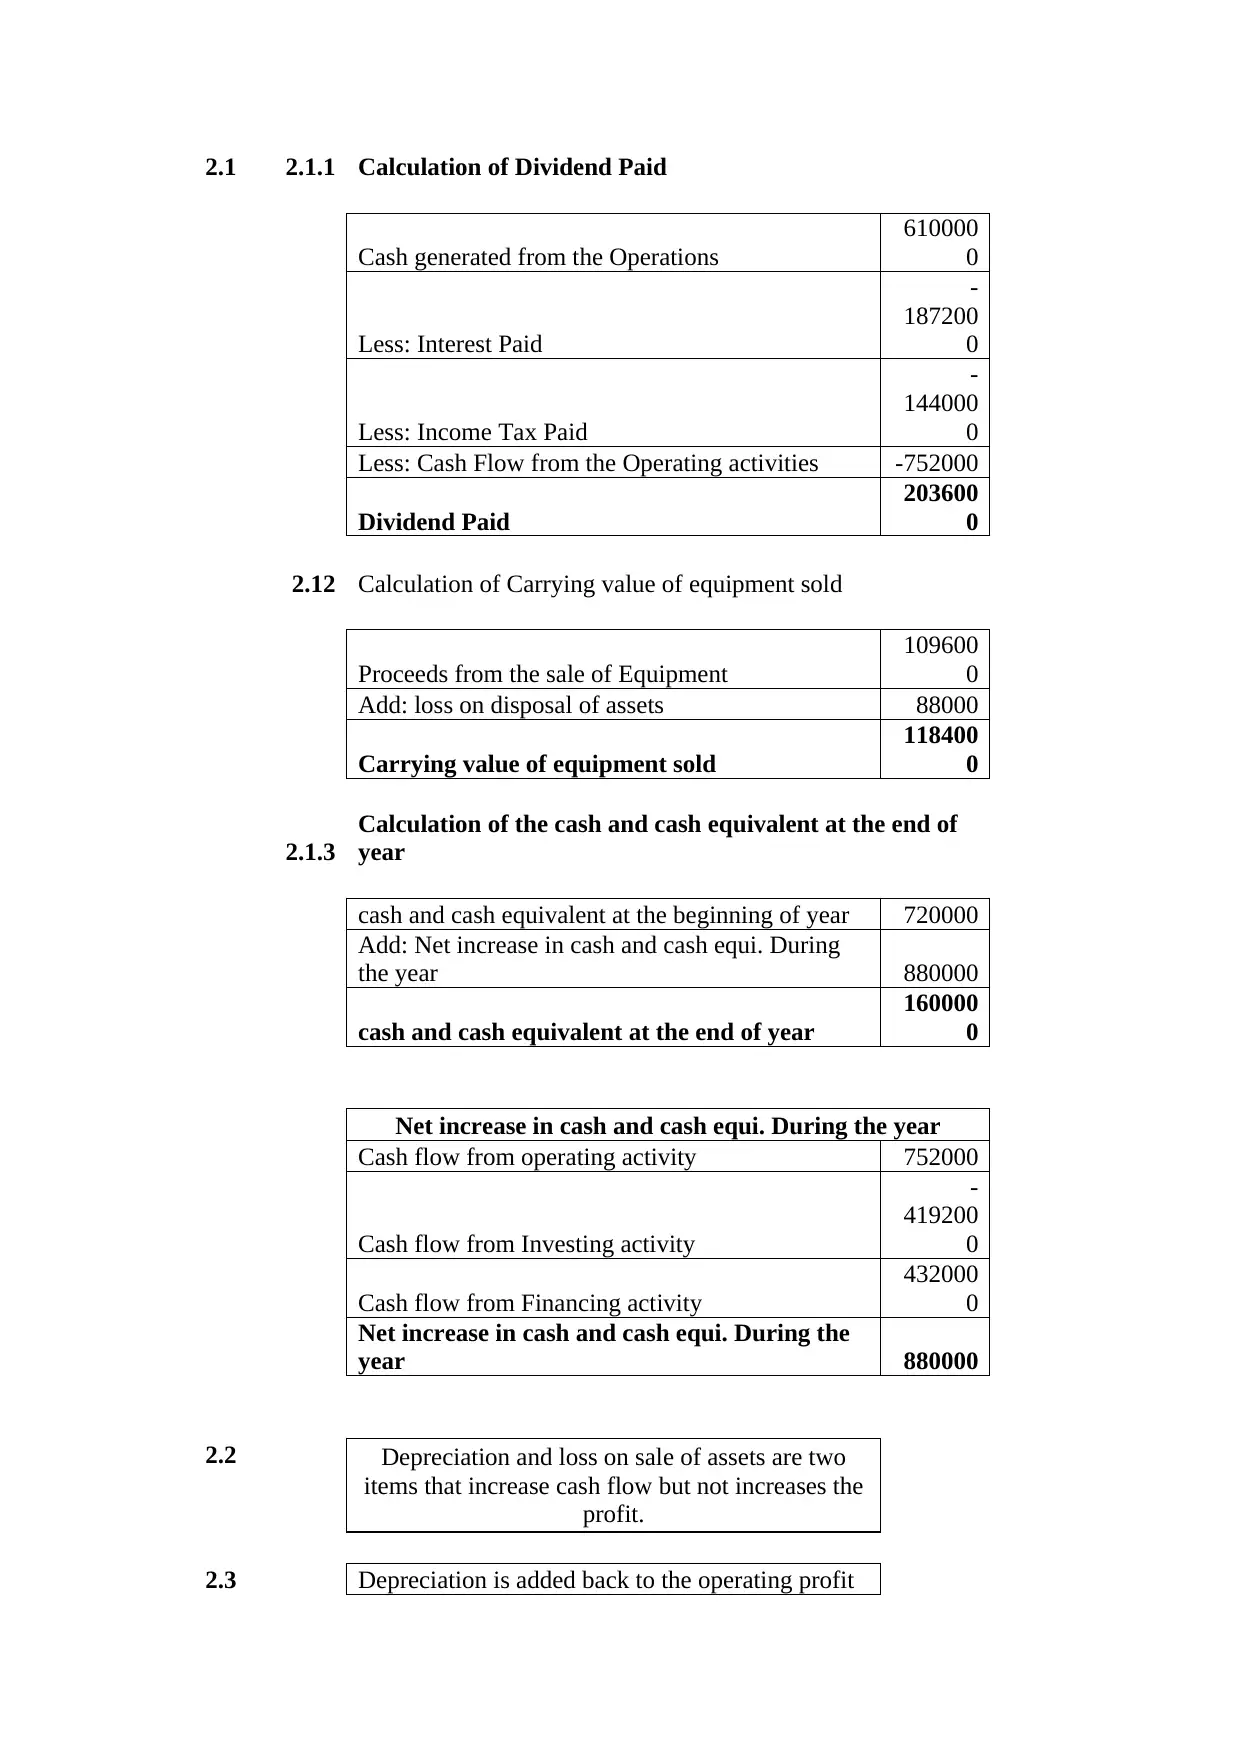
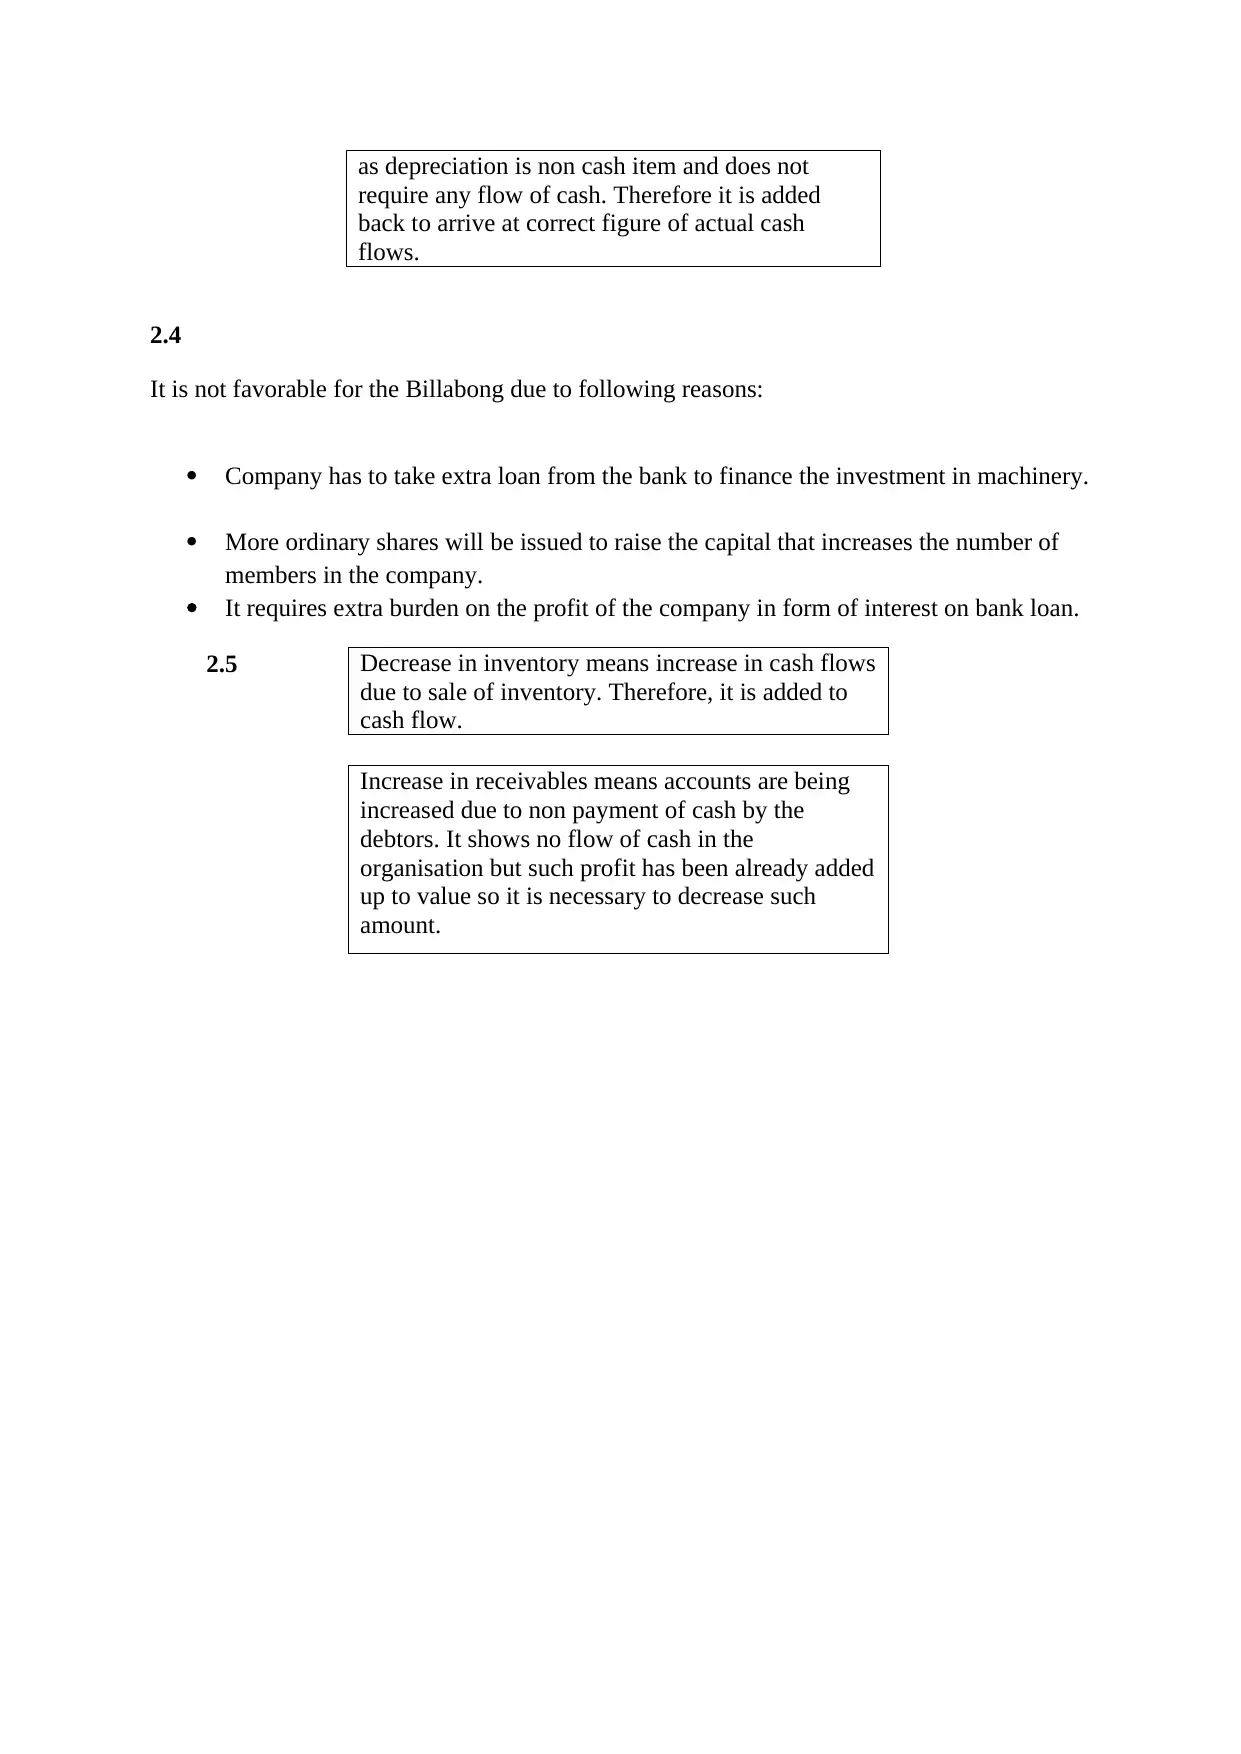
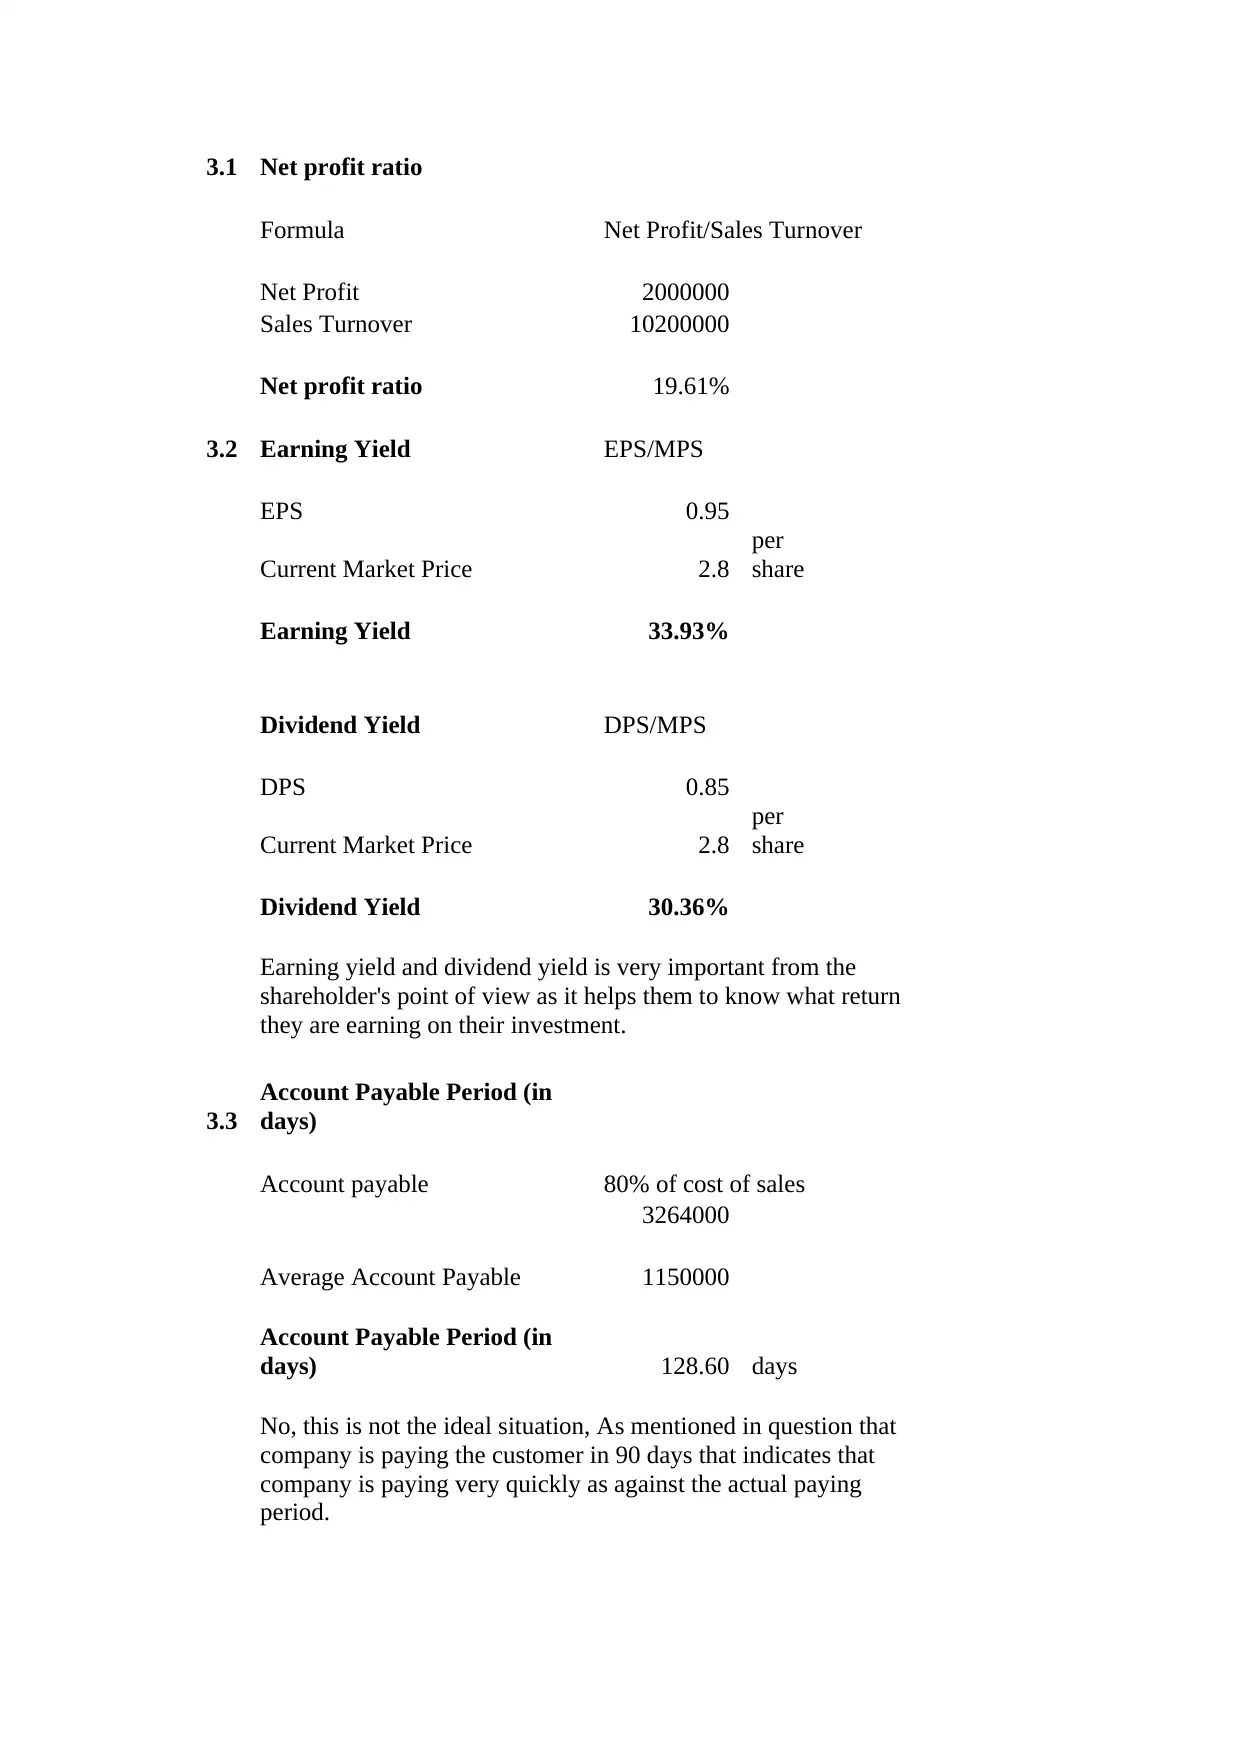
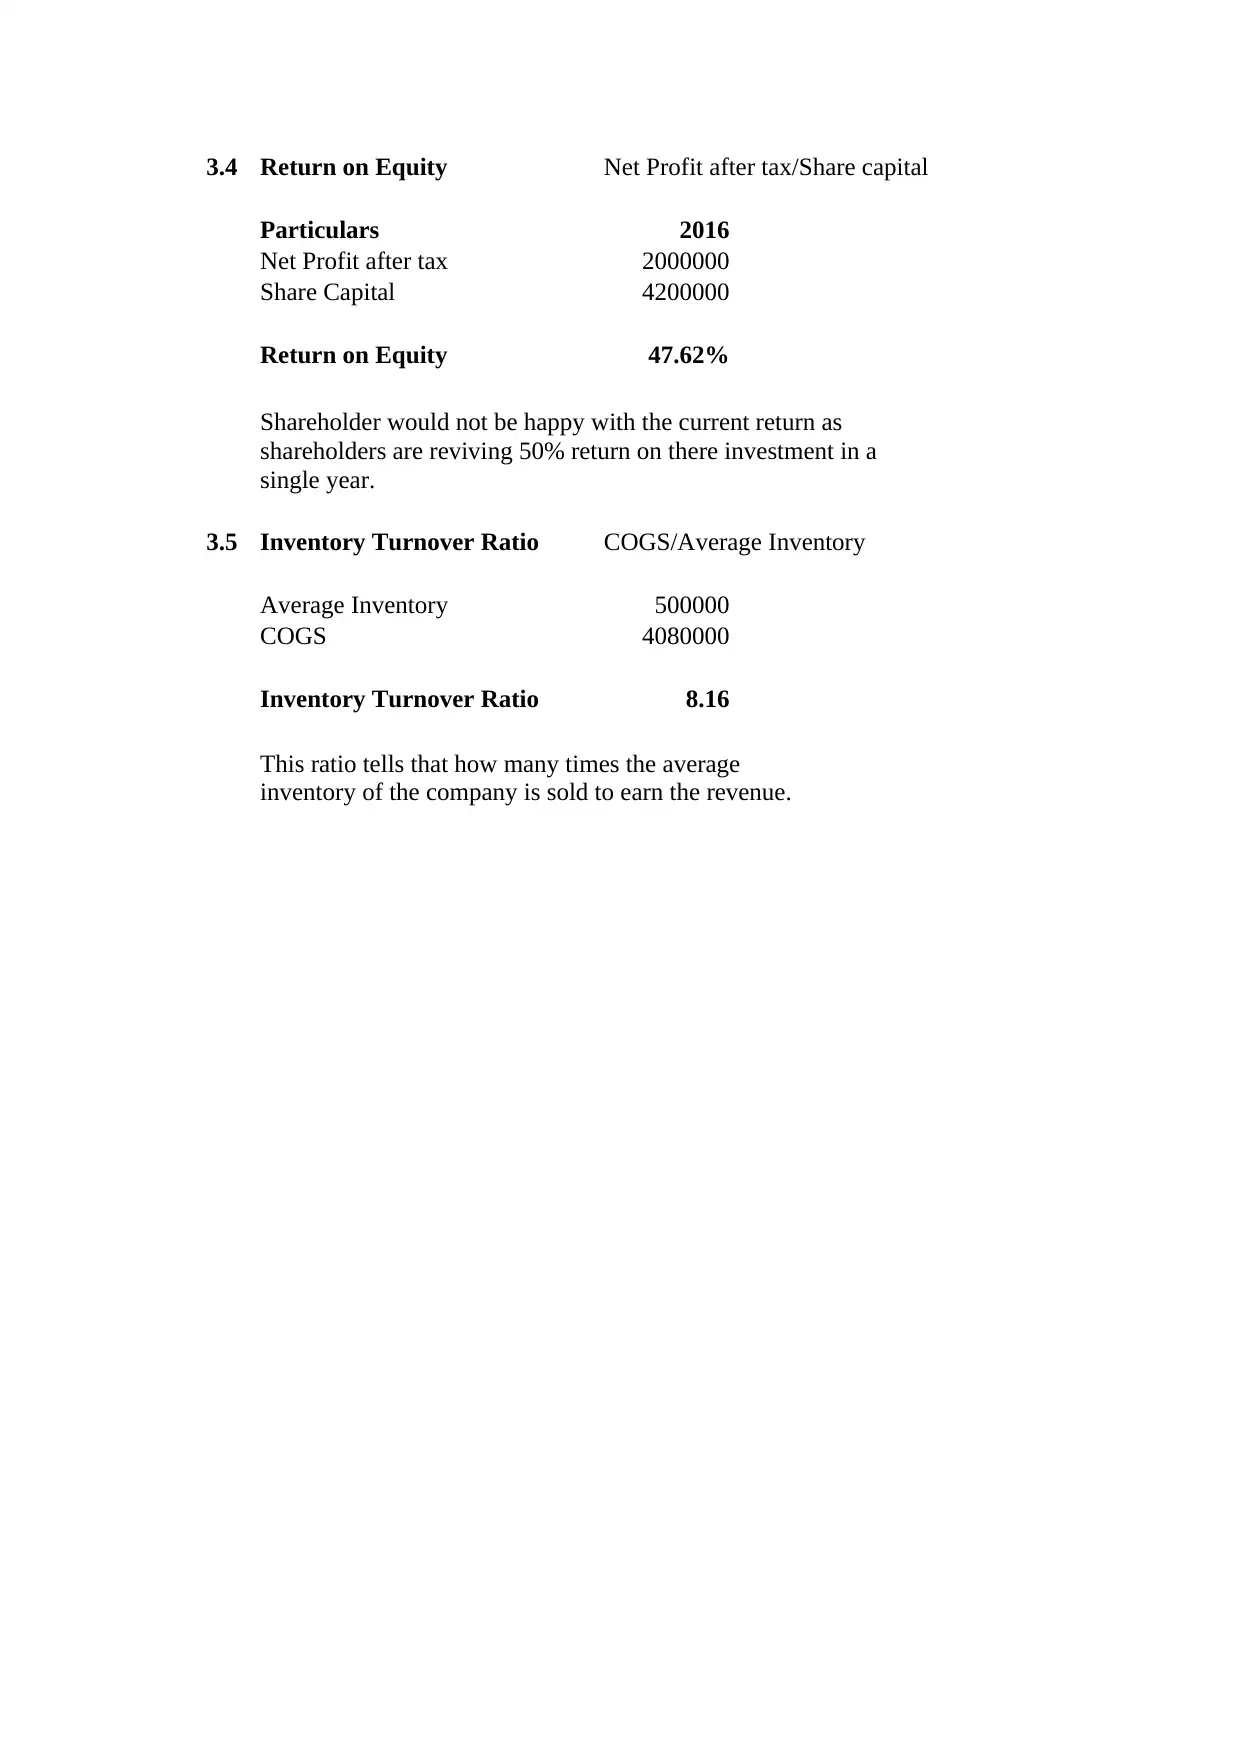
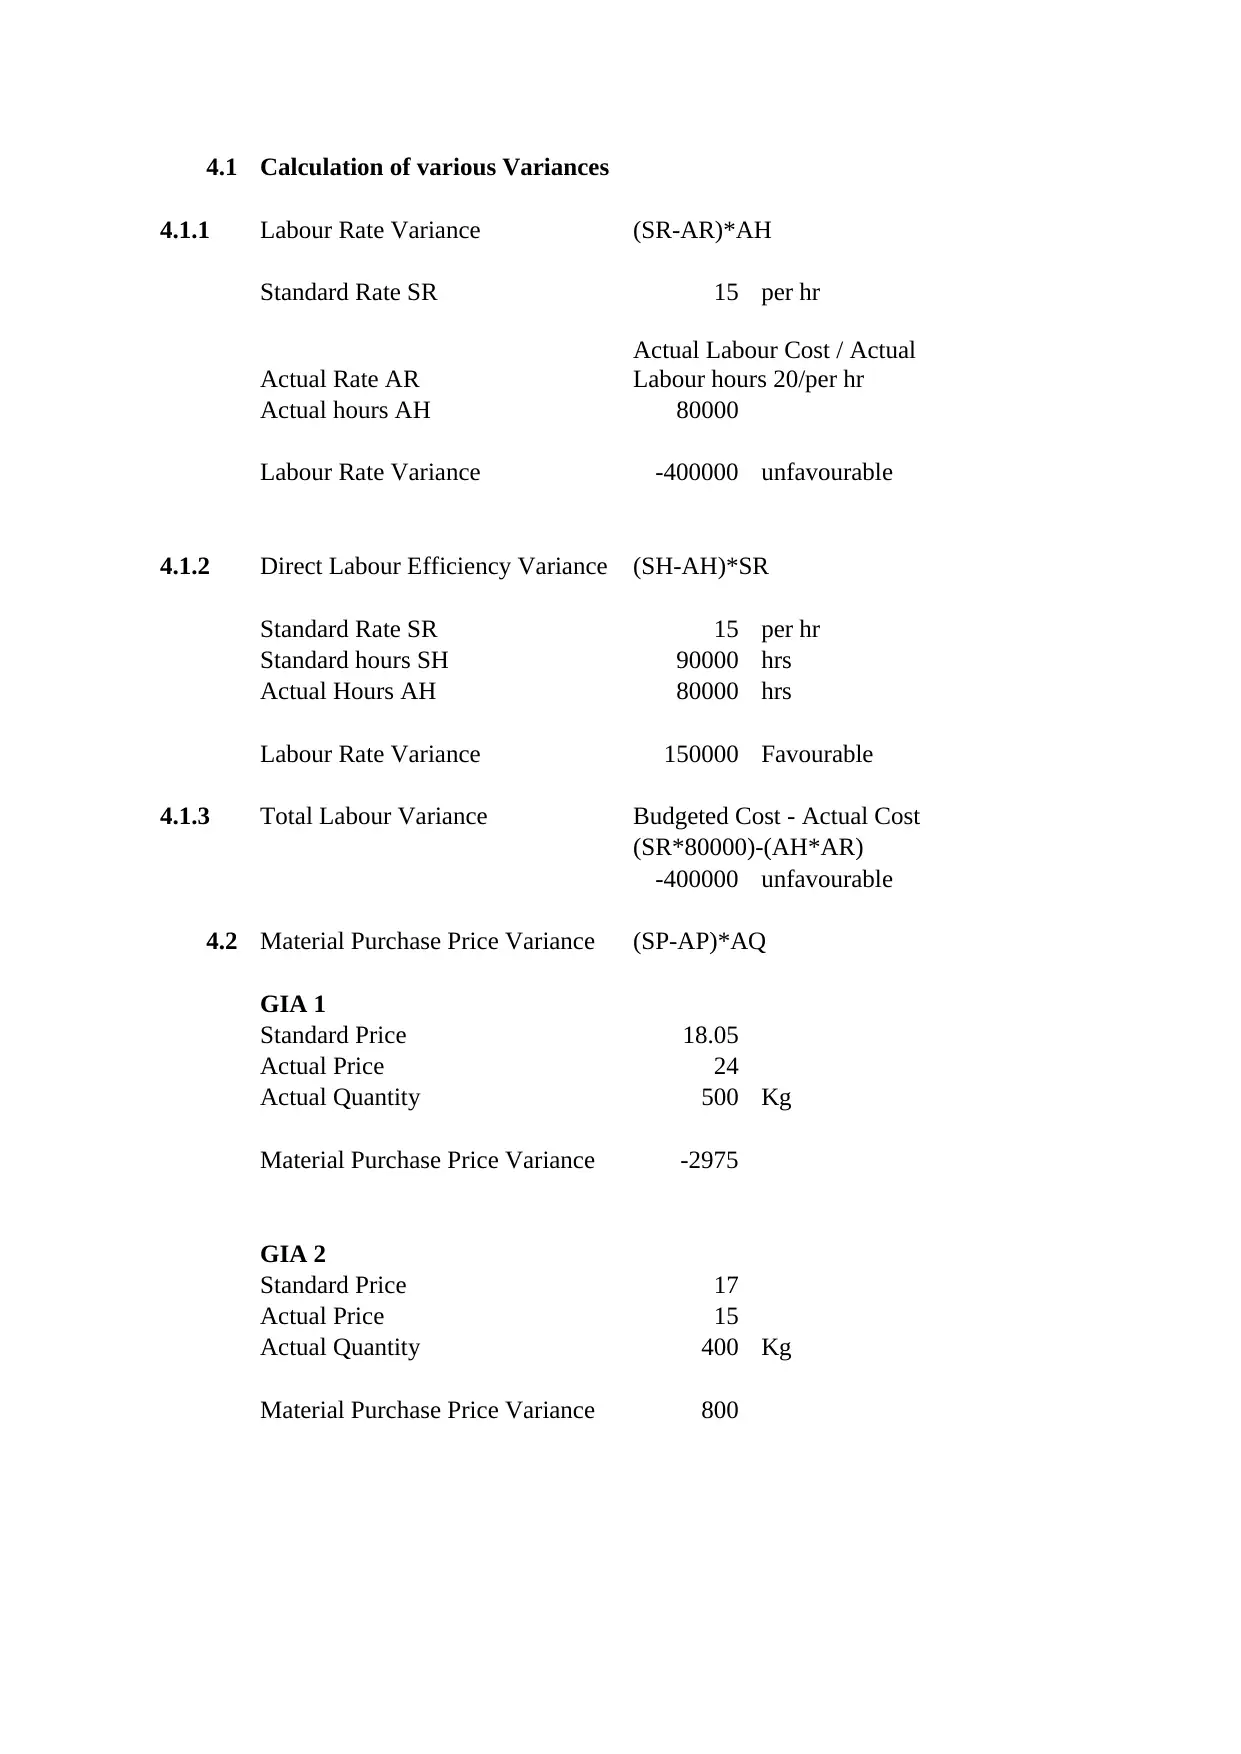
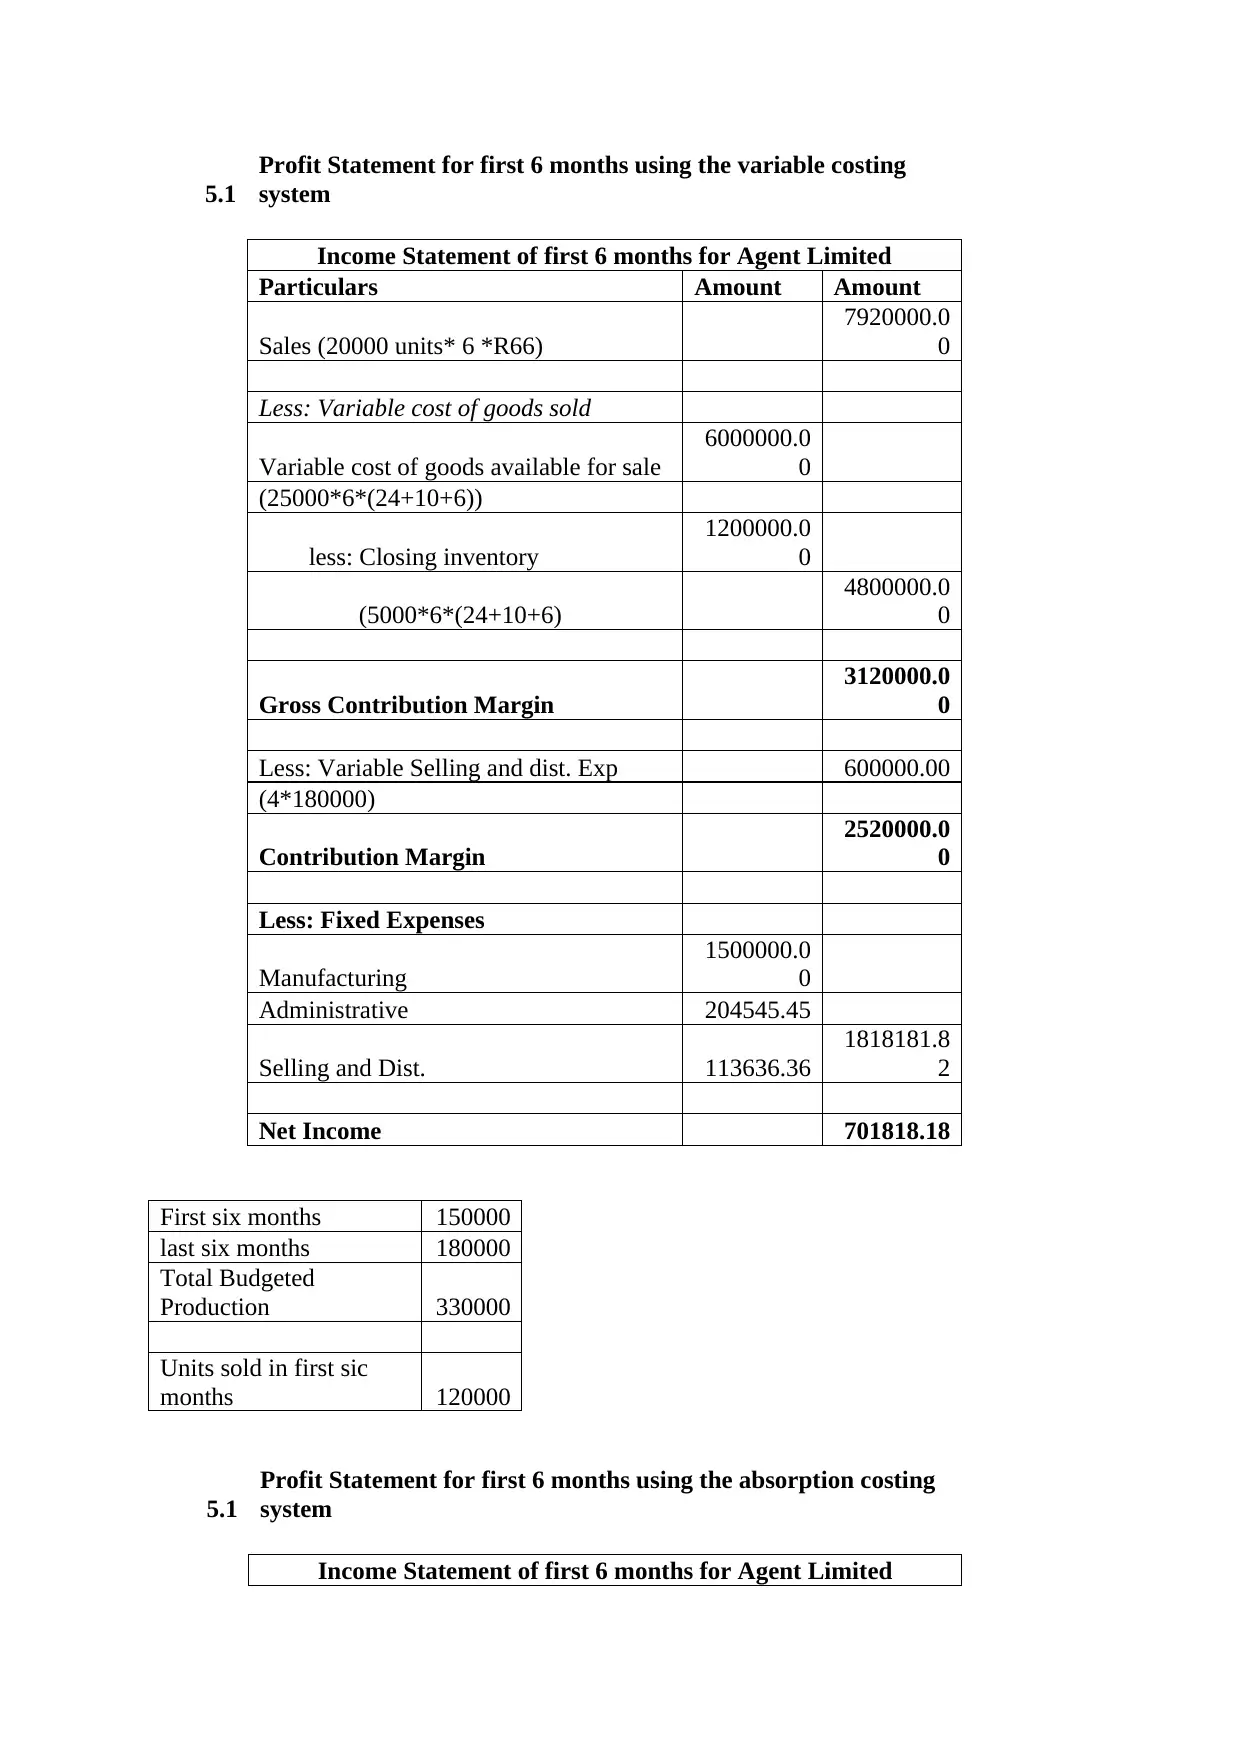
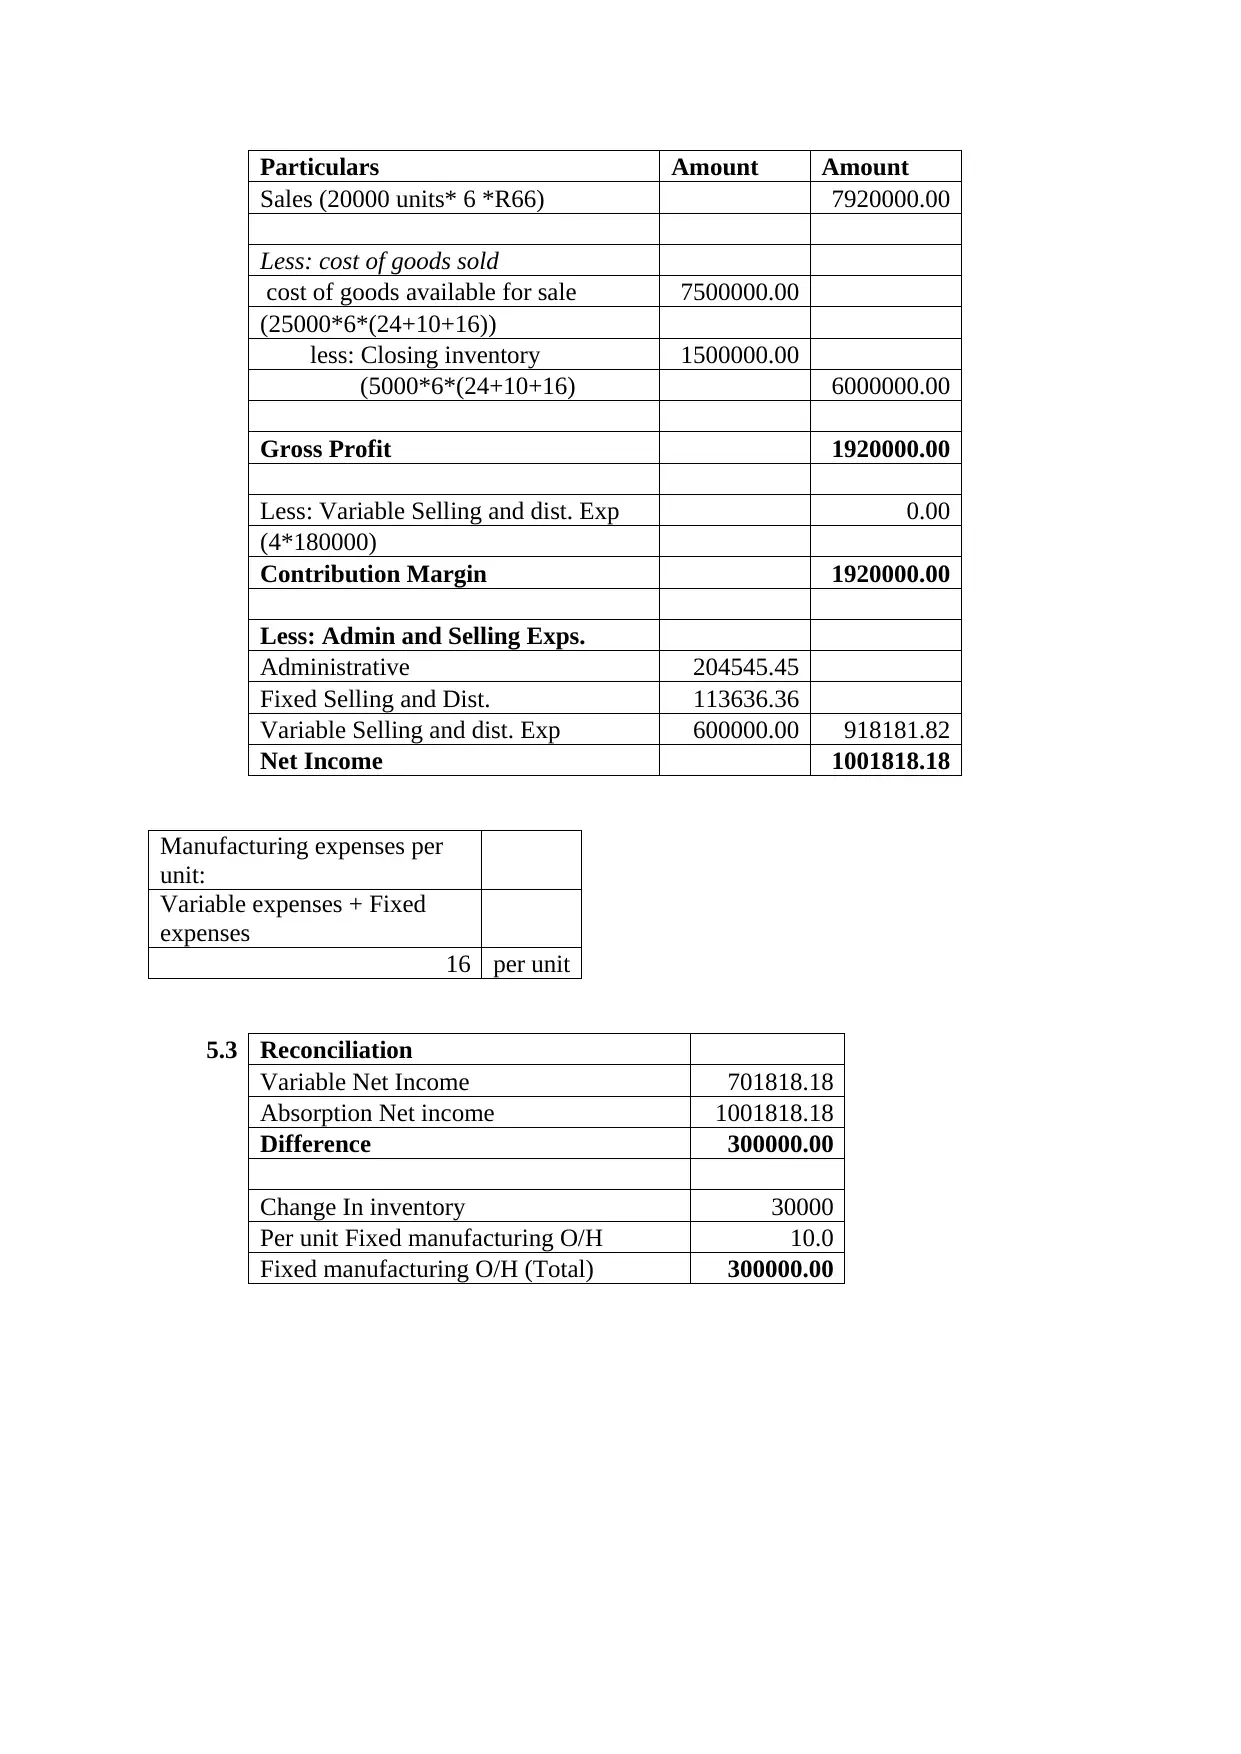
This finance assignment solution provides detailed answers to various financial analysis and accounting problems. It includes calculations and analysis of the payback period, accounting rate of return, and cash flow statements. The solution also covers financial ratio analysis, including net profit ratio, earning yield, dividend yield, and return on equity. Furthermore, it addresses variance analysis, including labor and material variances. Finally, the assignment explores variable and absorption costing methods and reconciles the differences in net income under these two approaches. The assignment demonstrates a comprehensive understanding of financial accounting and analysis techniques. The solution is provided by a student to be published on the website Desklib. Desklib is a platform which provides all the necessary AI based study tools for students.
Document Page
Accounting and Finance Assignment
tabler-icon-diamond-filled.svg

Paraphrase This Document

Need a fresh take? Get an instant paraphrase of this document with our AI Paraphraser
Document Page
Answer 1:
1.1 Payback Period
Payback Method
Initial Investment 390000
Statement of Cummulative Cash Flows
Year Cash Inflow Cummulative CF
1 80000.00 80000.00
2 120000.00 200000.00
3 100000.00 300000.00
4 110000.00 410000.00
5 90000.00 500000.00
Payback years
3years + {
(390000-300000)/(410000-
300000)}
3.82 years
1.2
Accounting Rate
of Return
Annual
Depreciation (390000-10000)/5
76000.00
Year Cash Inflow Salvage Value
Depreciatio
n
Accounting
Income
1 80000.00 76000.00 4000.00
2 120000.00 76000.00 44000.00
3 100000.00 76000.00 24000.00
4 110000.00 76000.00 34000.00
5 90000.00 10000.00 76000.00 24000.00
Total 130000.00
Average
Accounting
income 26000.00
Average
Investment 200000.00
Average ARR Average Accounting
Income/average
Document Page
Investment
13.00%
1.3
The payback period is 3.82 years and requires is less or equal to 4 years. Therefore project
can be accepted on the basis of payback period.
The return from the project is 13% but required rate of return is 25% that
makes it difficult to accept the project because company wants higher return on the project
and it is given less profit.
1.4
Average Accounting income 26000.00
Average Investment 200000.00
Average ARRAverage Acounting Income/average Investment
13.00%
1.3 The payback peroid is 3.82 years and requires is less or equal to 4 ye
1.4 Net Present Value
Statement of Cash Flows
Year Particulars Cash Outflow Cash Inflo
0 Machine Cost 390000.00
1 PB Depreciation 80000.0
2 PB Depreciation 120000.
3 PB Depreciation 100000.
4 PB Depreciation 110000.
5 PB Depreciation 90000.0
5 Salvage Value 10000.00
Cost of capital 10%
Statement for calculation of present Value of Cash inflows
Year Cash Inflow PVF @ 10% PV
1 78800.00 0.909 71636.3
The return from the projetc is 13% but required rate of return is 25% that makes it diffic
company wants higher return on the project and it is given less
1.5 I will choose NPV to make the ultimate decision.
Document Page
2.1 2.1.1 Calculation of Dividend Paid
Cash generated from the Operations
610000
0
Less: Interest Paid
-
187200
0
Less: Income Tax Paid
-
144000
0
Less: Cash Flow from the Operating activities -752000
Dividend Paid
203600
0
2.12 Calculation of Carrying value of equipment sold
Proceeds from the sale of Equipment
109600
0
Add: loss on disposal of assets 88000
Carrying value of equipment sold
118400
0
2.1.3
Calculation of the cash and cash equivalent at the end of
year
cash and cash equivalent at the beginning of year 720000
Add: Net increase in cash and cash equi. During
the year 880000
cash and cash equivalent at the end of year
160000
0
Net increase in cash and cash equi. During the year
Cash flow from operating activity 752000
Cash flow from Investing activity
-
419200
0
Cash flow from Financing activity
432000
0
Net increase in cash and cash equi. During the
year 880000
2.2 Depreciation and loss on sale of assets are two
items that increase cash flow but not increases the
profit.
2.3 Depreciation is added back to the operating profit
tabler-icon-diamond-filled.svg

Paraphrase This Document

Need a fresh take? Get an instant paraphrase of this document with our AI Paraphraser
Document Page
as depreciation is non cash item and does not
require any flow of cash. Therefore it is added
back to arrive at correct figure of actual cash
flows.
2.4
It is not favorable for the Billabong due to following reasons:
ď‚· Company has to take extra loan from the bank to finance the investment in machinery.
ď‚· More ordinary shares will be issued to raise the capital that increases the number of
members in the company.
ď‚· It requires extra burden on the profit of the company in form of interest on bank loan.
2.5 Decrease in inventory means increase in cash flows
due to sale of inventory. Therefore, it is added to
cash flow.
Increase in receivables means accounts are being
increased due to non payment of cash by the
debtors. It shows no flow of cash in the
organisation but such profit has been already added
up to value so it is necessary to decrease such
amount.
Document Page
3.1 Net profit ratio
Formula Net Profit/Sales Turnover
Net Profit 2000000
Sales Turnover 10200000
Net profit ratio 19.61%
3.2 Earning Yield EPS/MPS
EPS 0.95
Current Market Price 2.8
per
share
Earning Yield 33.93%
Dividend Yield DPS/MPS
DPS 0.85
Current Market Price 2.8
per
share
Dividend Yield 30.36%
Earning yield and dividend yield is very important from the
shareholder's point of view as it helps them to know what return
they are earning on their investment.
3.3
Account Payable Period (in
days)
Account payable 80% of cost of sales
3264000
Average Account Payable 1150000
Account Payable Period (in
days) 128.60 days
No, this is not the ideal situation, As mentioned in question that
company is paying the customer in 90 days that indicates that
company is paying very quickly as against the actual paying
period.
Document Page
3.4 Return on Equity Net Profit after tax/Share capital
Particulars 2016
Net Profit after tax 2000000
Share Capital 4200000
Return on Equity 47.62%
Shareholder would not be happy with the current return as
shareholders are reviving 50% return on there investment in a
single year.
3.5 Inventory Turnover Ratio COGS/Average Inventory
Average Inventory 500000
COGS 4080000
Inventory Turnover Ratio 8.16
This ratio tells that how many times the average
inventory of the company is sold to earn the revenue.
tabler-icon-diamond-filled.svg

Paraphrase This Document

Need a fresh take? Get an instant paraphrase of this document with our AI Paraphraser
Document Page
4.1 Calculation of various Variances
4.1.1 Labour Rate Variance (SR-AR)*AH
Standard Rate SR 15 per hr
Actual Rate AR
Actual Labour Cost / Actual
Labour hours 20/per hr
Actual hours AH 80000
Labour Rate Variance -400000 unfavourable
4.1.2 Direct Labour Efficiency Variance (SH-AH)*SR
Standard Rate SR 15 per hr
Standard hours SH 90000 hrs
Actual Hours AH 80000 hrs
Labour Rate Variance 150000 Favourable
4.1.3 Total Labour Variance Budgeted Cost - Actual Cost
(SR*80000)-(AH*AR)
-400000 unfavourable
4.2 Material Purchase Price Variance (SP-AP)*AQ
GIA 1
Standard Price 18.05
Actual Price 24
Actual Quantity 500 Kg
Material Purchase Price Variance -2975
GIA 2
Standard Price 17
Actual Price 15
Actual Quantity 400 Kg
Material Purchase Price Variance 800
Document Page
5.1
Profit Statement for first 6 months using the variable costing
system
Income Statement of first 6 months for Agent Limited
Particulars Amount Amount
Sales (20000 units* 6 *R66)
7920000.0
0
Less: Variable cost of goods sold
Variable cost of goods available for sale
6000000.0
0
(25000*6*(24+10+6))
less: Closing inventory
1200000.0
0
(5000*6*(24+10+6)
4800000.0
0
Gross Contribution Margin
3120000.0
0
Less: Variable Selling and dist. Exp 600000.00
(4*180000)
Contribution Margin
2520000.0
0
Less: Fixed Expenses
Manufacturing
1500000.0
0
Administrative 204545.45
Selling and Dist. 113636.36
1818181.8
2
Net Income 701818.18
First six months 150000
last six months 180000
Total Budgeted
Production 330000
Units sold in first sic
months 120000
5.1
Profit Statement for first 6 months using the absorption costing
system
Income Statement of first 6 months for Agent Limited
Document Page
Particulars Amount Amount
Sales (20000 units* 6 *R66) 7920000.00
Less: cost of goods sold
cost of goods available for sale 7500000.00
(25000*6*(24+10+16))
less: Closing inventory 1500000.00
(5000*6*(24+10+16) 6000000.00
Gross Profit 1920000.00
Less: Variable Selling and dist. Exp 0.00
(4*180000)
Contribution Margin 1920000.00
Less: Admin and Selling Exps.
Administrative 204545.45
Fixed Selling and Dist. 113636.36
Variable Selling and dist. Exp 600000.00 918181.82
Net Income 1001818.18
Manufacturing expenses per
unit:
Variable expenses + Fixed
expenses
16 per unit
5.3 Reconciliation
Variable Net Income 701818.18
Absorption Net income 1001818.18
Difference 300000.00
Change In inventory 30000
Per unit Fixed manufacturing O/H 10.0
Fixed manufacturing O/H (Total) 300000.00
chevron_up_icon
1 out of 10
circle_padding
hide_on_mobile
zoom_out_icon
[object Object]