Financial Statement Analysis Report for Kingston Wharves Limited
VerifiedAdded on 2023/02/01
|23
|3618
|82
Report
AI Summary
This report provides a comprehensive financial analysis of Kingston Wharves Limited, evaluating its financial performance and position over a two-year period. The analysis includes an assessment of the company's financial status, capital structure, and liquidity, revealing improvements in its financial position. The report examines the company's revenue growth, cost management, asset utilization, and profitability ratios, highlighting strong net and gross profit margins. Furthermore, it assesses the value created for shareholders by analyzing earnings per share and the valuation of the company's shares in the market. The report also covers the company's cash management, including the impact of operations on cash flow and other sources and uses of cash, providing a detailed overview of the company's financial health and performance.

Accounting Financial Analysis
Paraphrase This Document
Need a fresh take? Get an instant paraphrase of this document with our AI Paraphraser
Contents
Introduction................................................................................................................................3
Part 1..........................................................................................................................................4
Part 2..........................................................................................................................................6
1. An assessment of the financial status of the company including.......................................6
a. The company’s financial position as at the reporting date.............................................6
b. The capital structure of the company.............................................................................6
c. The liquidity of the company.........................................................................................8
2. An assessment of the financial performance of the company over the last 2 years
including...............................................................................................................................11
a. The company’s revenue growth...................................................................................11
b. The company’s management of its different category of cost and capital. The
company’s efficient use of its assets................................................................................12
3. An assessment of the value created by the company for its shareholders over the last two
years including.....................................................................................................................13
a. The earnings returned on each share............................................................................13
b. The earnings paid to shareholders on each share.........................................................13
c. The valuation of the company’s shares in the market..................................................14
4. An assessment of the company’s cash management including........................................16
a. The impact of the company’s operations on its cash flow...........................................16
b. The company’s other sources and uses of cash............................................................17
Part 3........................................................................................................................................18
Conclusion................................................................................................................................21
References................................................................................................................................22
Introduction
One of the most effective method of evaluating financial performance and financial position
of a company is with the help of financial statement analysis. Conclusions made with the help
of financial statement analysis are accurate and relevant as search conclusions are based on
accurate data provided in financial statements at the end of every year (Morden, 2016).
Financial statement analysis a can be very helpful in evaluating internal growth of a company
by comparing financial position of the company at the end of different financial year. Main
purpose of this report is to evaluate different financial aspects of Kingston Wharves Limited
which is the business organization operating in Jamaica. Primary financial aspects that will be
under consideration in this financial statement analysis report are profitability, liquidity,
efficiency and solvency. It is also provided that to shareholders of the company expects a
return of 10% from this business organization and this report will evaluate the whether
company has been able to achieve search expectation by analysing return on capital assets
(Hill, Jones & Schilling, 2014).
⊘ This is a preview!⊘
Do you want full access?
Subscribe today to unlock all pages.
Trusted by 1+ million students worldwide
Part 1
Long term security can be defined as the securities that cannot be converted into cash before
12 months of its issue date. Management of the company should make investment in this type
of security if liquidity position of the company is already strong and they want to earn extra
income on additional cash available with the company. This is due to the fact that interest
available on long-term securities is higher as compared to short term securities (Hoesli &
MacGregor, 2014). Following are some of the long term securities available in financial
market along with their advantages and disadvantages-
Investment in subsidiaries- Investment can be made by Business organizations in other
business organizations for long period of time. It is important that such securities should not
be categorised as "held for trading purposes". Such investments will be considered as a short
term securities if categorised as held for trading purposes. Primary advantage of such
investment is that it will help in merger and acquisition decision to be made in future.
Disadvantage of this method is that profitability on investment is totally dependent on
operational efficiency of subsidiaries and probability of loss in this type of investment are
very high.
Bonds
Bonds can be defined as fixed interest securities that are issued as debt component by
business organizations for other investors. Bonds are generally issued by government
organizations rather than business organizations. Primary advantage of investment in this
type of security is that there is no risk associated with investment and interest will be
provided at regular interval of time. Disadvantage of investment in this security is that returns
available are very low (Chandra, 2017). In addition to that there is a lock-in period before
which investors cannot realise their investment into cash.
Preference shares
This security can be defined as a combination of debt and equity component as it has
properties of both these type securities. Fixed rate of interest is available on preference shares
issued by Business organizations to their investors and certain rights are available to
preference shareholders that are similar to equity shareholders (DeFusco, McLeavey, Pinto,
Anson & Runkle, 2015). Advantage of investing in preference share is that interest available
Paraphrase This Document
Need a fresh take? Get an instant paraphrase of this document with our AI Paraphraser

on preference shares is higher as compared to bonds and risk free returns available in market.
In addition to that certain rights are also available to equity shareholders in the company by
which such securities are issued. Disadvantage of investing and preference share is that
principal amount will be received back by the investor after the term for which preference
share are issued will end (Szegö, 2014).
Part 2
1. An assessment of the financial status of the company including
a. The company’s financial position as at the reporting date
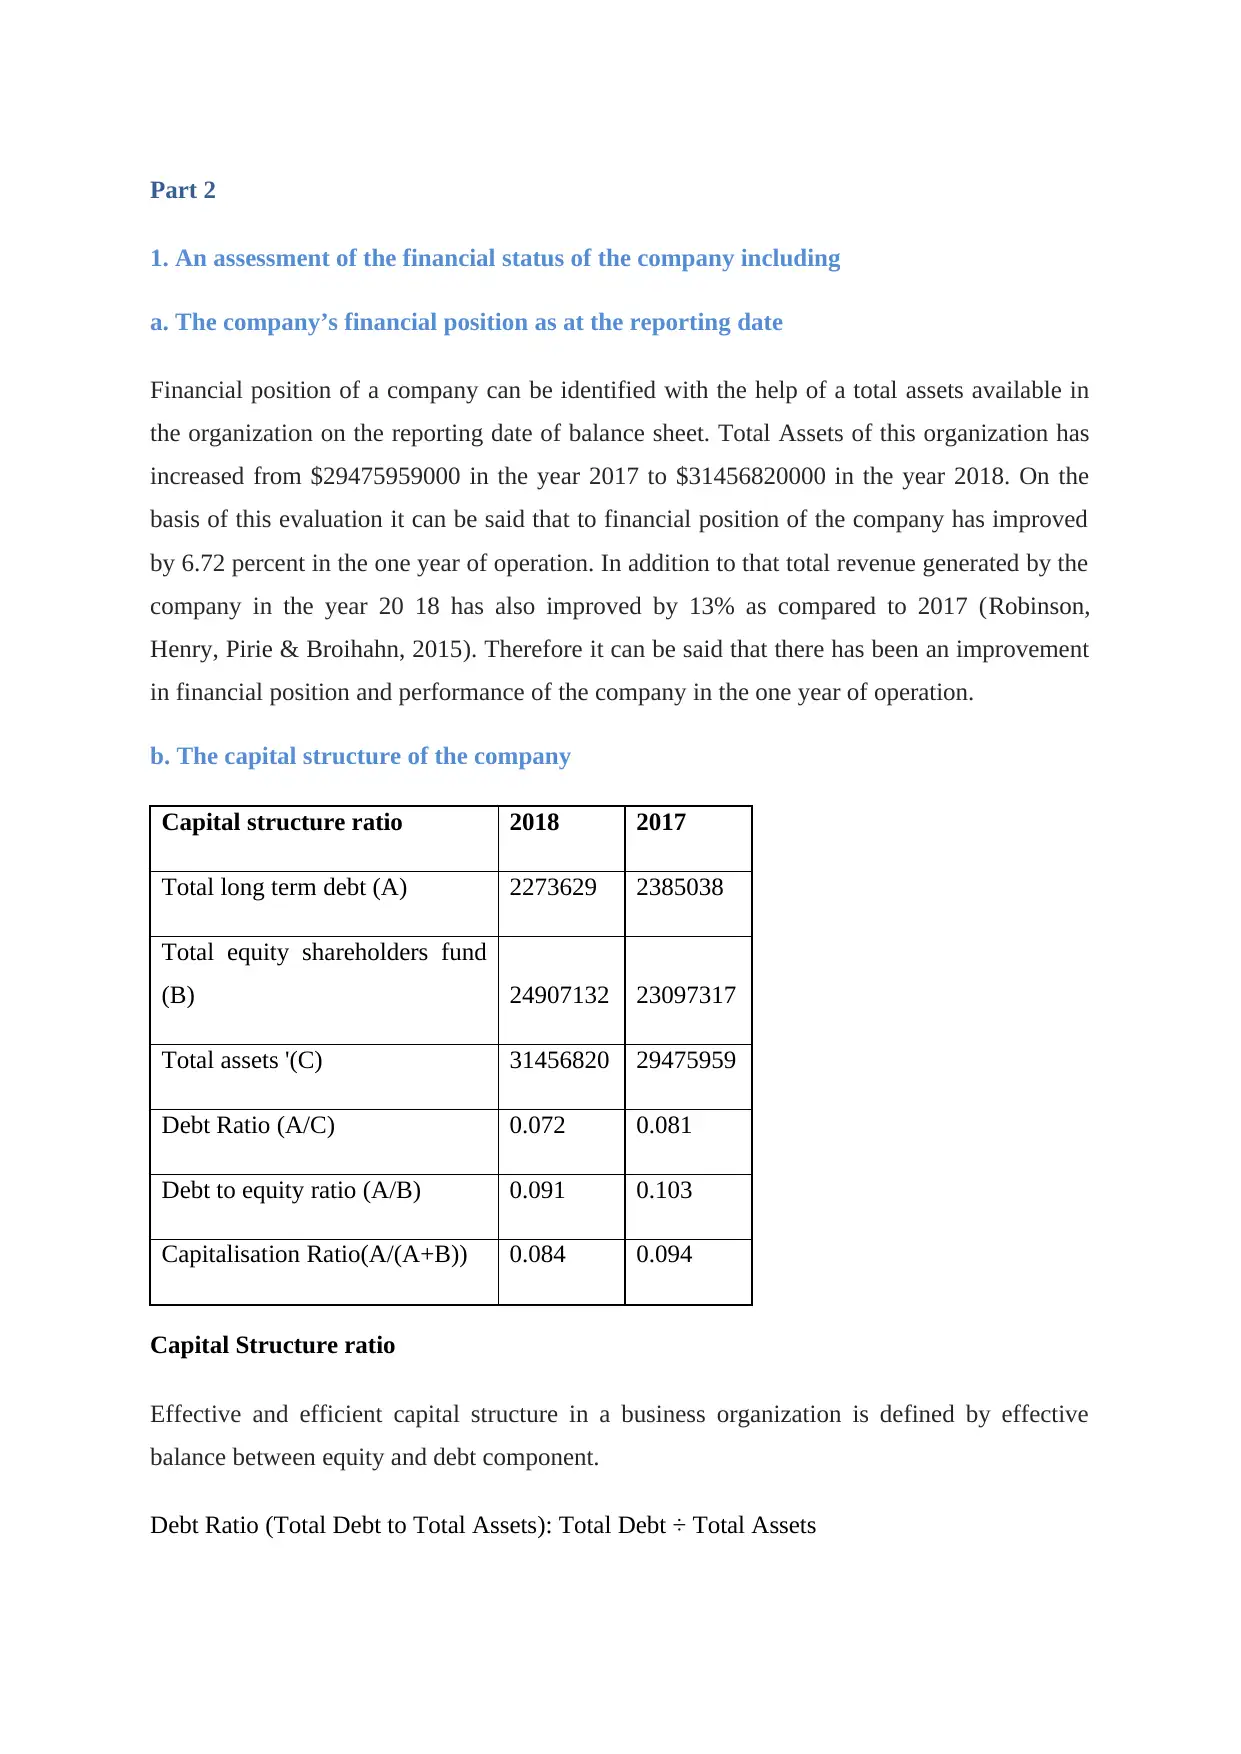
Financial position of a company can be identified with the help of a total assets available in
the organization on the reporting date of balance sheet. Total Assets of this organization has
increased from $29475959000 in the year 2017 to $31456820000 in the year 2018. On the
basis of this evaluation it can be said that to financial position of the company has improved
by 6.72 percent in the one year of operation. In addition to that total revenue generated by the
company in the year 20 18 has also improved by 13% as compared to 2017 (Robinson,
Henry, Pirie & Broihahn, 2015). Therefore it can be said that there has been an improvement
in financial position and performance of the company in the one year of operation.
b. The capital structure of the company
Capital structure ratio 2018 2017
Total long term debt (A) 2273629 2385038
Total equity shareholders fund
(B) 24907132 23097317
Total assets '(C) 31456820 29475959
Debt Ratio (A/C) 0.072 0.081
Debt to equity ratio (A/B) 0.091 0.103
Capitalisation Ratio(A/(A+B)) 0.084 0.094
Capital Structure ratio
Effective and efficient capital structure in a business organization is defined by effective
balance between equity and debt component.
Debt Ratio (Total Debt to Total Assets): Total Debt ÷ Total Assets
1. An assessment of the financial status of the company including
a. The company’s financial position as at the reporting date
Financial position of a company can be identified with the help of a total assets available in
the organization on the reporting date of balance sheet. Total Assets of this organization has
increased from $29475959000 in the year 2017 to $31456820000 in the year 2018. On the
basis of this evaluation it can be said that to financial position of the company has improved
by 6.72 percent in the one year of operation. In addition to that total revenue generated by the
company in the year 20 18 has also improved by 13% as compared to 2017 (Robinson,
Henry, Pirie & Broihahn, 2015). Therefore it can be said that there has been an improvement
in financial position and performance of the company in the one year of operation.
b. The capital structure of the company
Capital structure ratio 2018 2017
Total long term debt (A) 2273629 2385038
Total equity shareholders fund
(B) 24907132 23097317
Total assets '(C) 31456820 29475959
Debt Ratio (A/C) 0.072 0.081
Debt to equity ratio (A/B) 0.091 0.103
Capitalisation Ratio(A/(A+B)) 0.084 0.094
Capital Structure ratio
Effective and efficient capital structure in a business organization is defined by effective
balance between equity and debt component.
Debt Ratio (Total Debt to Total Assets): Total Debt ÷ Total Assets
⊘ This is a preview!⊘
Do you want full access?
Subscribe today to unlock all pages.
Trusted by 1+ million students worldwide
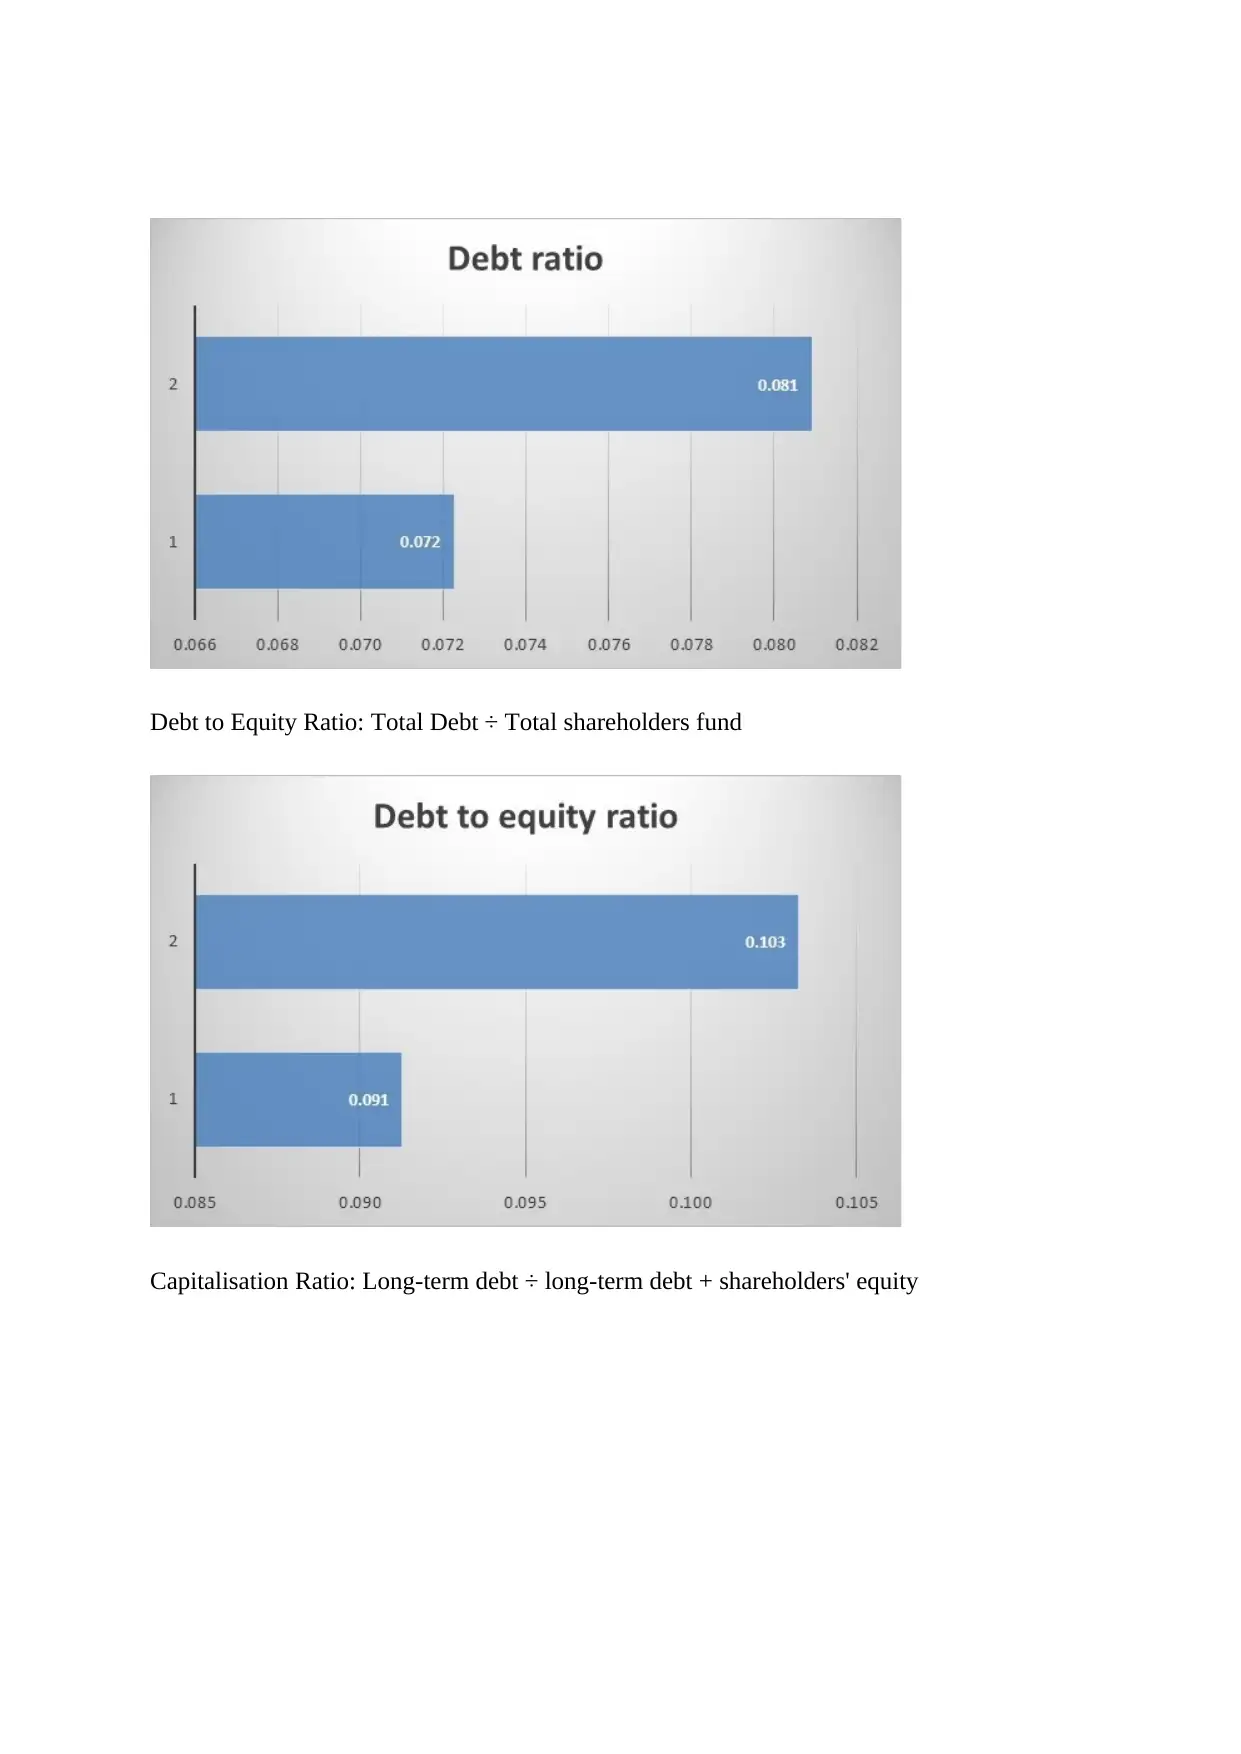
Debt to Equity Ratio: Total Debt ÷ Total shareholders fund
Capitalisation Ratio: Long-term debt ÷ long-term debt + shareholders' equity
Capitalisation Ratio: Long-term debt ÷ long-term debt + shareholders' equity
Paraphrase This Document
Need a fresh take? Get an instant paraphrase of this document with our AI Paraphraser
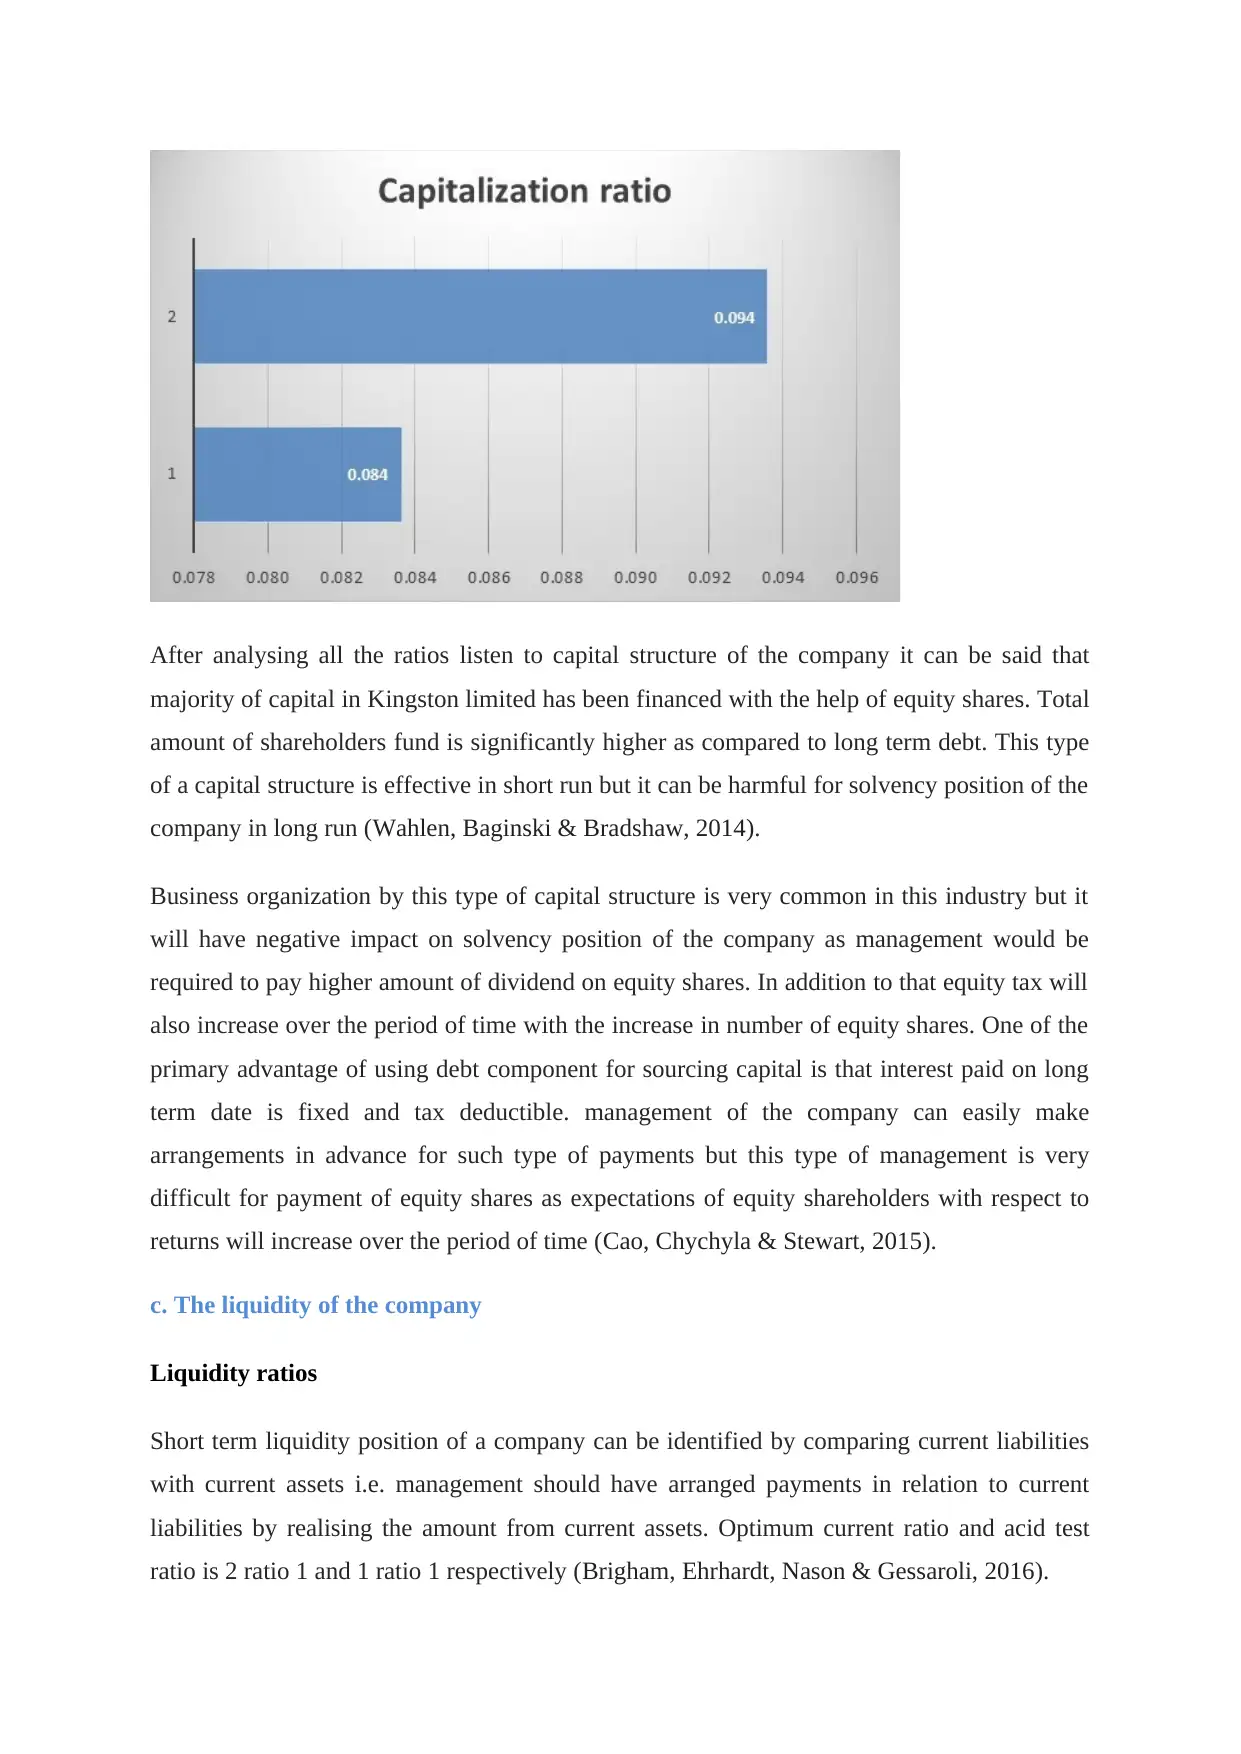
After analysing all the ratios listen to capital structure of the company it can be said that
majority of capital in Kingston limited has been financed with the help of equity shares. Total
amount of shareholders fund is significantly higher as compared to long term debt. This type
of a capital structure is effective in short run but it can be harmful for solvency position of the
company in long run (Wahlen, Baginski & Bradshaw, 2014).
Business organization by this type of capital structure is very common in this industry but it
will have negative impact on solvency position of the company as management would be
required to pay higher amount of dividend on equity shares. In addition to that equity tax will
also increase over the period of time with the increase in number of equity shares. One of the
primary advantage of using debt component for sourcing capital is that interest paid on long
term date is fixed and tax deductible. management of the company can easily make
arrangements in advance for such type of payments but this type of management is very
difficult for payment of equity shares as expectations of equity shareholders with respect to
returns will increase over the period of time (Cao, Chychyla & Stewart, 2015).
c. The liquidity of the company
Liquidity ratios
Short term liquidity position of a company can be identified by comparing current liabilities
with current assets i.e. management should have arranged payments in relation to current
liabilities by realising the amount from current assets. Optimum current ratio and acid test
ratio is 2 ratio 1 and 1 ratio 1 respectively (Brigham, Ehrhardt, Nason & Gessaroli, 2016).
Liquidity ratios 2018 2017
Current assets (A)
66017
17
51506
25
Inventory (B)
39200
6
34572
9
Prepaid expenses -(C) 0 0
Quick assets (A-B-C)=
D
62097
11
48048
96
Current liabilities -(E)
24502
00
22278
98
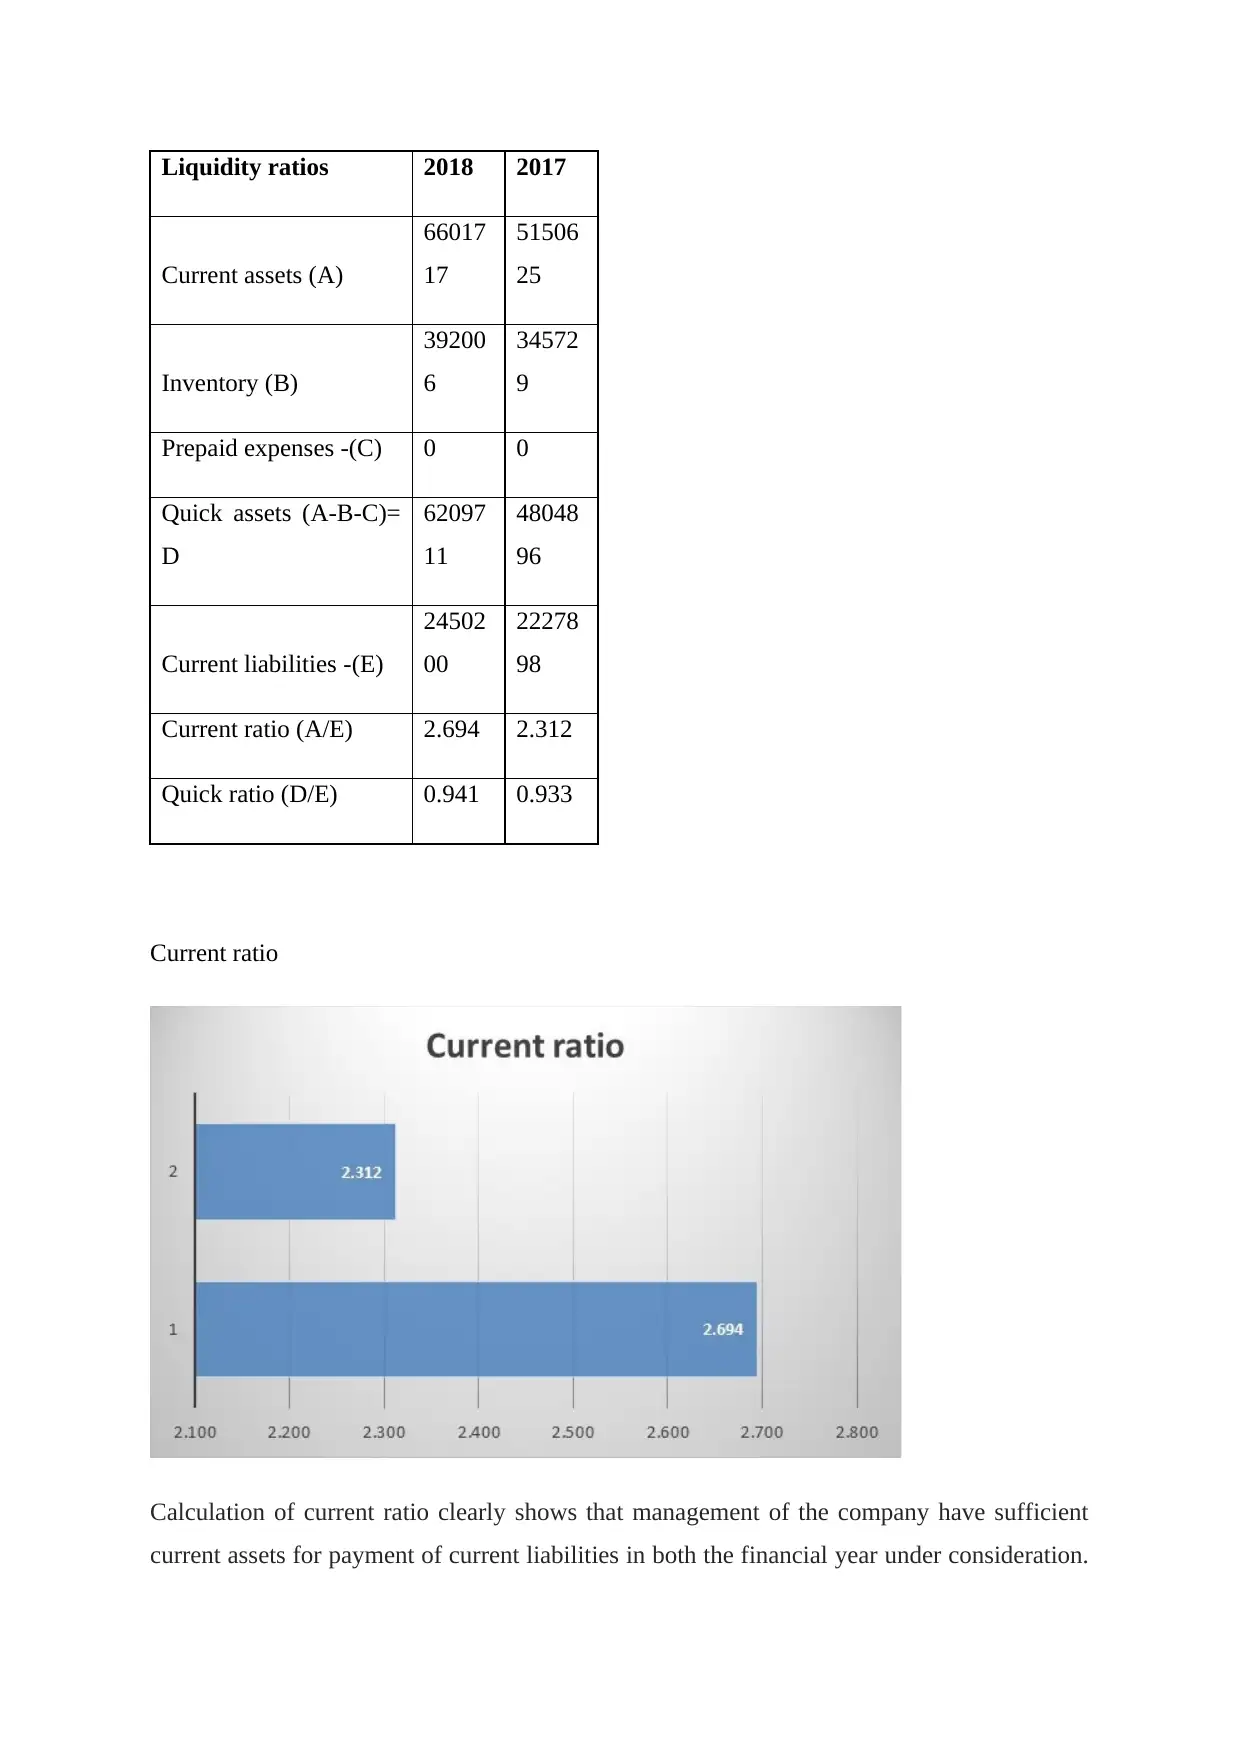
Current ratio (A/E) 2.694 2.312
Quick ratio (D/E) 0.941 0.933
Current ratio
Calculation of current ratio clearly shows that management of the company have sufficient
current assets for payment of current liabilities in both the financial year under consideration.
Current assets (A)
66017
17
51506
25
Inventory (B)
39200
6
34572
9
Prepaid expenses -(C) 0 0
Quick assets (A-B-C)=
D
62097
11
48048
96
Current liabilities -(E)
24502
00
22278
98
Current ratio (A/E) 2.694 2.312
Quick ratio (D/E) 0.941 0.933
Current ratio
Calculation of current ratio clearly shows that management of the company have sufficient
current assets for payment of current liabilities in both the financial year under consideration.
⊘ This is a preview!⊘
Do you want full access?
Subscribe today to unlock all pages.
Trusted by 1+ million students worldwide
Current ratio of Kingston Limited in the year 2018 and 2017 is 2.694 and 2.312 respectively
(Palepu, Healy& Peek, 2013). It clearly shows that the current ratio of this organization is in
accordance with the optimum ratio and liquidity position of the company is very strong.
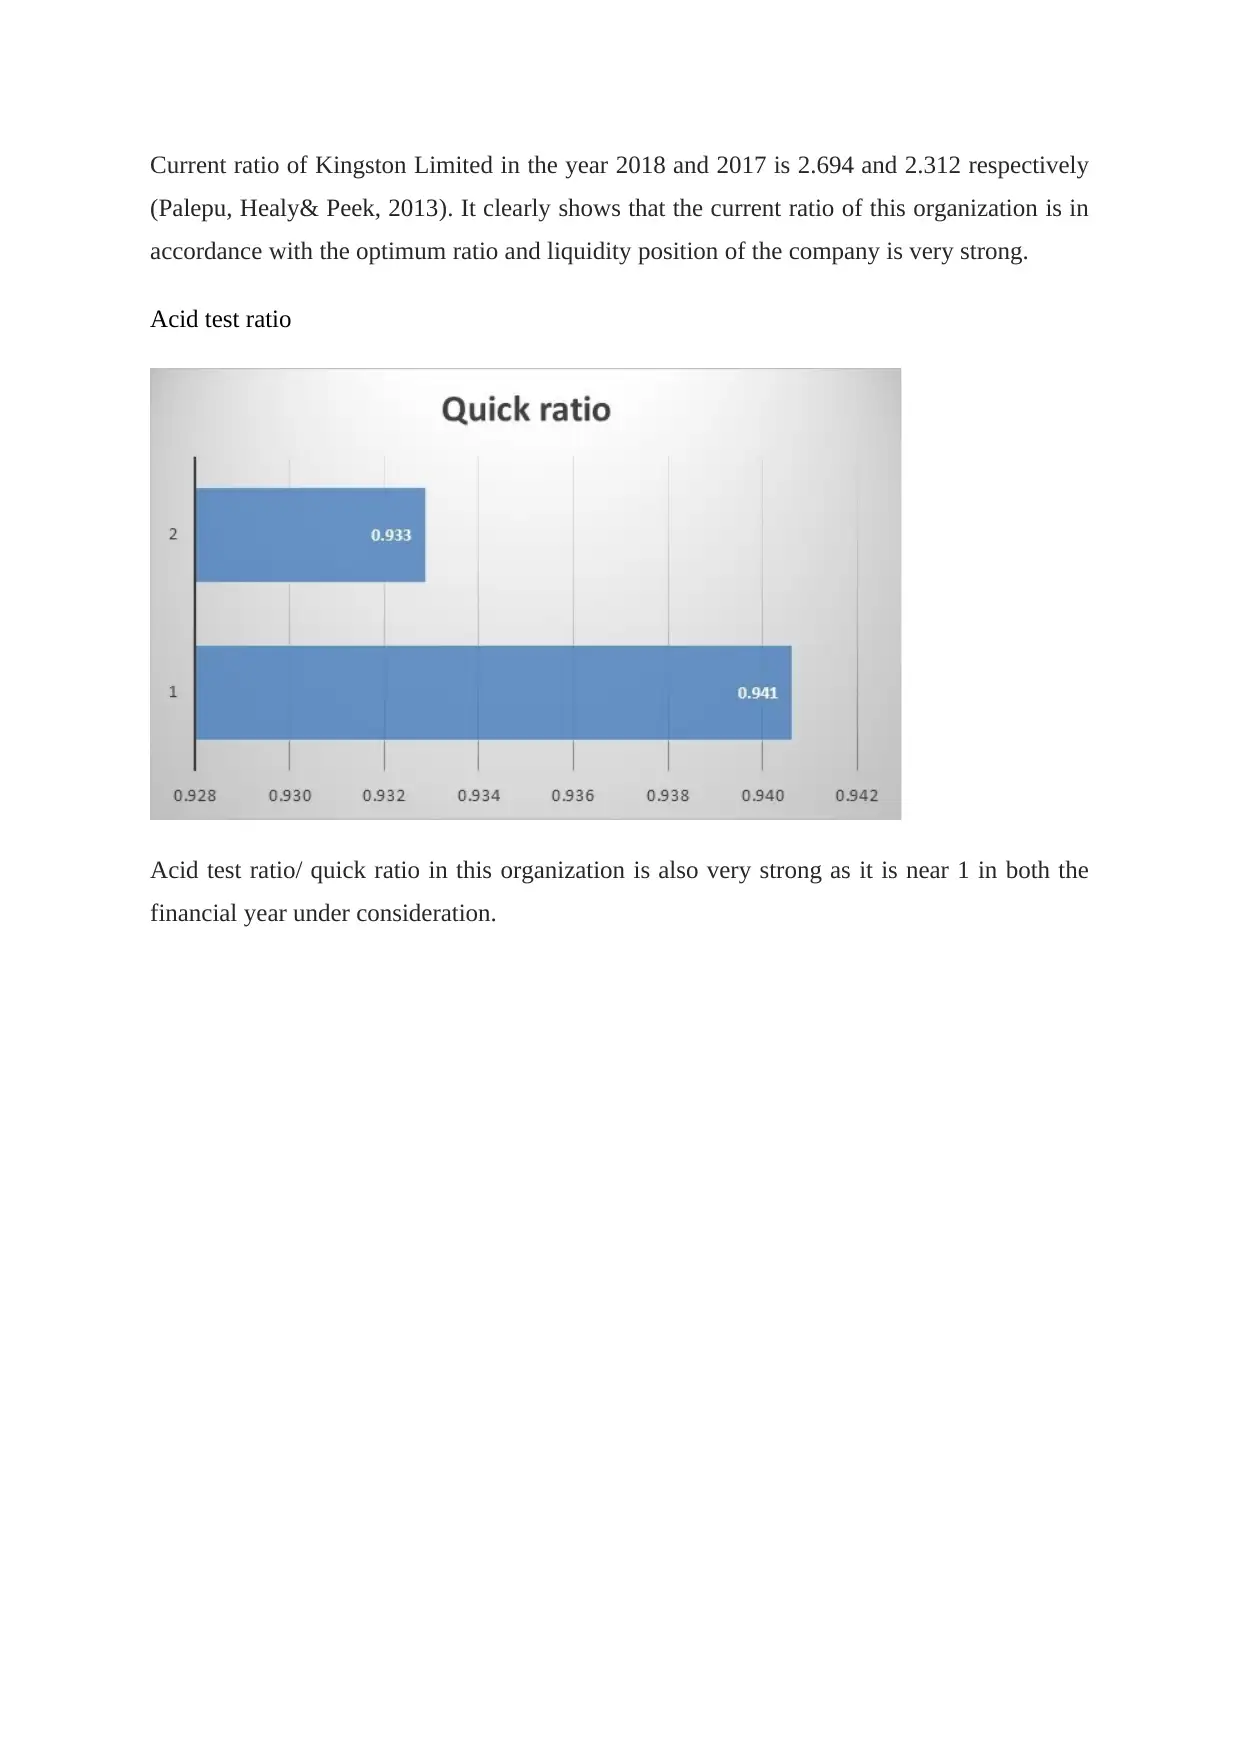
Acid test ratio
Acid test ratio/ quick ratio in this organization is also very strong as it is near 1 in both the
financial year under consideration.
(Palepu, Healy& Peek, 2013). It clearly shows that the current ratio of this organization is in
accordance with the optimum ratio and liquidity position of the company is very strong.
Acid test ratio
Acid test ratio/ quick ratio in this organization is also very strong as it is near 1 in both the
financial year under consideration.
Paraphrase This Document
Need a fresh take? Get an instant paraphrase of this document with our AI Paraphraser
2. An assessment of the financial performance of the company over the last 2 years
including
a. The company’s revenue growth
Profitability Ratios
In the process of investment decision making, profit is the first performance indicator that is
evaluated by investors.
Profitability
Ratios 2018 2017
Net profit (A)
197116
3
164749
6
Gross profit (B)
350049
1
305871
7
Total revenue ©
725357
1
636923
8
Net profit ratio
(A/C) 27.18 25.87
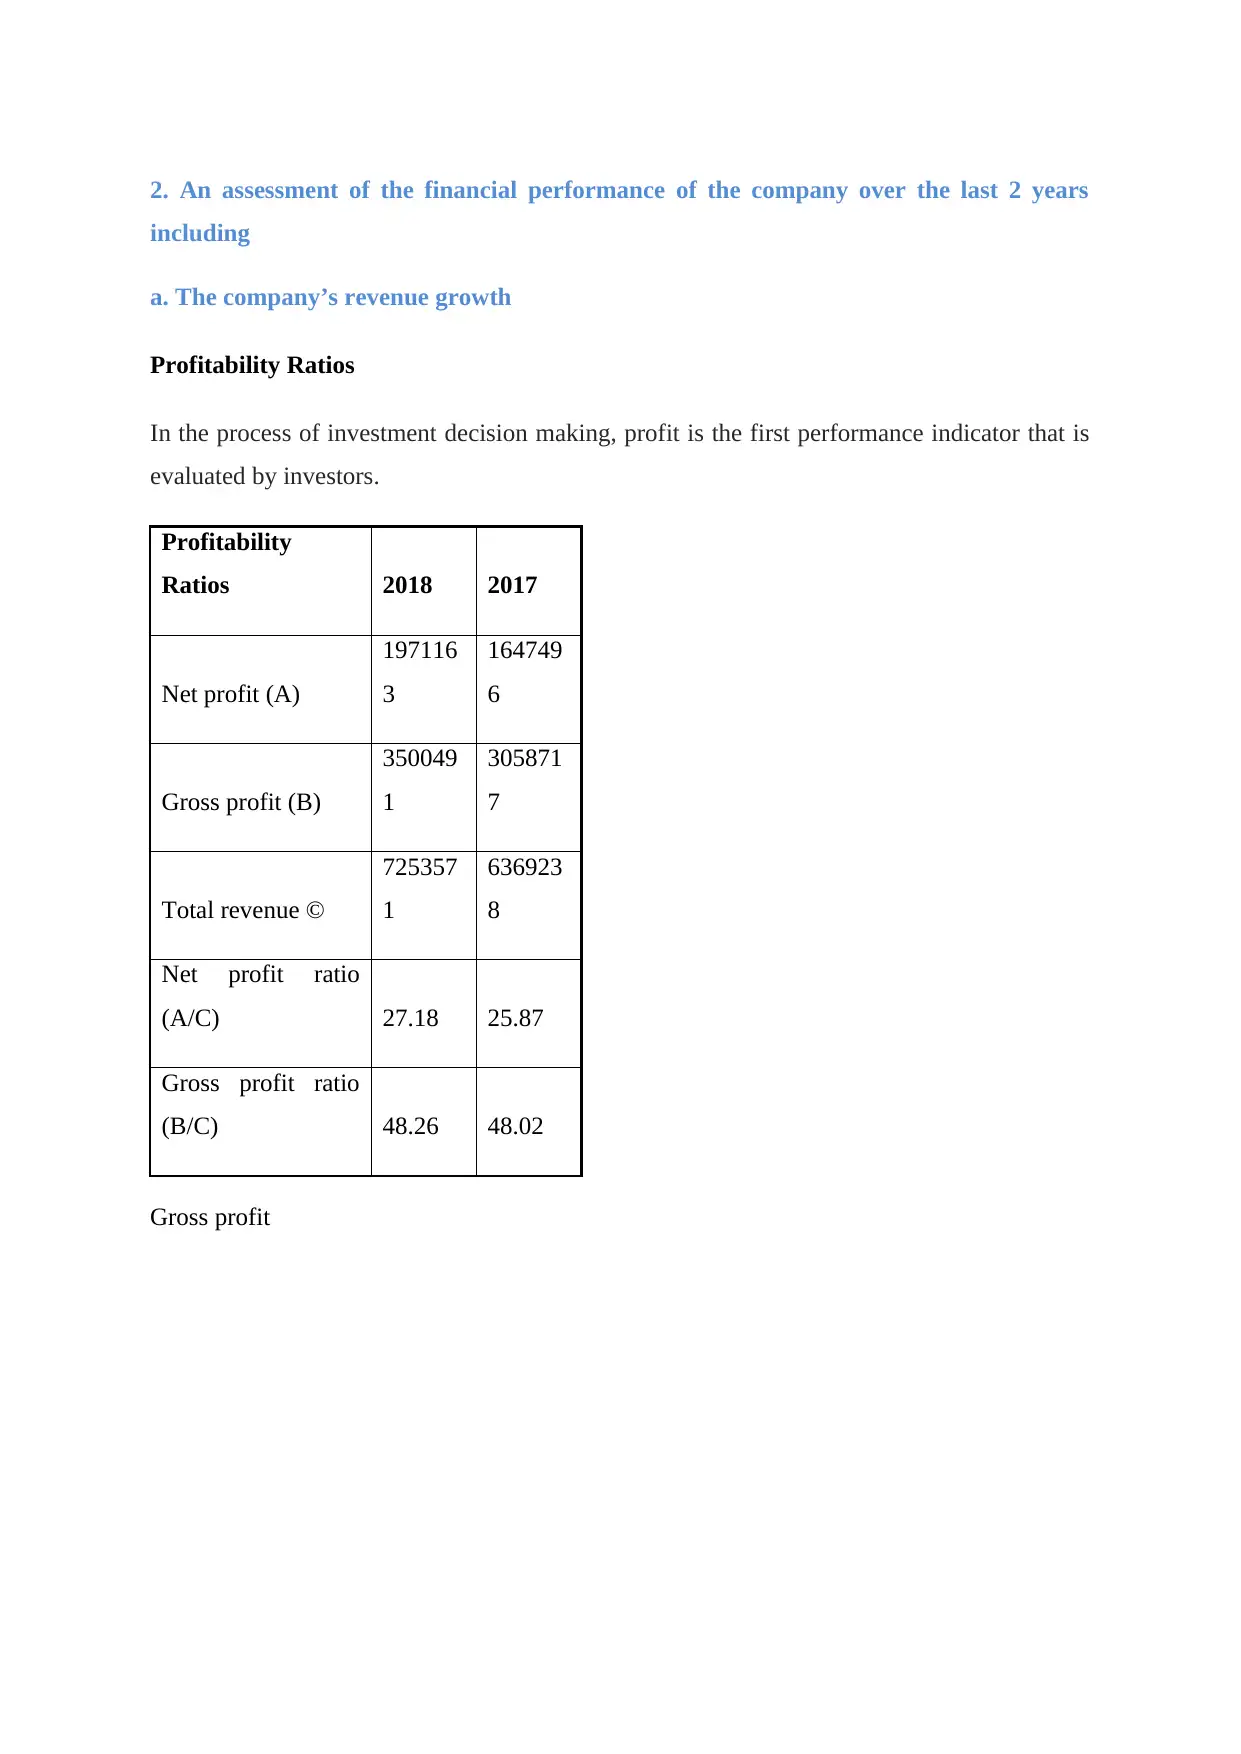
Gross profit ratio
(B/C) 48.26 48.02
Gross profit
including
a. The company’s revenue growth
Profitability Ratios
In the process of investment decision making, profit is the first performance indicator that is
evaluated by investors.
Profitability
Ratios 2018 2017
Net profit (A)
197116
3
164749
6
Gross profit (B)
350049
1
305871
7
Total revenue ©
725357
1
636923
8
Net profit ratio
(A/C) 27.18 25.87
Gross profit ratio
(B/C) 48.26 48.02
Gross profit
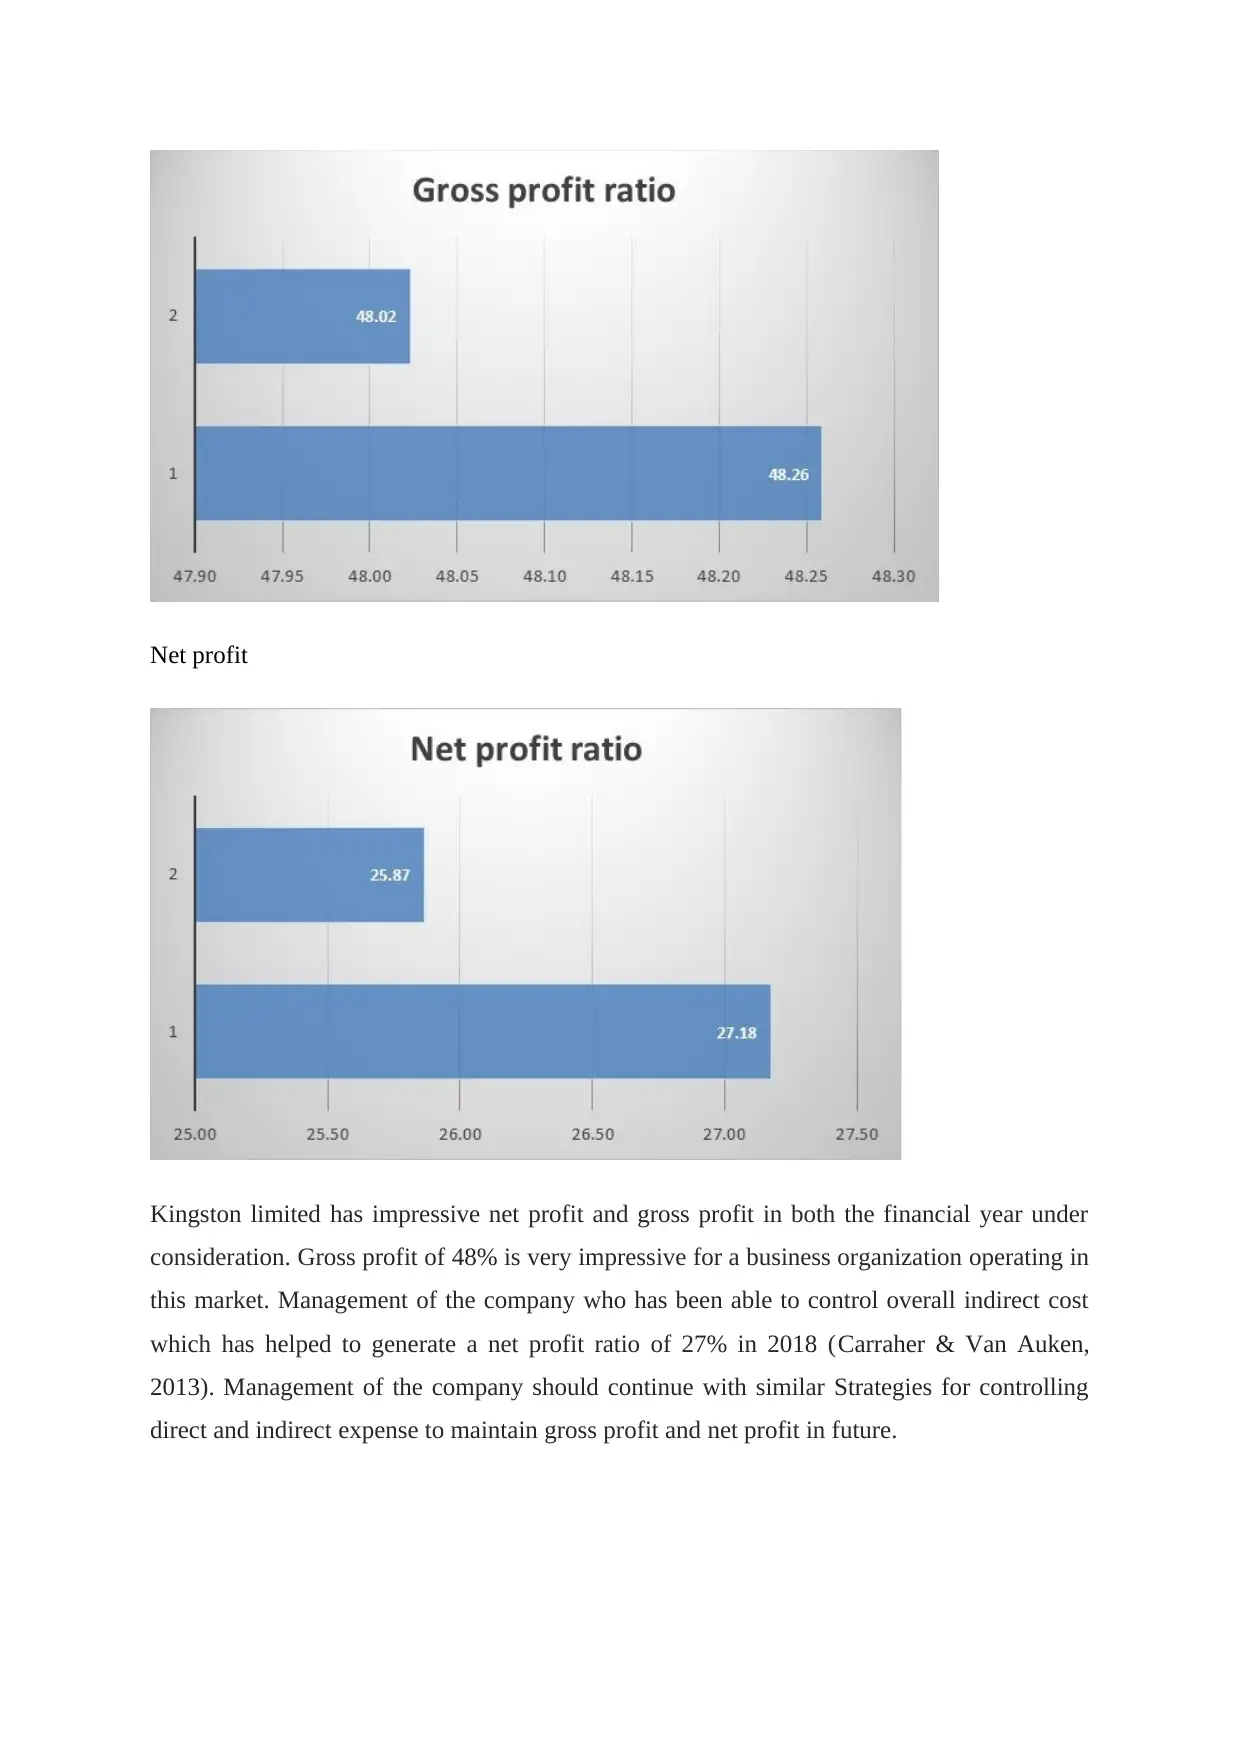
Net profit
Kingston limited has impressive net profit and gross profit in both the financial year under
consideration. Gross profit of 48% is very impressive for a business organization operating in
this market. Management of the company who has been able to control overall indirect cost
which has helped to generate a net profit ratio of 27% in 2018 (Carraher & Van Auken,
2013). Management of the company should continue with similar Strategies for controlling
direct and indirect expense to maintain gross profit and net profit in future.
⊘ This is a preview!⊘
Do you want full access?
Subscribe today to unlock all pages.
Trusted by 1+ million students worldwide
1 out of 23
Related Documents


Your All-in-One AI-Powered Toolkit for Academic Success.
+13062052269
info@desklib.com
Available 24*7 on WhatsApp / Email
![[object Object]](/_next/static/media/star-bottom.7253800d.svg)
Unlock your academic potential
Copyright © 2020–2026 A2Z Services. All Rights Reserved. Developed and managed by ZUCOL.