Financial Management Assignment: Financial Statement Analysis
VerifiedAdded on 2023/01/18
|21
|4470
|34
Homework Assignment
AI Summary
This financial management assignment provides a comprehensive analysis of key financial concepts. It begins with an introduction defining financial management and its importance for businesses, followed by an in-depth exploration of tax liabilities, including calculations and explanations of their significance. The assignment delves into risk and return analysis, including expected return calculations and standard deviation, and discusses the relationship between risk and time in investments. It also covers different types of risks and the importance of diversification. The assignment then presents a detailed income statement and balance sheet, along with an explanation of the finance department's role in achieving business objectives, including cash flow management, budgeting, investment management, and tax management. Furthermore, it includes a liquidity analysis of McDonald's, assessing its current and quick ratios, collection periods, and turnover ratios compared to industry averages. The assignment concludes by evaluating management's ability to generate operating profits, assessing debt ratios, and analyzing asset financing strategies, providing a holistic view of financial management principles.

FINANCIAL
MANAGEMENT
MANAGEMENT
Paraphrase This Document
Need a fresh take? Get an instant paraphrase of this document with our AI Paraphraser
Table of Contents
INTRODUCTION...........................................................................................................................3
MAIN BODY...................................................................................................................................3
Question 1....................................................................................................................................3
Question 2 ...................................................................................................................................4
Question 3 ...................................................................................................................................6
Question 4 ...................................................................................................................................8
Question 5 .................................................................................................................................13
Question 6 .................................................................................................................................14
Question 7 .................................................................................................................................17
CONCLUSION..............................................................................................................................18
REFERENCES..............................................................................................................................19
INTRODUCTION
The term financial management can be defined as a systematic process of planning,
organising and controlling the monetary activities in an effective manner (Finkler, Smith and
Calabrese, 2018). This management of financial aspects is essential for companies in order to
make better utilisation of resources. The aim of project report is to demonstrate understanding
about different terms of finance. The project report covers about tax liabilities, risk & return,
preparation of financial statements. The further part of project report concludes about different
kinds of ratios and financial planning. In the end part of report, role of capital-budgeting
technique for choosing projects is covered.
MAIN BODY
Question 1.
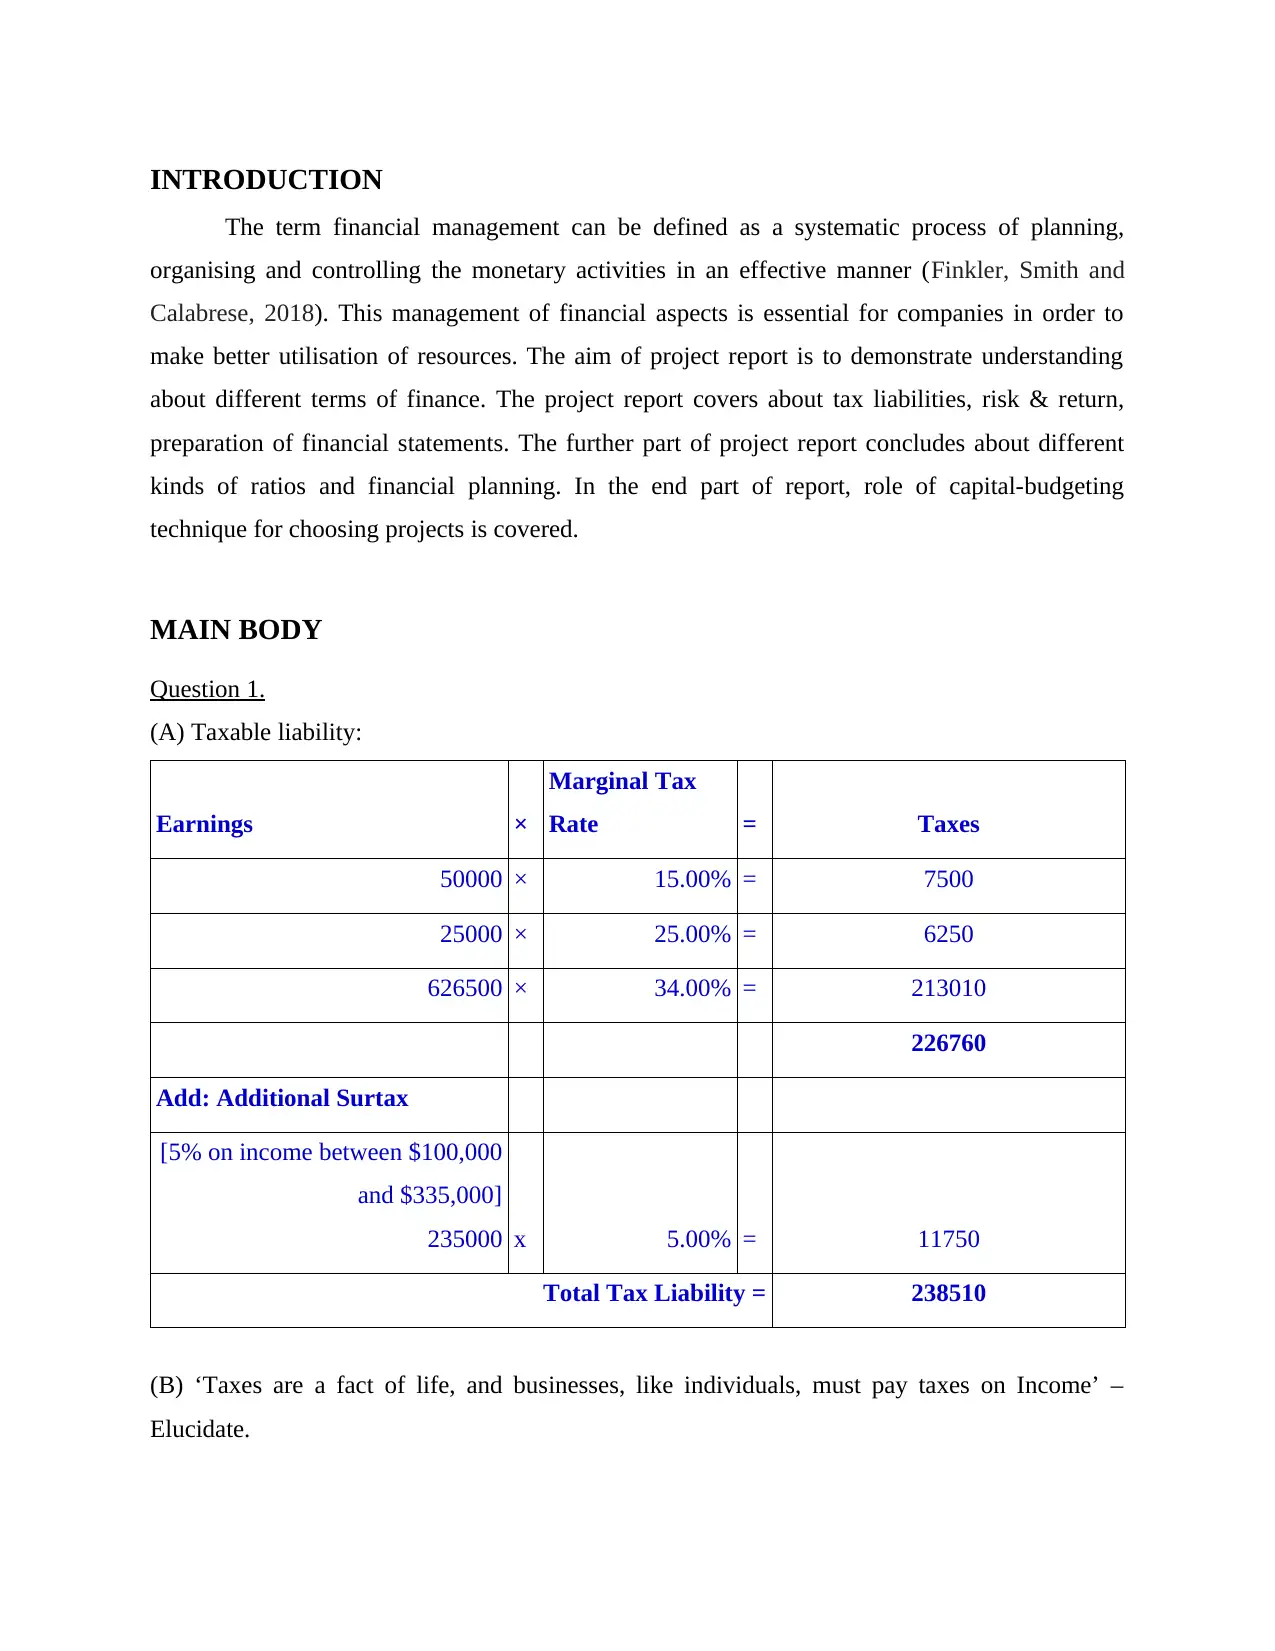
(A) Taxable liability:
Earnings ×
Marginal Tax
Rate = Taxes
50000 × 15.00% = 7500
25000 × 25.00% = 6250
626500 × 34.00% = 213010
226760
Add: Additional Surtax
[5% on income between $100,000
and $335,000]
235000 x 5.00% = 11750
Total Tax Liability = 238510
(B) ‘Taxes are a fact of life, and businesses, like individuals, must pay taxes on Income’ –
Elucidate.
The term financial management can be defined as a systematic process of planning,
organising and controlling the monetary activities in an effective manner (Finkler, Smith and
Calabrese, 2018). This management of financial aspects is essential for companies in order to
make better utilisation of resources. The aim of project report is to demonstrate understanding
about different terms of finance. The project report covers about tax liabilities, risk & return,
preparation of financial statements. The further part of project report concludes about different
kinds of ratios and financial planning. In the end part of report, role of capital-budgeting
technique for choosing projects is covered.
MAIN BODY
Question 1.
(A) Taxable liability:
Earnings ×
Marginal Tax
Rate = Taxes
50000 × 15.00% = 7500
25000 × 25.00% = 6250
626500 × 34.00% = 213010
226760
Add: Additional Surtax
[5% on income between $100,000
and $335,000]
235000 x 5.00% = 11750
Total Tax Liability = 238510
(B) ‘Taxes are a fact of life, and businesses, like individuals, must pay taxes on Income’ –
Elucidate.
⊘ This is a preview!⊘
Do you want full access?
Subscribe today to unlock all pages.
Trusted by 1+ million students worldwide
The taxes play a crucial role in aspect of development of a nation. It is so because if a
country's total taxable income is lower then this can be difficult to develop various aspects of
environment due to lack of funds (Horton and Farnham, 2015). On the other hand, if in a nation
taxable income is higher then there will be more chances of development. Thus, it is important
for businesses and individuals to pay tax on time on generated amount of expenditures.
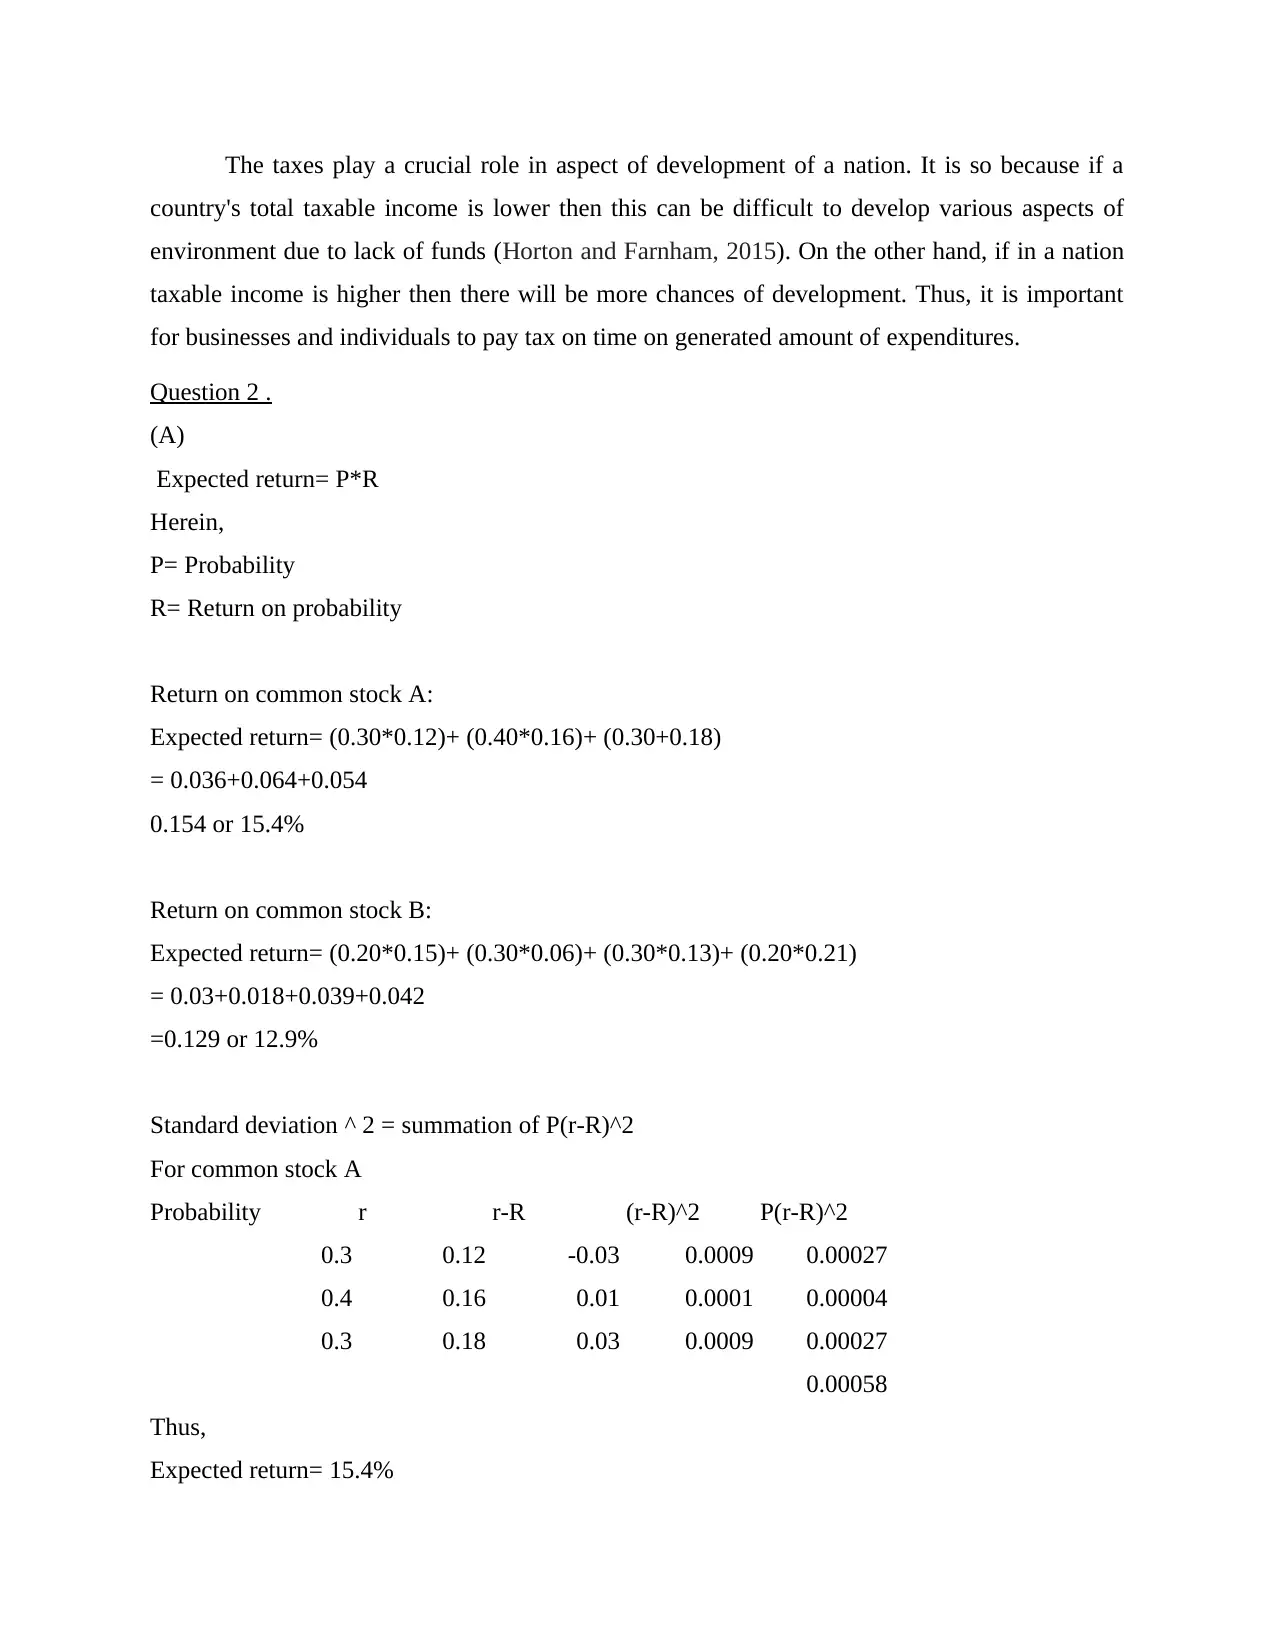
Question 2 .
(A)
Expected return= P*R
Herein,
P= Probability
R= Return on probability
Return on common stock A:
Expected return= (0.30*0.12)+ (0.40*0.16)+ (0.30+0.18)
= 0.036+0.064+0.054
0.154 or 15.4%
Return on common stock B:
Expected return= (0.20*0.15)+ (0.30*0.06)+ (0.30*0.13)+ (0.20*0.21)
= 0.03+0.018+0.039+0.042
=0.129 or 12.9%
Standard deviation ^ 2 = summation of P(r-R)^2
For common stock A
Probability r r-R (r-R)^2 P(r-R)^2
0.3 0.12 -0.03 0.0009 0.00027
0.4 0.16 0.01 0.0001 0.00004
0.3 0.18 0.03 0.0009 0.00027
0.00058
Thus,
Expected return= 15.4%
country's total taxable income is lower then this can be difficult to develop various aspects of
environment due to lack of funds (Horton and Farnham, 2015). On the other hand, if in a nation
taxable income is higher then there will be more chances of development. Thus, it is important
for businesses and individuals to pay tax on time on generated amount of expenditures.
Question 2 .
(A)
Expected return= P*R
Herein,
P= Probability
R= Return on probability
Return on common stock A:
Expected return= (0.30*0.12)+ (0.40*0.16)+ (0.30+0.18)
= 0.036+0.064+0.054
0.154 or 15.4%
Return on common stock B:
Expected return= (0.20*0.15)+ (0.30*0.06)+ (0.30*0.13)+ (0.20*0.21)
= 0.03+0.018+0.039+0.042
=0.129 or 12.9%
Standard deviation ^ 2 = summation of P(r-R)^2
For common stock A
Probability r r-R (r-R)^2 P(r-R)^2
0.3 0.12 -0.03 0.0009 0.00027
0.4 0.16 0.01 0.0001 0.00004
0.3 0.18 0.03 0.0009 0.00027
0.00058
Thus,
Expected return= 15.4%
Paraphrase This Document
Need a fresh take? Get an instant paraphrase of this document with our AI Paraphraser
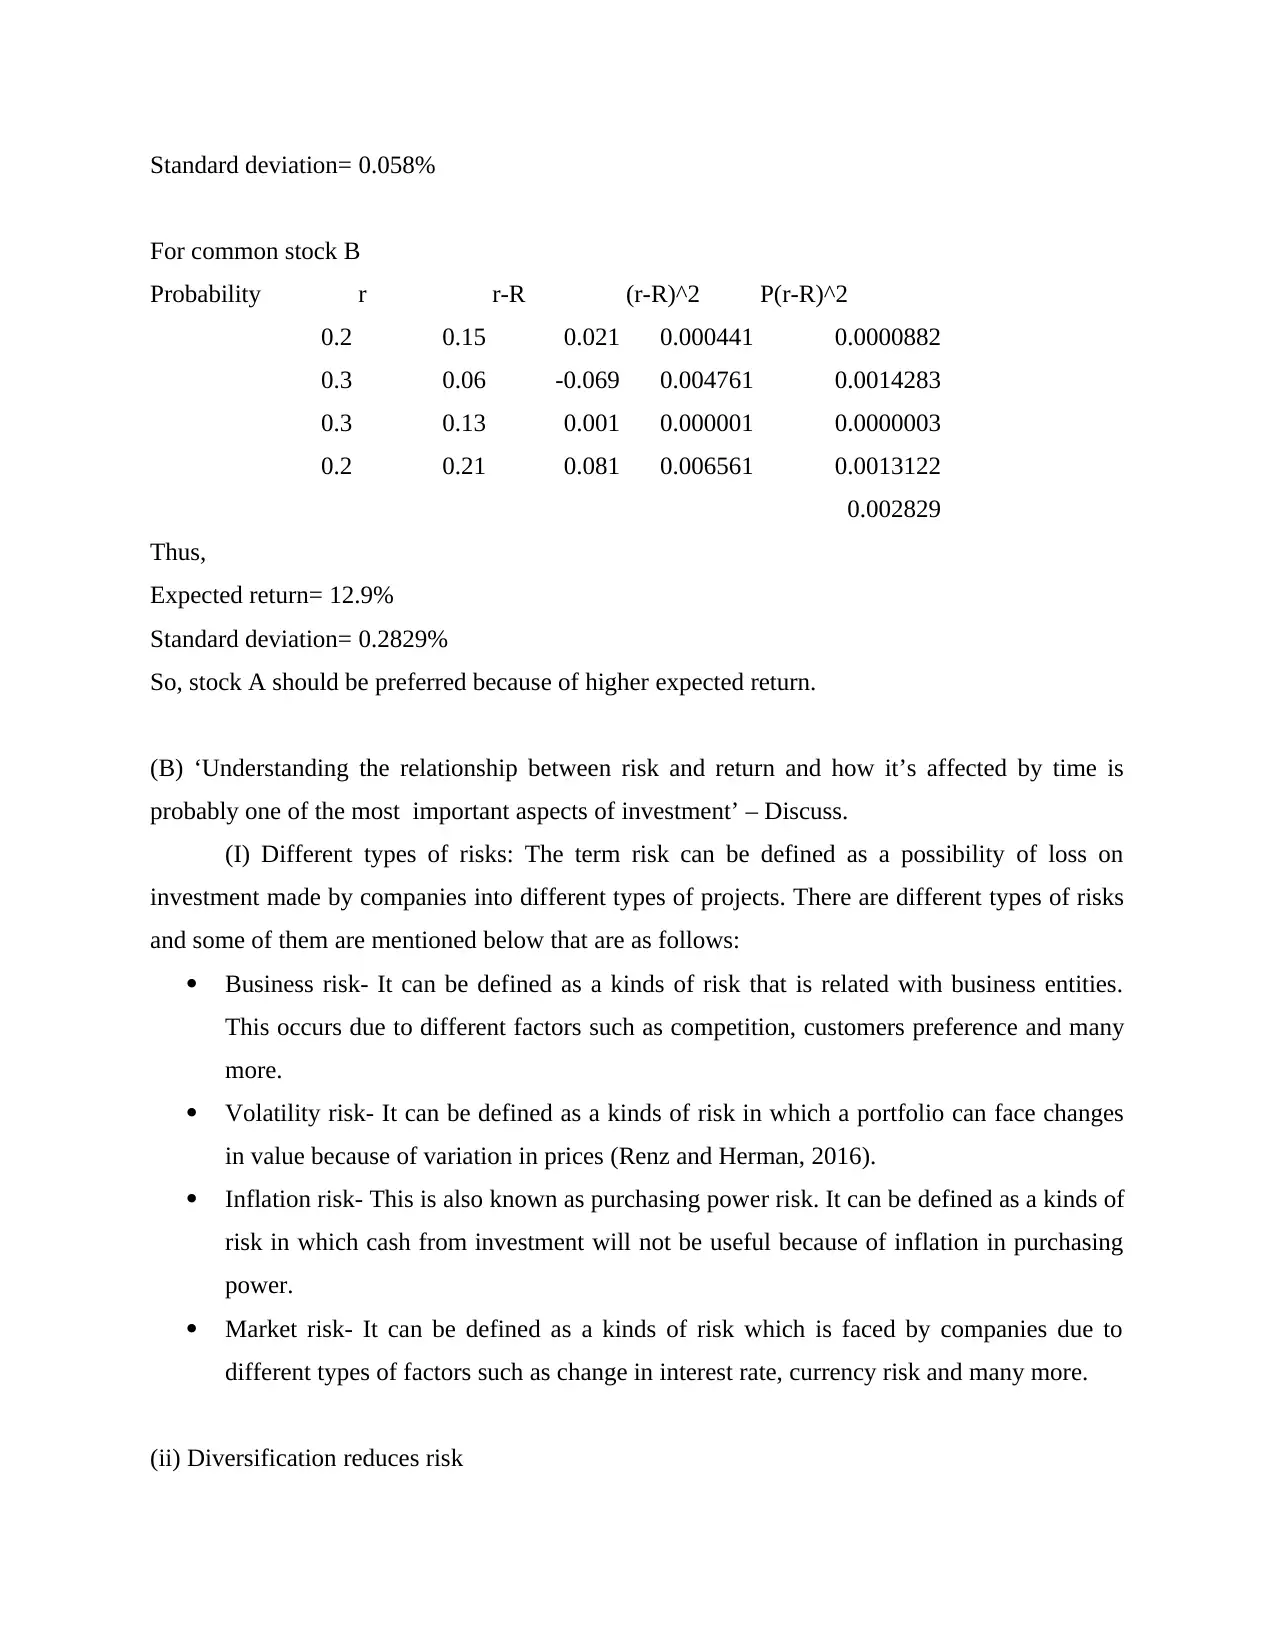
Standard deviation= 0.058%
For common stock B
Probability r r-R (r-R)^2 P(r-R)^2
0.2 0.15 0.021 0.000441 0.0000882
0.3 0.06 -0.069 0.004761 0.0014283
0.3 0.13 0.001 0.000001 0.0000003
0.2 0.21 0.081 0.006561 0.0013122
0.002829
Thus,
Expected return= 12.9%
Standard deviation= 0.2829%
So, stock A should be preferred because of higher expected return.
(B) ‘Understanding the relationship between risk and return and how it’s affected by time is
probably one of the most important aspects of investment’ – Discuss.
(I) Different types of risks: The term risk can be defined as a possibility of loss on
investment made by companies into different types of projects. There are different types of risks
and some of them are mentioned below that are as follows:
Business risk- It can be defined as a kinds of risk that is related with business entities.
This occurs due to different factors such as competition, customers preference and many
more.
Volatility risk- It can be defined as a kinds of risk in which a portfolio can face changes
in value because of variation in prices (Renz and Herman, 2016).
Inflation risk- This is also known as purchasing power risk. It can be defined as a kinds of
risk in which cash from investment will not be useful because of inflation in purchasing
power.
Market risk- It can be defined as a kinds of risk which is faced by companies due to
different types of factors such as change in interest rate, currency risk and many more.
(ii) Diversification reduces risk
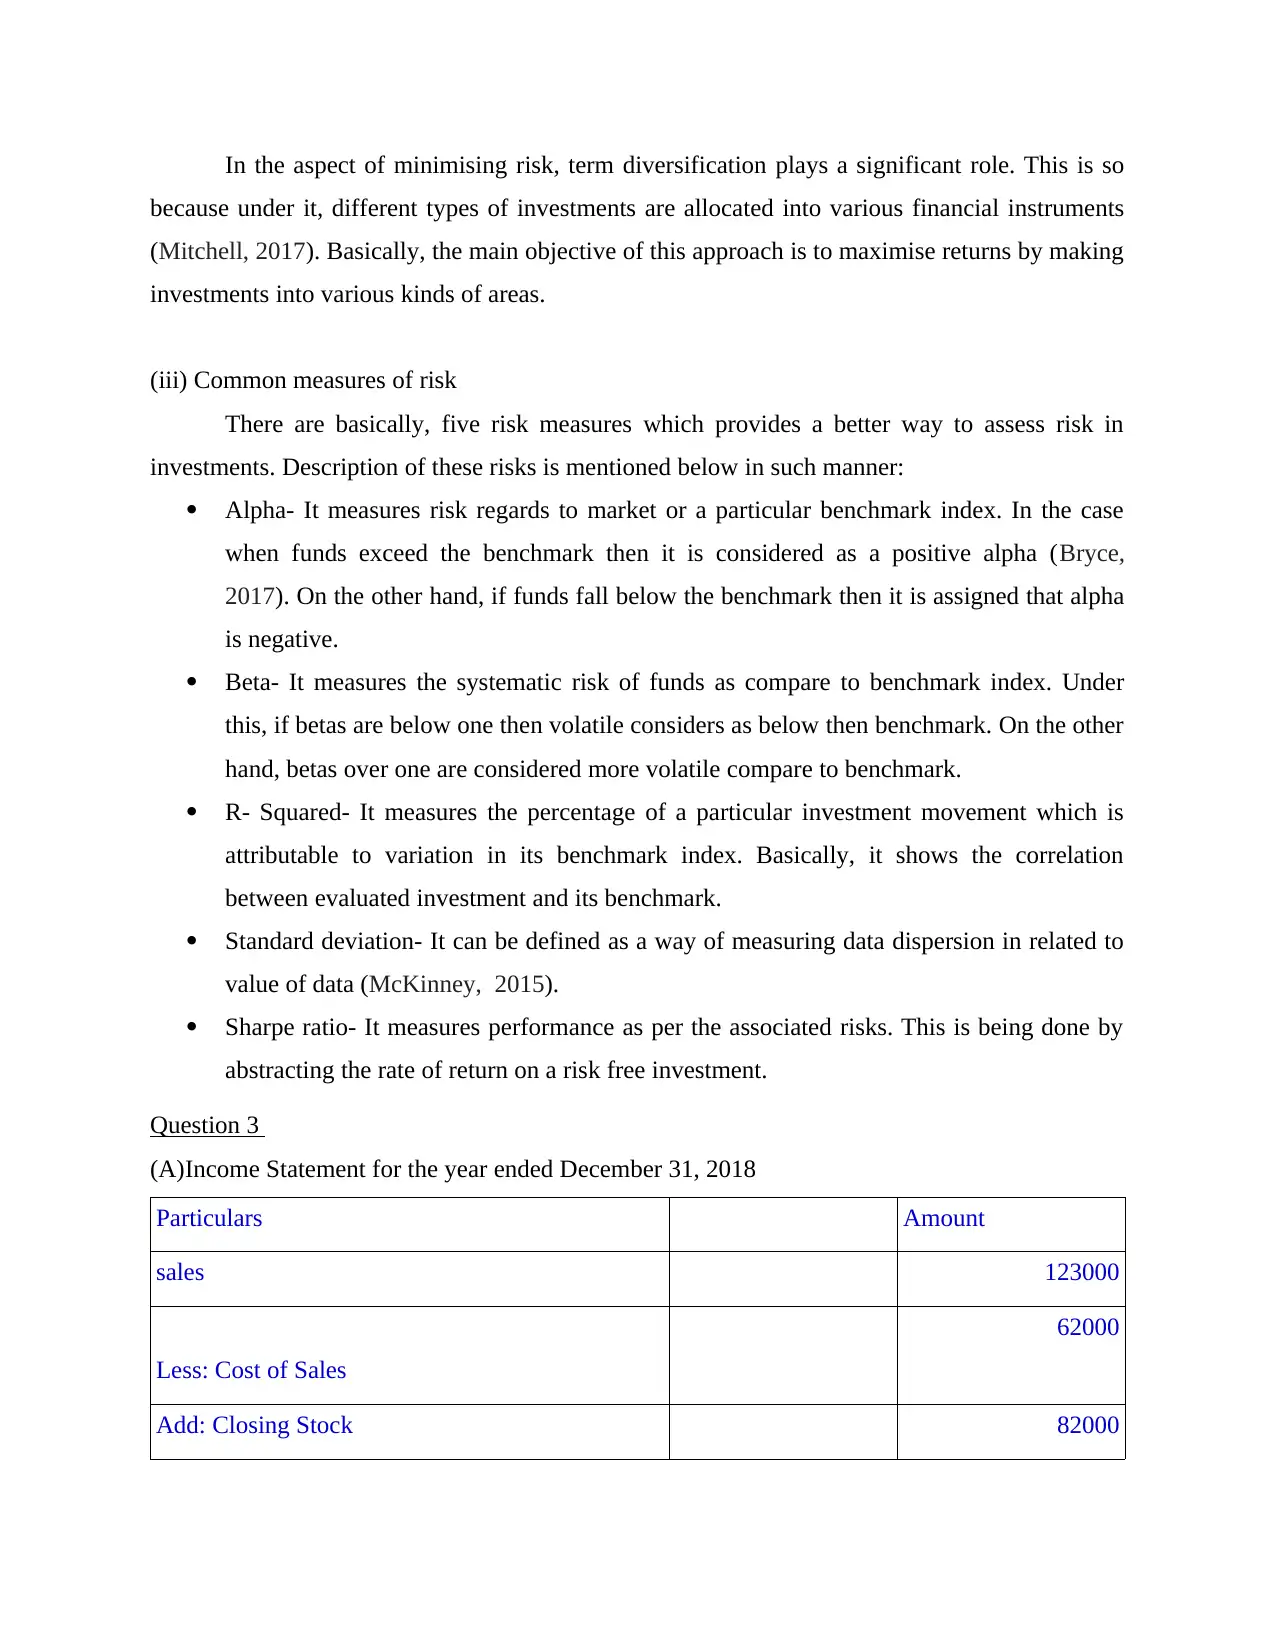
In the aspect of minimising risk, term diversification plays a significant role. This is so
because under it, different types of investments are allocated into various financial instruments
(Mitchell, 2017). Basically, the main objective of this approach is to maximise returns by making
investments into various kinds of areas.
(iii) Common measures of risk
There are basically, five risk measures which provides a better way to assess risk in
investments. Description of these risks is mentioned below in such manner:
Alpha- It measures risk regards to market or a particular benchmark index. In the case
when funds exceed the benchmark then it is considered as a positive alpha (Bryce,
2017). On the other hand, if funds fall below the benchmark then it is assigned that alpha
is negative.
Beta- It measures the systematic risk of funds as compare to benchmark index. Under
this, if betas are below one then volatile considers as below then benchmark. On the other
hand, betas over one are considered more volatile compare to benchmark.
R- Squared- It measures the percentage of a particular investment movement which is
attributable to variation in its benchmark index. Basically, it shows the correlation
between evaluated investment and its benchmark.
Standard deviation- It can be defined as a way of measuring data dispersion in related to
value of data (McKinney, 2015).
Sharpe ratio- It measures performance as per the associated risks. This is being done by
abstracting the rate of return on a risk free investment.
Question 3
(A)Income Statement for the year ended December 31, 2018
Particulars Amount
sales 123000
Less: Cost of Sales
62000
Add: Closing Stock 82000
⊘ This is a preview!⊘
Do you want full access?
Subscribe today to unlock all pages.
Trusted by 1+ million students worldwide
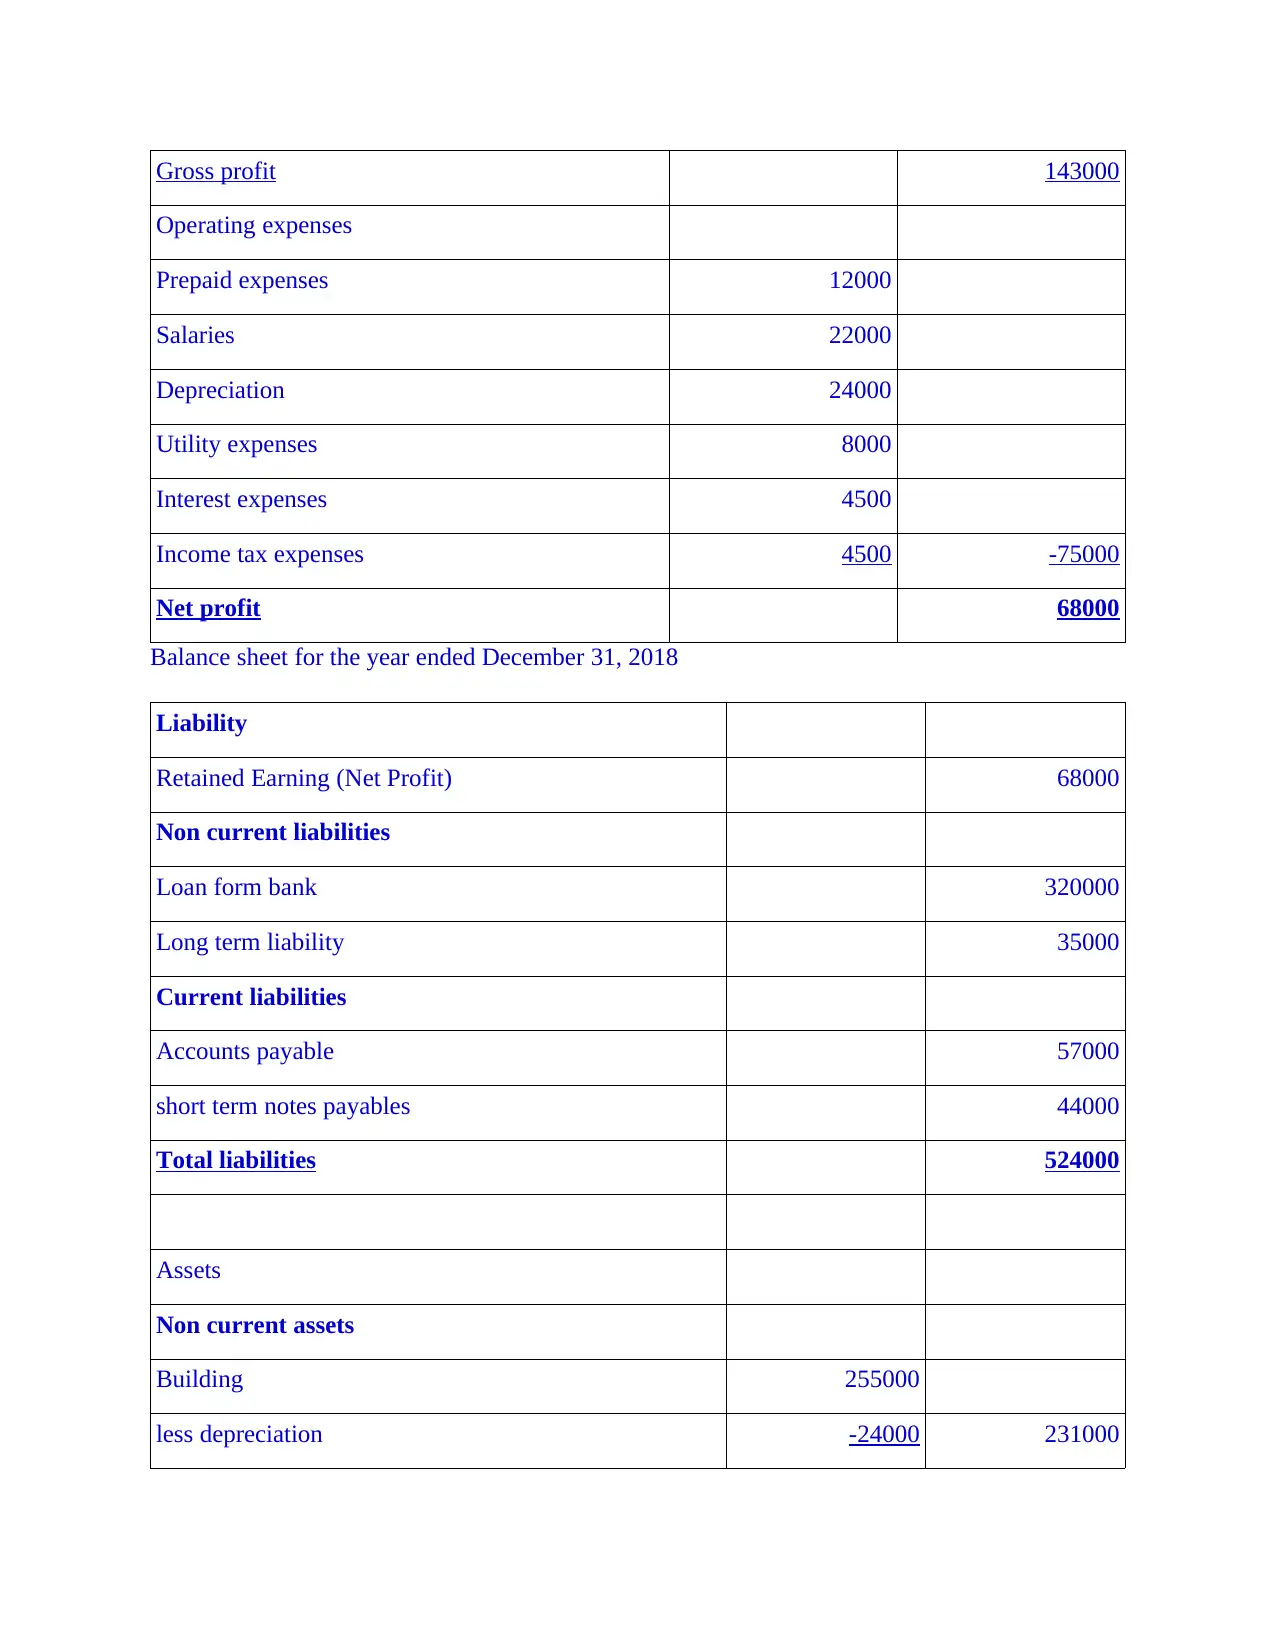
Gross profit 143000
Operating expenses
Prepaid expenses 12000
Salaries 22000
Depreciation 24000
Utility expenses 8000
Interest expenses 4500
Income tax expenses 4500 -75000
Net profit 68000
Balance sheet for the year ended December 31, 2018
Liability
Retained Earning (Net Profit) 68000
Non current liabilities
Loan form bank 320000
Long term liability 35000
Current liabilities
Accounts payable 57000
short term notes payables 44000
Total liabilities 524000
Assets
Non current assets
Building 255000
less depreciation -24000 231000
Paraphrase This Document
Need a fresh take? Get an instant paraphrase of this document with our AI Paraphraser
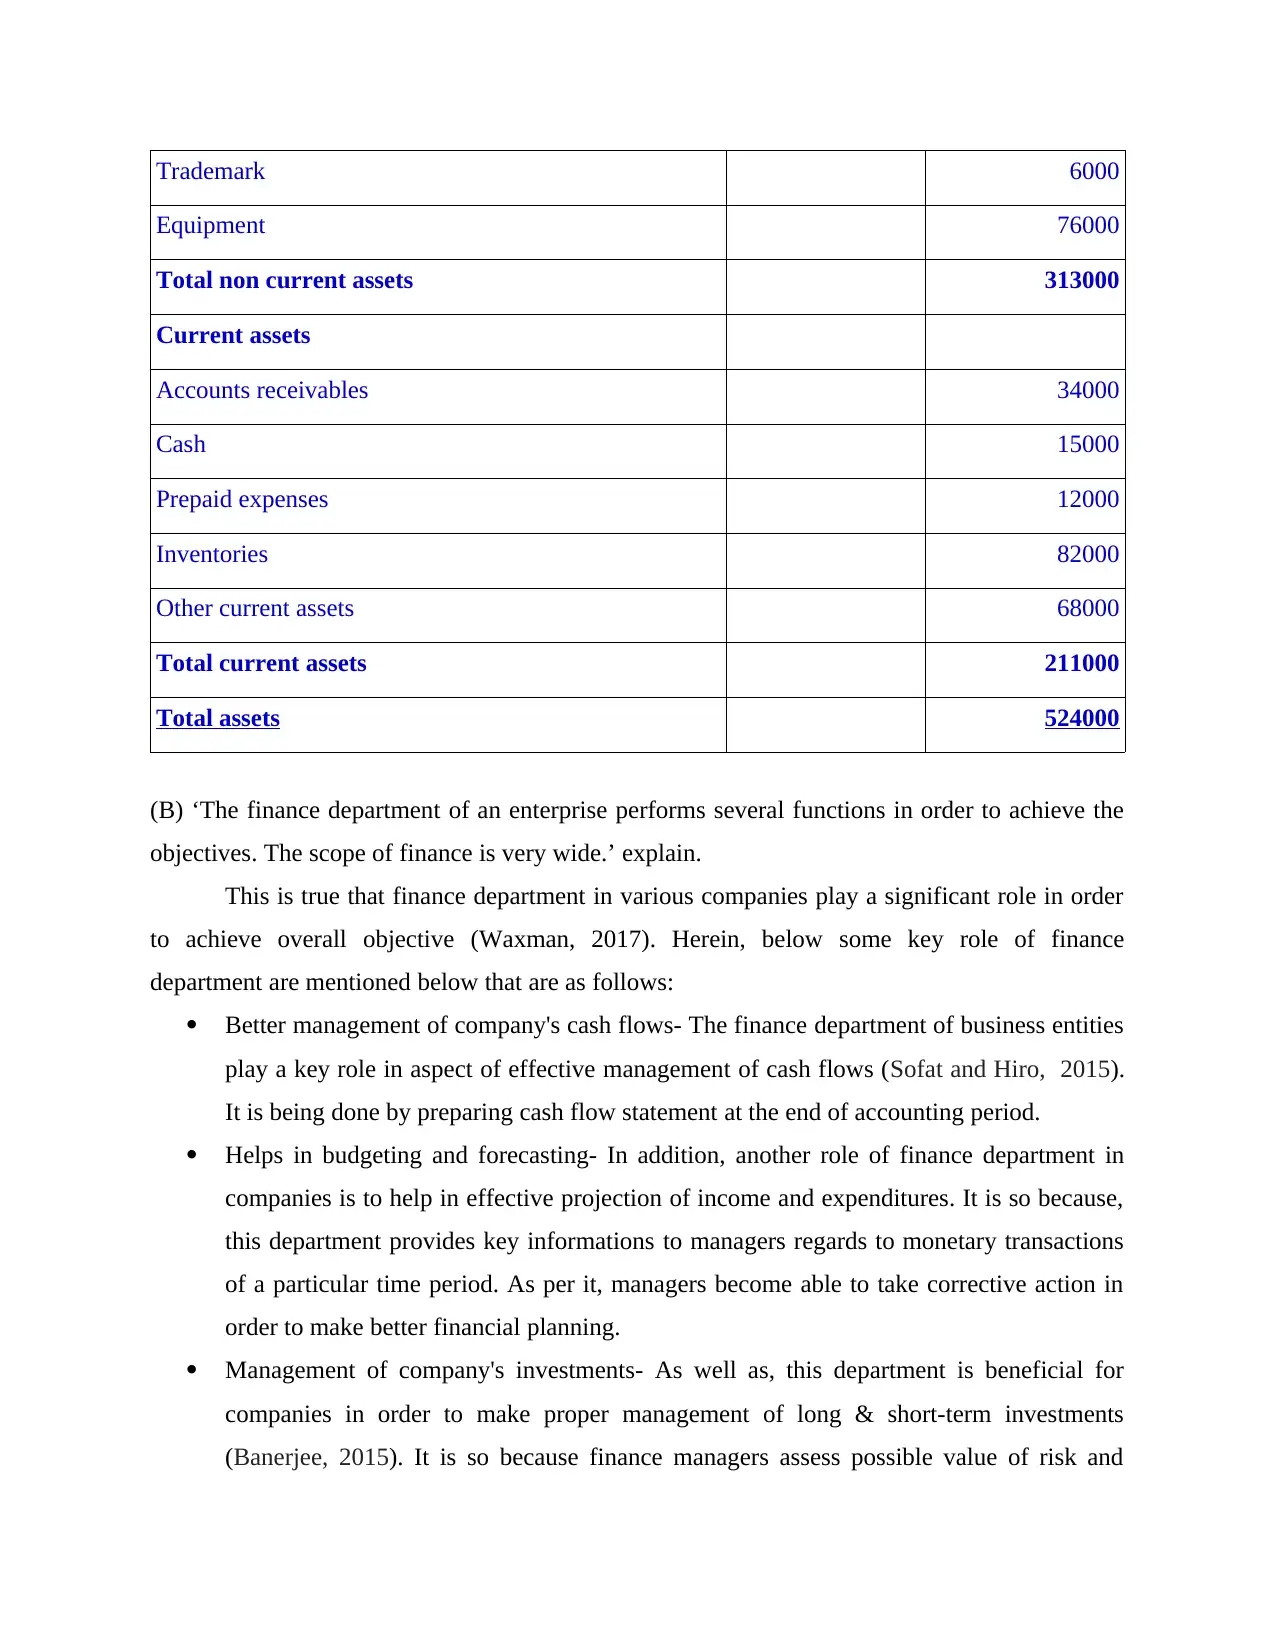
Trademark 6000
Equipment 76000
Total non current assets 313000
Current assets
Accounts receivables 34000
Cash 15000
Prepaid expenses 12000
Inventories 82000
Other current assets 68000
Total current assets 211000
Total assets 524000
(B) ‘The finance department of an enterprise performs several functions in order to achieve the
objectives. The scope of finance is very wide.’ explain.
This is true that finance department in various companies play a significant role in order
to achieve overall objective (Waxman, 2017). Herein, below some key role of finance
department are mentioned below that are as follows:
Better management of company's cash flows- The finance department of business entities
play a key role in aspect of effective management of cash flows (Sofat and Hiro, 2015).
It is being done by preparing cash flow statement at the end of accounting period.
Helps in budgeting and forecasting- In addition, another role of finance department in
companies is to help in effective projection of income and expenditures. It is so because,
this department provides key informations to managers regards to monetary transactions
of a particular time period. As per it, managers become able to take corrective action in
order to make better financial planning.
Management of company's investments- As well as, this department is beneficial for
companies in order to make proper management of long & short-term investments
(Banerjee, 2015). It is so because finance managers assess possible value of risk and
return on the investments. On the basis of it they guide to company about whether they
should make investment or not.
Management of taxes- It becomes essential for companies to make proper management of
taxes so that retained earning can be increased. The finance department provides
institutions to managers in order to save total amount of tax payable liabilities.
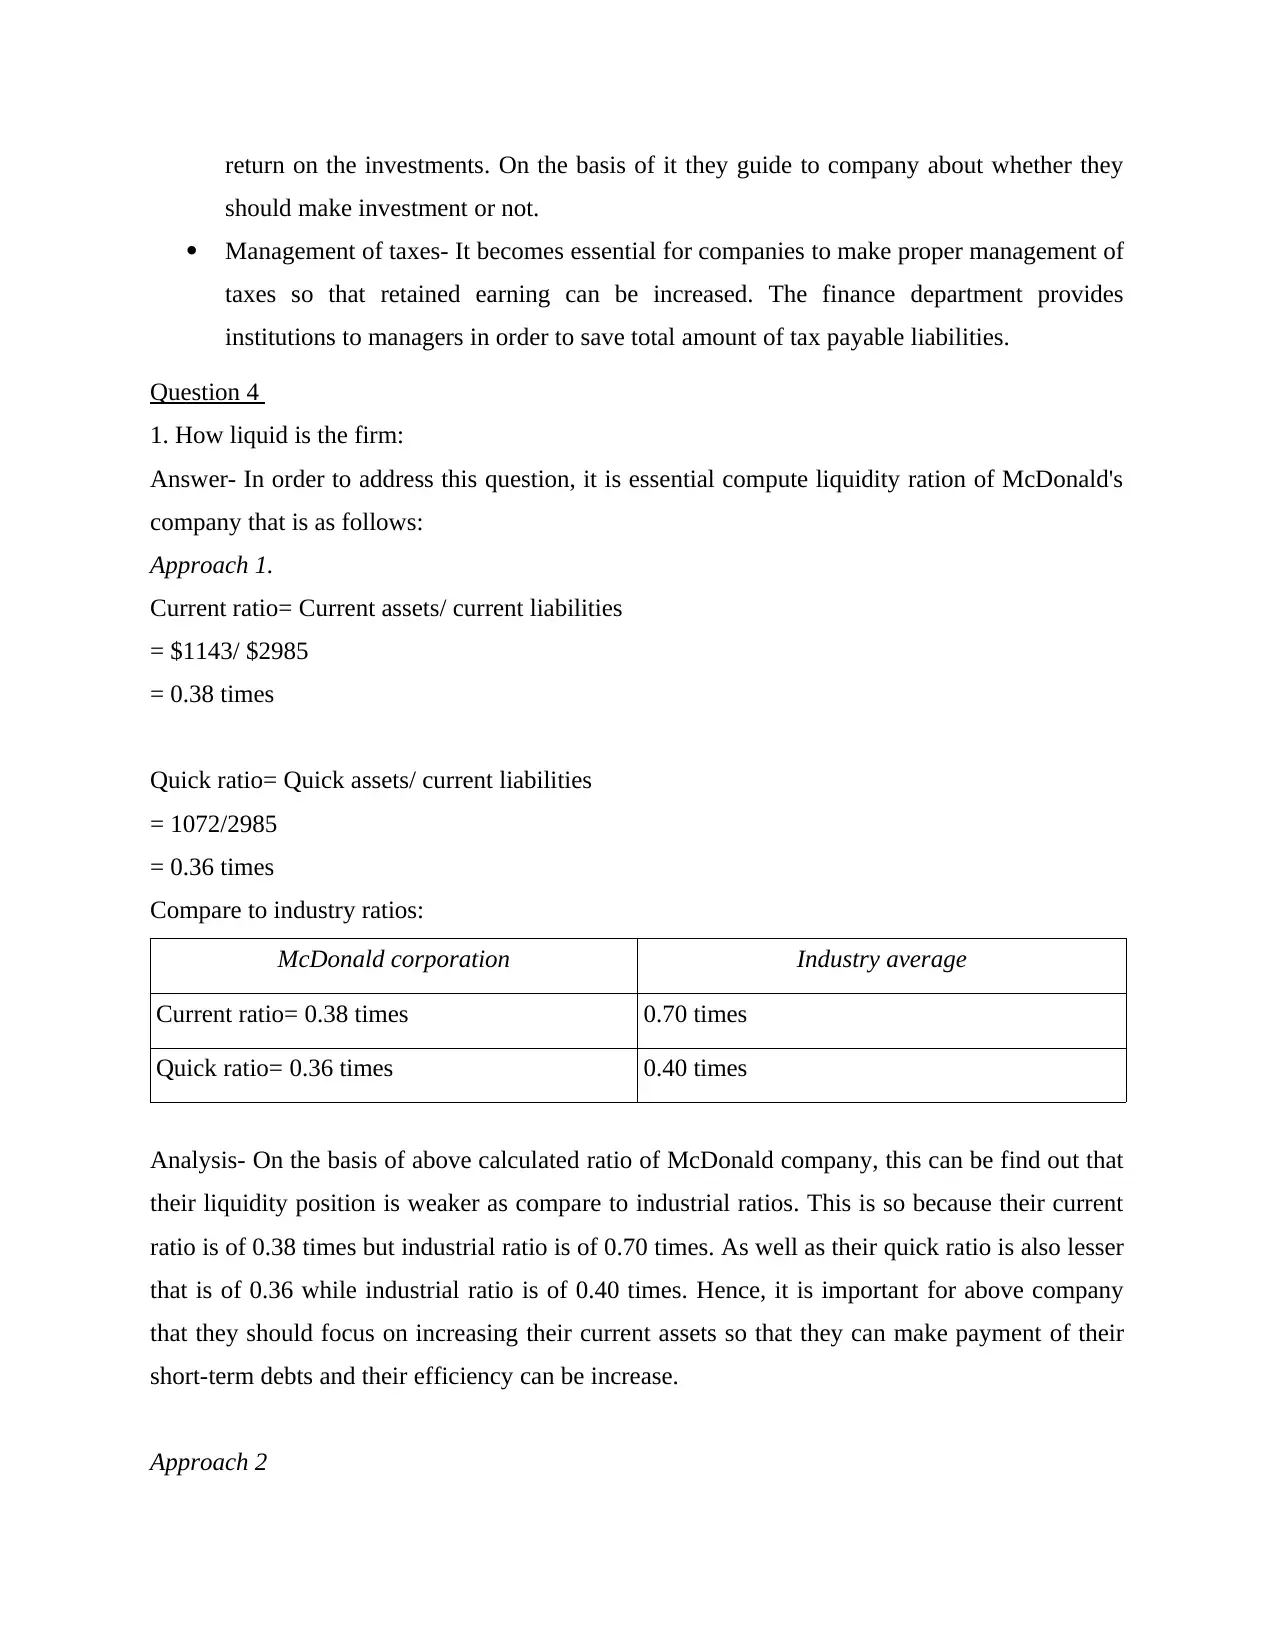
Question 4
1. How liquid is the firm:
Answer- In order to address this question, it is essential compute liquidity ration of McDonald's
company that is as follows:
Approach 1.
Current ratio= Current assets/ current liabilities
= $1143/ $2985
= 0.38 times
Quick ratio= Quick assets/ current liabilities
= 1072/2985
= 0.36 times
Compare to industry ratios:
McDonald corporation Industry average
Current ratio= 0.38 times 0.70 times
Quick ratio= 0.36 times 0.40 times
Analysis- On the basis of above calculated ratio of McDonald company, this can be find out that
their liquidity position is weaker as compare to industrial ratios. This is so because their current
ratio is of 0.38 times but industrial ratio is of 0.70 times. As well as their quick ratio is also lesser
that is of 0.36 while industrial ratio is of 0.40 times. Hence, it is important for above company
that they should focus on increasing their current assets so that they can make payment of their
short-term debts and their efficiency can be increase.
Approach 2
should make investment or not.
Management of taxes- It becomes essential for companies to make proper management of
taxes so that retained earning can be increased. The finance department provides
institutions to managers in order to save total amount of tax payable liabilities.
Question 4
1. How liquid is the firm:
Answer- In order to address this question, it is essential compute liquidity ration of McDonald's
company that is as follows:
Approach 1.
Current ratio= Current assets/ current liabilities
= $1143/ $2985
= 0.38 times
Quick ratio= Quick assets/ current liabilities
= 1072/2985
= 0.36 times
Compare to industry ratios:
McDonald corporation Industry average
Current ratio= 0.38 times 0.70 times
Quick ratio= 0.36 times 0.40 times
Analysis- On the basis of above calculated ratio of McDonald company, this can be find out that
their liquidity position is weaker as compare to industrial ratios. This is so because their current
ratio is of 0.38 times but industrial ratio is of 0.70 times. As well as their quick ratio is also lesser
that is of 0.36 while industrial ratio is of 0.40 times. Hence, it is important for above company
that they should focus on increasing their current assets so that they can make payment of their
short-term debts and their efficiency can be increase.
Approach 2
⊘ This is a preview!⊘
Do you want full access?
Subscribe today to unlock all pages.
Trusted by 1+ million students worldwide

In order to assess the liquidity position, this is important to identify firm's ability to convert
accounts receivable and stock into cash on a particular time. In the aspect of above McDonald's
company it is mentioned below in such manner:
McDonald corporation Industry average
Average collection period= Accounts
receivable/ daily credit sales
-
$484M/ $11508M= 0.420 times or 15.3 days 6.5 days
On the basis of above calculation, this can be find out that above company does not collect their
debts in an effective manner as compare to average industries. This is so because they take 15
days in order to gather debts while average time of industry is 6.5 days. Thus, it is important to
focus on collecting debt in an effective manner so that days can be minimised.
Accounts receivable turn over
McDonald corporation Industry average
Accounts receivable turnover= Credit sales/ accounts receivable -
$11508M/ $484M= 23.8 times/ year 56.2 times/ year
As per the above calculated ratio, this can be find out that company is not able to meet turn its
receivable in long time period. Such as their receivable turn over is of 23.8 time in a year but
average industrial ratio is 56.2 time/ year.
Inventory turn over ratio
McDonald corporation Industry average
Inventory turn over= Cost of good sold/ inventory -
$6537M/ $71M= 92 times/ year 35 times year
Paraphrase This Document
Need a fresh take? Get an instant paraphrase of this document with our AI Paraphraser
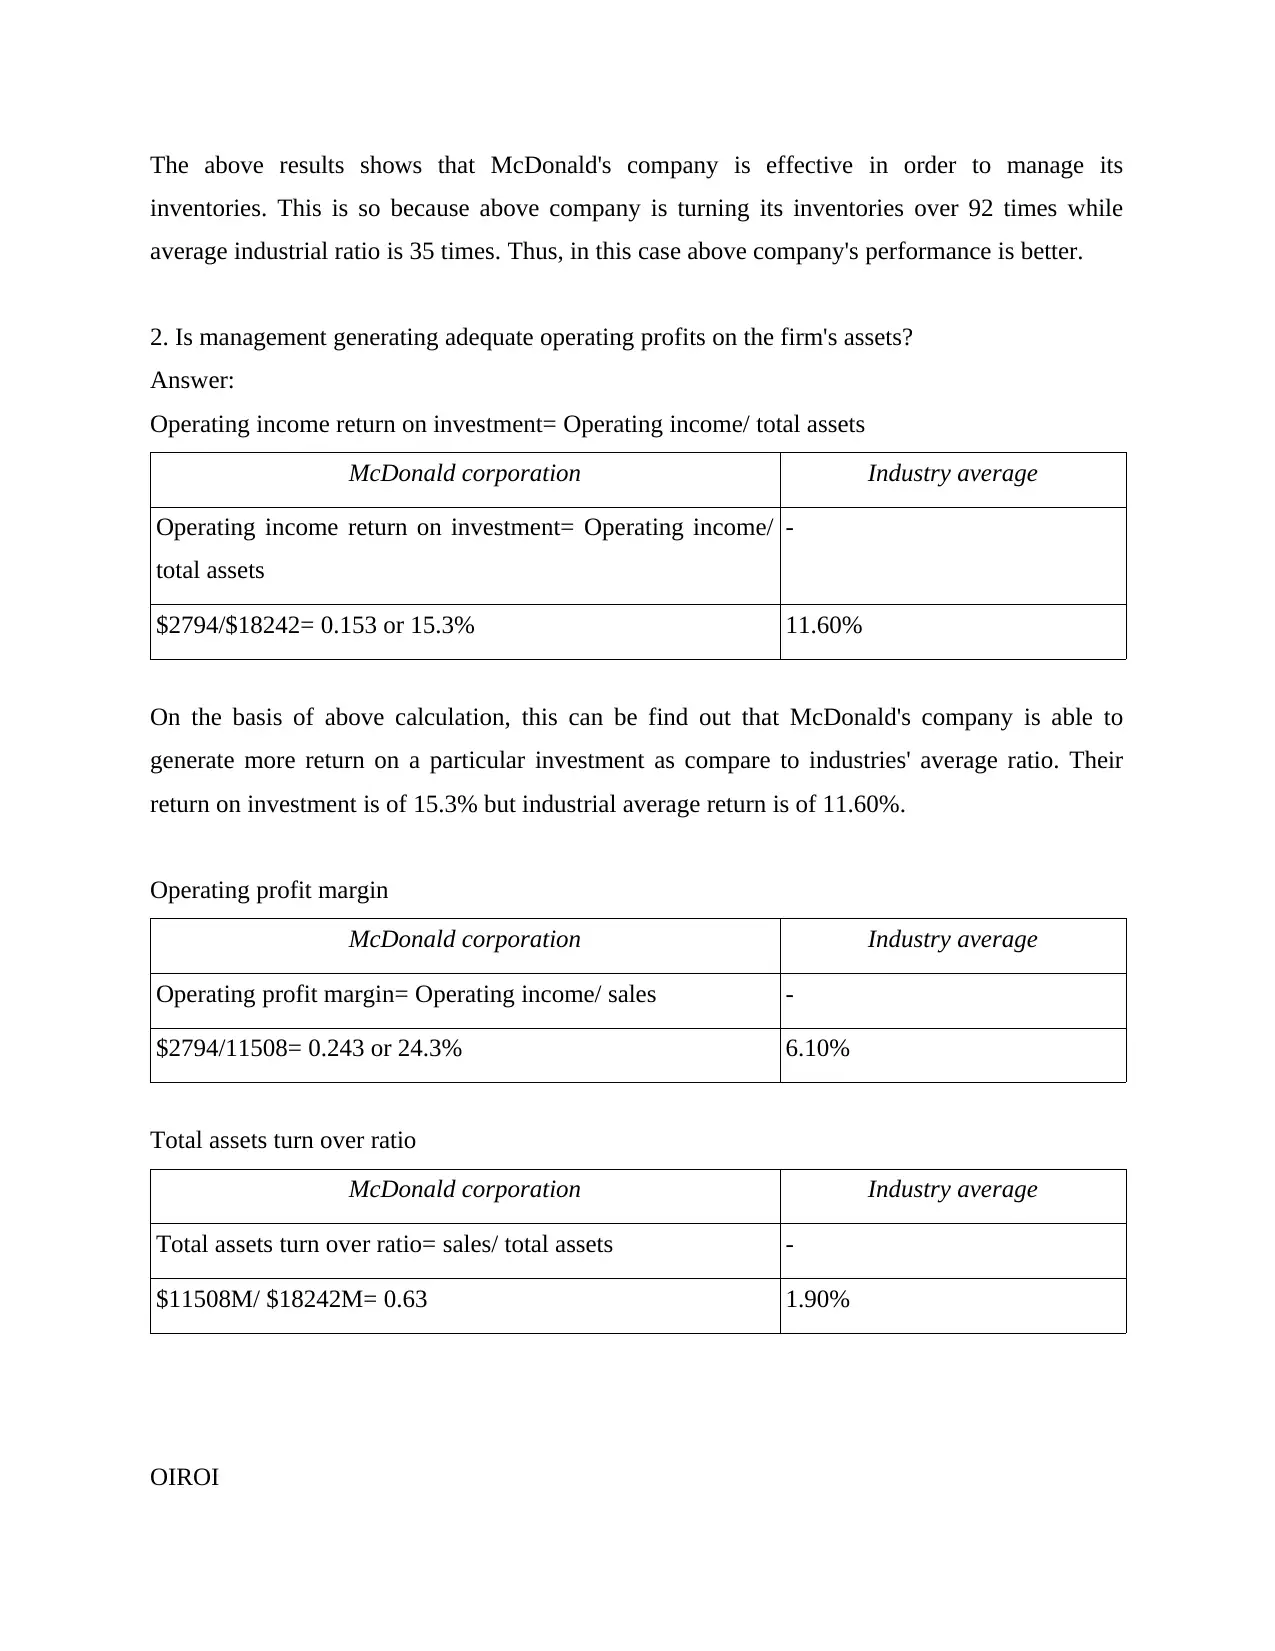
The above results shows that McDonald's company is effective in order to manage its
inventories. This is so because above company is turning its inventories over 92 times while
average industrial ratio is 35 times. Thus, in this case above company's performance is better.
2. Is management generating adequate operating profits on the firm's assets?
Answer:
Operating income return on investment= Operating income/ total assets
McDonald corporation Industry average
Operating income return on investment= Operating income/
total assets
-
$2794/$18242= 0.153 or 15.3% 11.60%
On the basis of above calculation, this can be find out that McDonald's company is able to
generate more return on a particular investment as compare to industries' average ratio. Their
return on investment is of 15.3% but industrial average return is of 11.60%.
Operating profit margin
McDonald corporation Industry average
Operating profit margin= Operating income/ sales -
$2794/11508= 0.243 or 24.3% 6.10%
Total assets turn over ratio
McDonald corporation Industry average
Total assets turn over ratio= sales/ total assets -
$11508M/ $18242M= 0.63 1.90%
OIROI
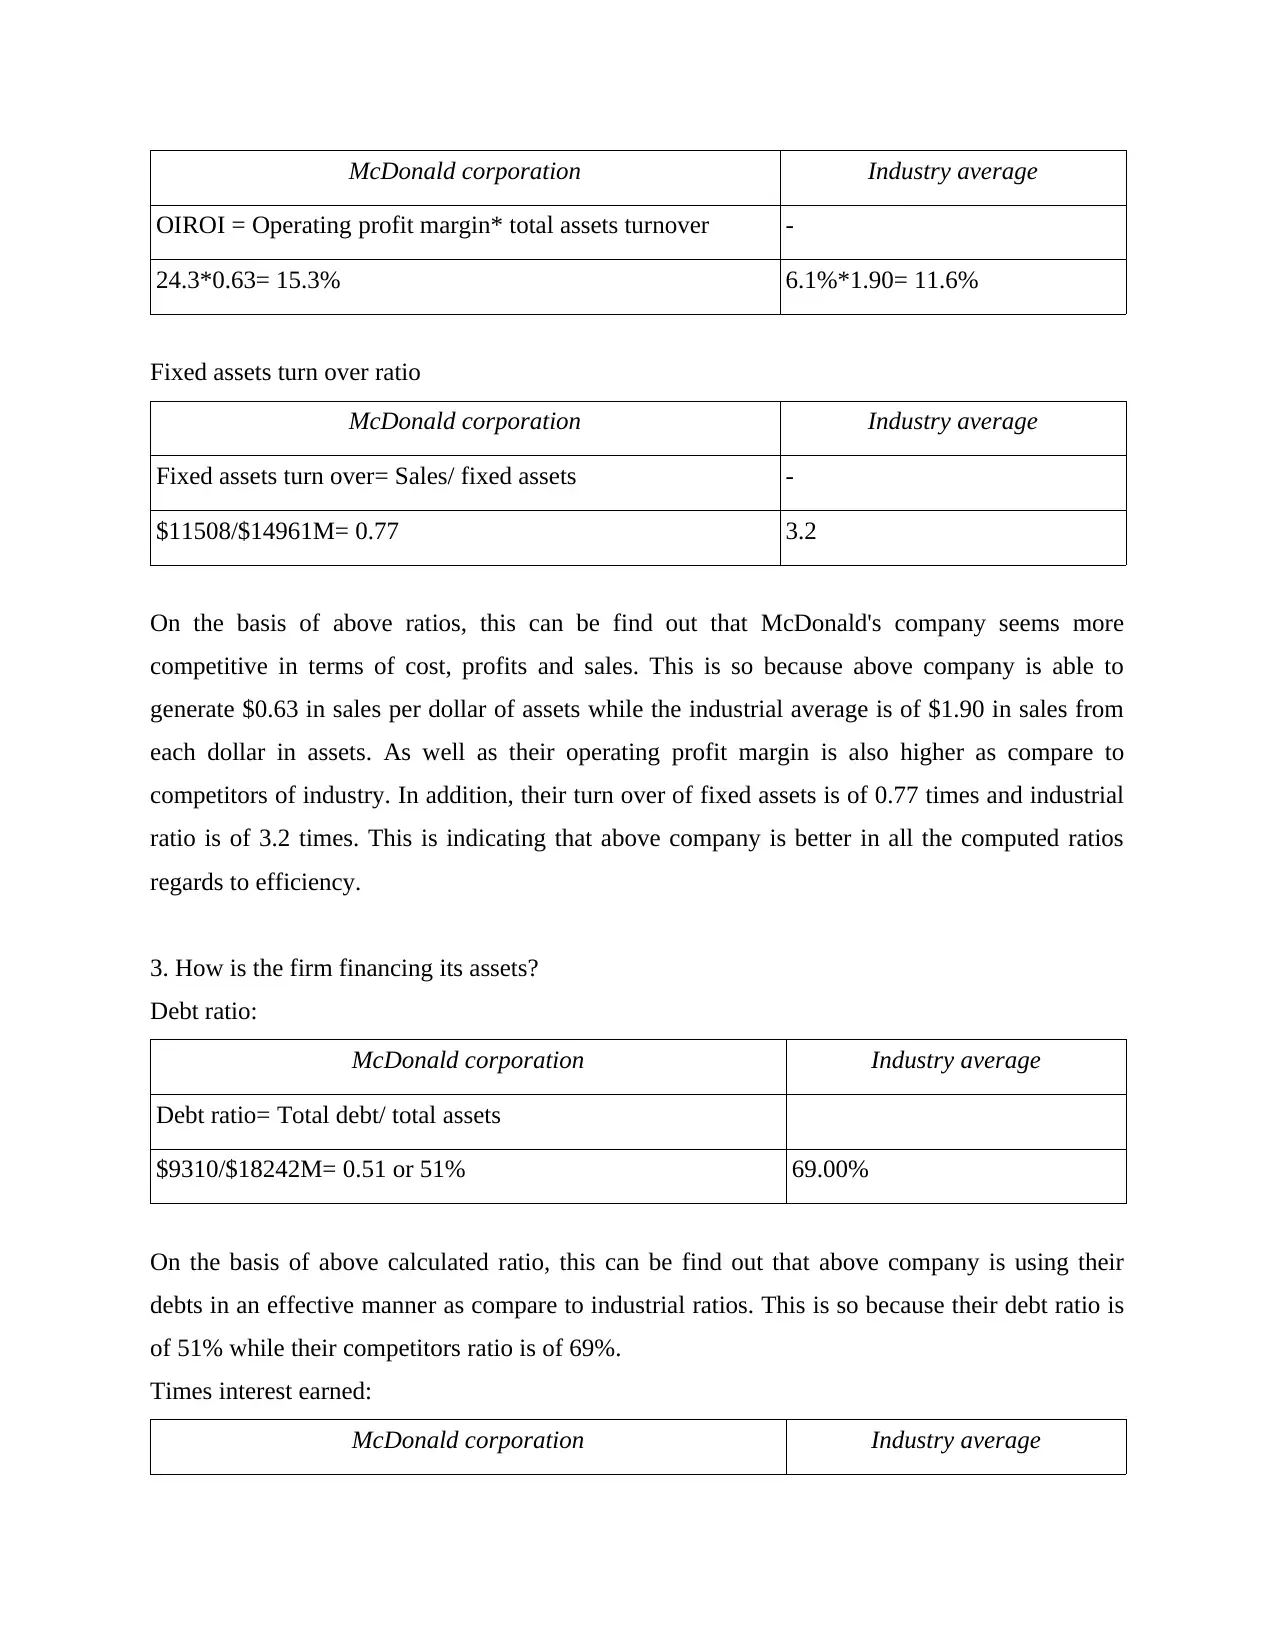
McDonald corporation Industry average
OIROI = Operating profit margin* total assets turnover -
24.3*0.63= 15.3% 6.1%*1.90= 11.6%
Fixed assets turn over ratio
McDonald corporation Industry average
Fixed assets turn over= Sales/ fixed assets -
$11508/$14961M= 0.77 3.2
On the basis of above ratios, this can be find out that McDonald's company seems more
competitive in terms of cost, profits and sales. This is so because above company is able to
generate $0.63 in sales per dollar of assets while the industrial average is of $1.90 in sales from
each dollar in assets. As well as their operating profit margin is also higher as compare to
competitors of industry. In addition, their turn over of fixed assets is of 0.77 times and industrial
ratio is of 3.2 times. This is indicating that above company is better in all the computed ratios
regards to efficiency.
3. How is the firm financing its assets?
Debt ratio:
McDonald corporation Industry average
Debt ratio= Total debt/ total assets
$9310/$18242M= 0.51 or 51% 69.00%
On the basis of above calculated ratio, this can be find out that above company is using their
debts in an effective manner as compare to industrial ratios. This is so because their debt ratio is
of 51% while their competitors ratio is of 69%.
Times interest earned:
McDonald corporation Industry average
⊘ This is a preview!⊘
Do you want full access?
Subscribe today to unlock all pages.
Trusted by 1+ million students worldwide
1 out of 21
Related Documents


Your All-in-One AI-Powered Toolkit for Academic Success.
+13062052269
info@desklib.com
Available 24*7 on WhatsApp / Email
![[object Object]](/_next/static/media/star-bottom.7253800d.svg)
Unlock your academic potential
Copyright © 2020–2026 A2Z Services. All Rights Reserved. Developed and managed by ZUCOL.