MBA504: Financial Statement Analysis and Ratio Comparison

Verified

Added on  2022/09/30

|13
|644
|70
Report
AI Summary
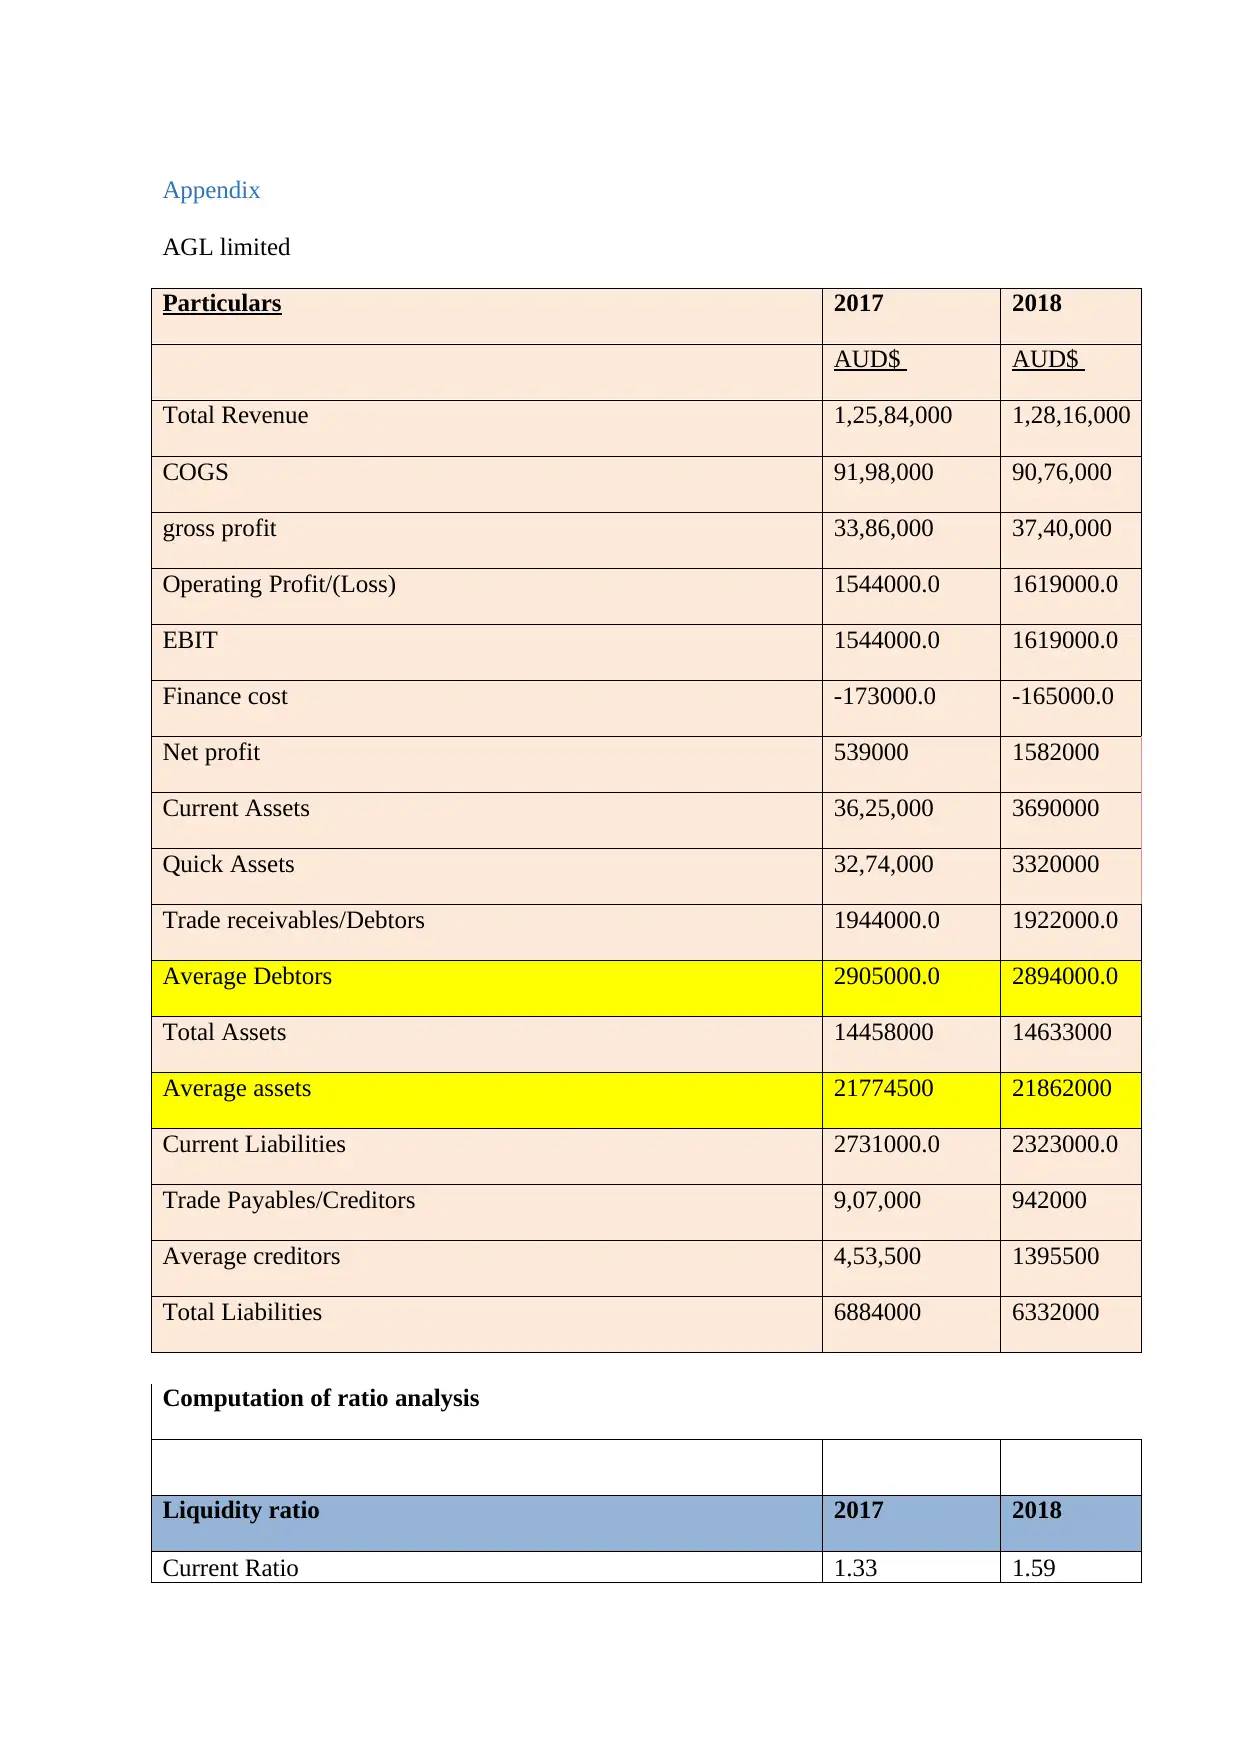
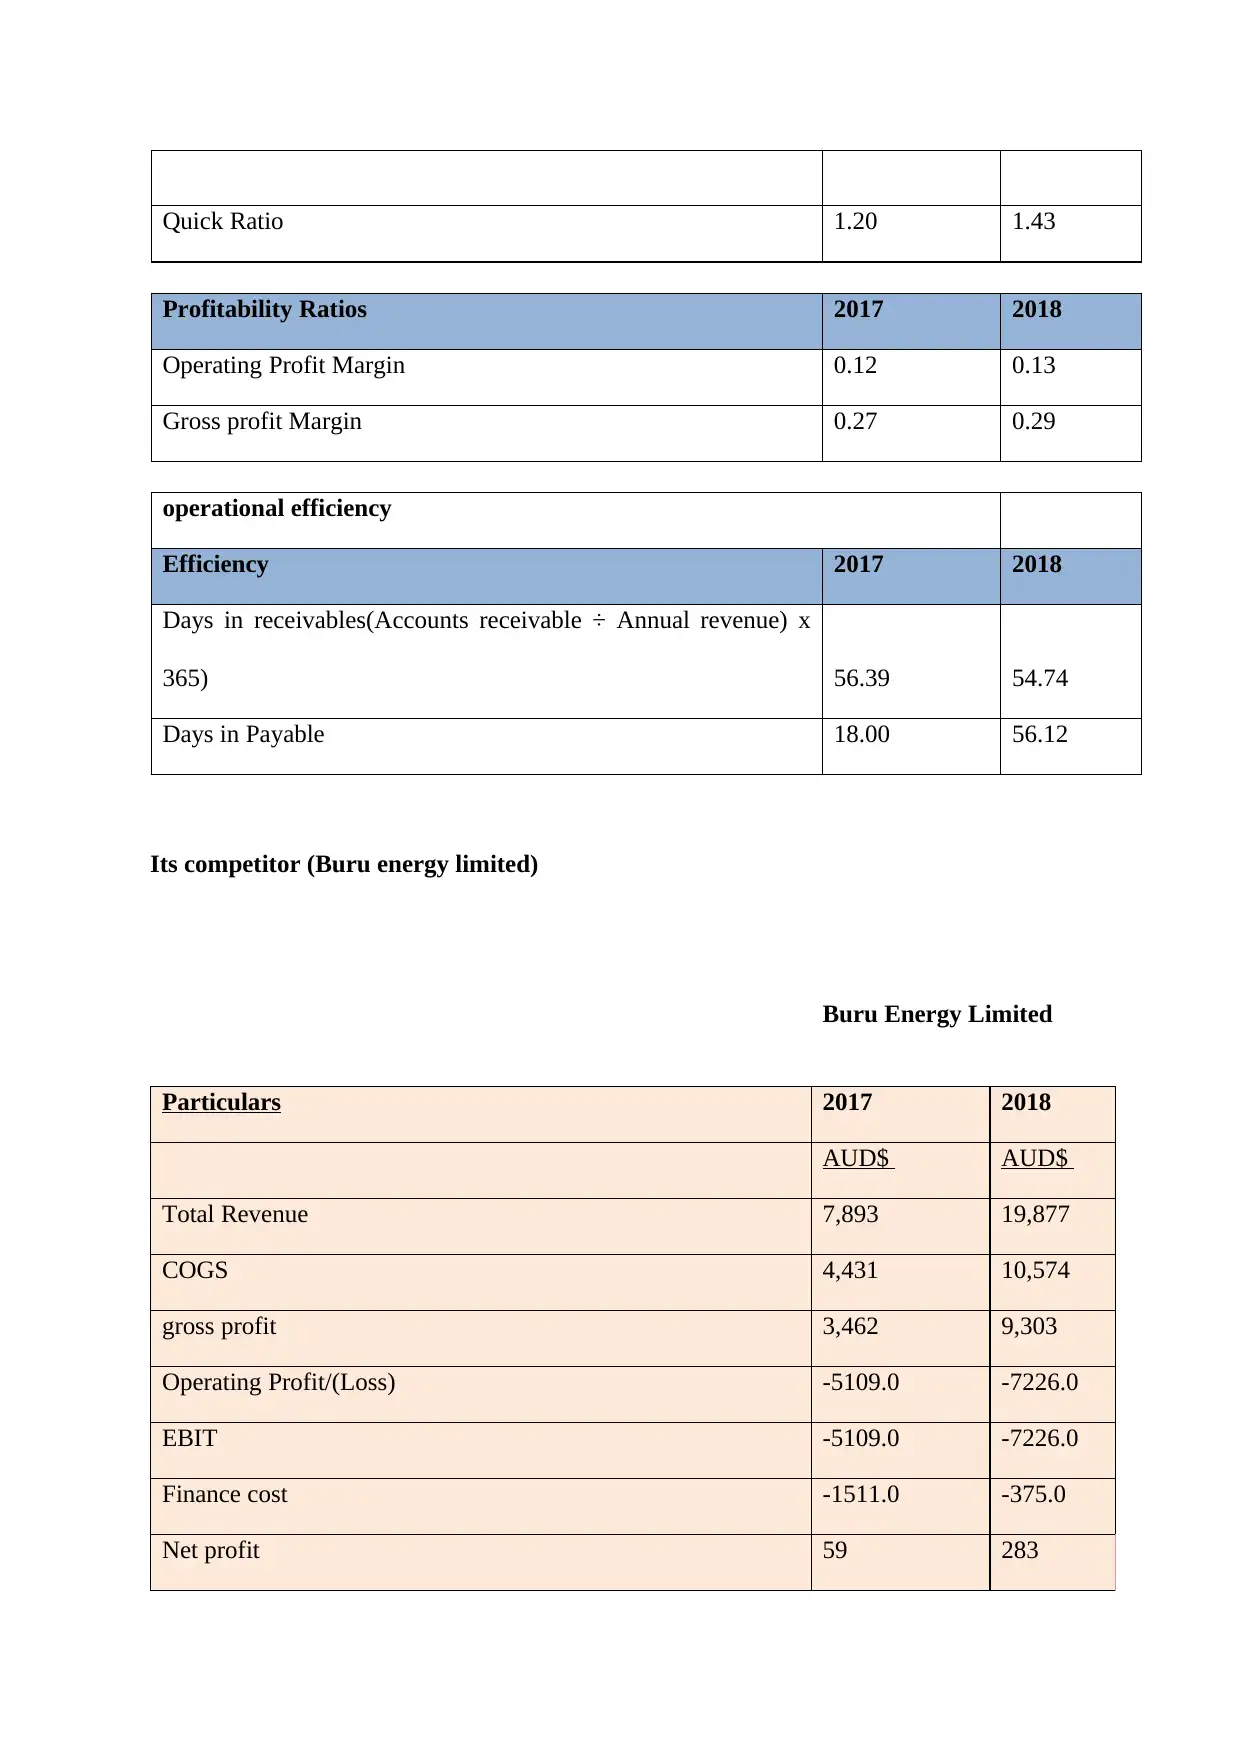
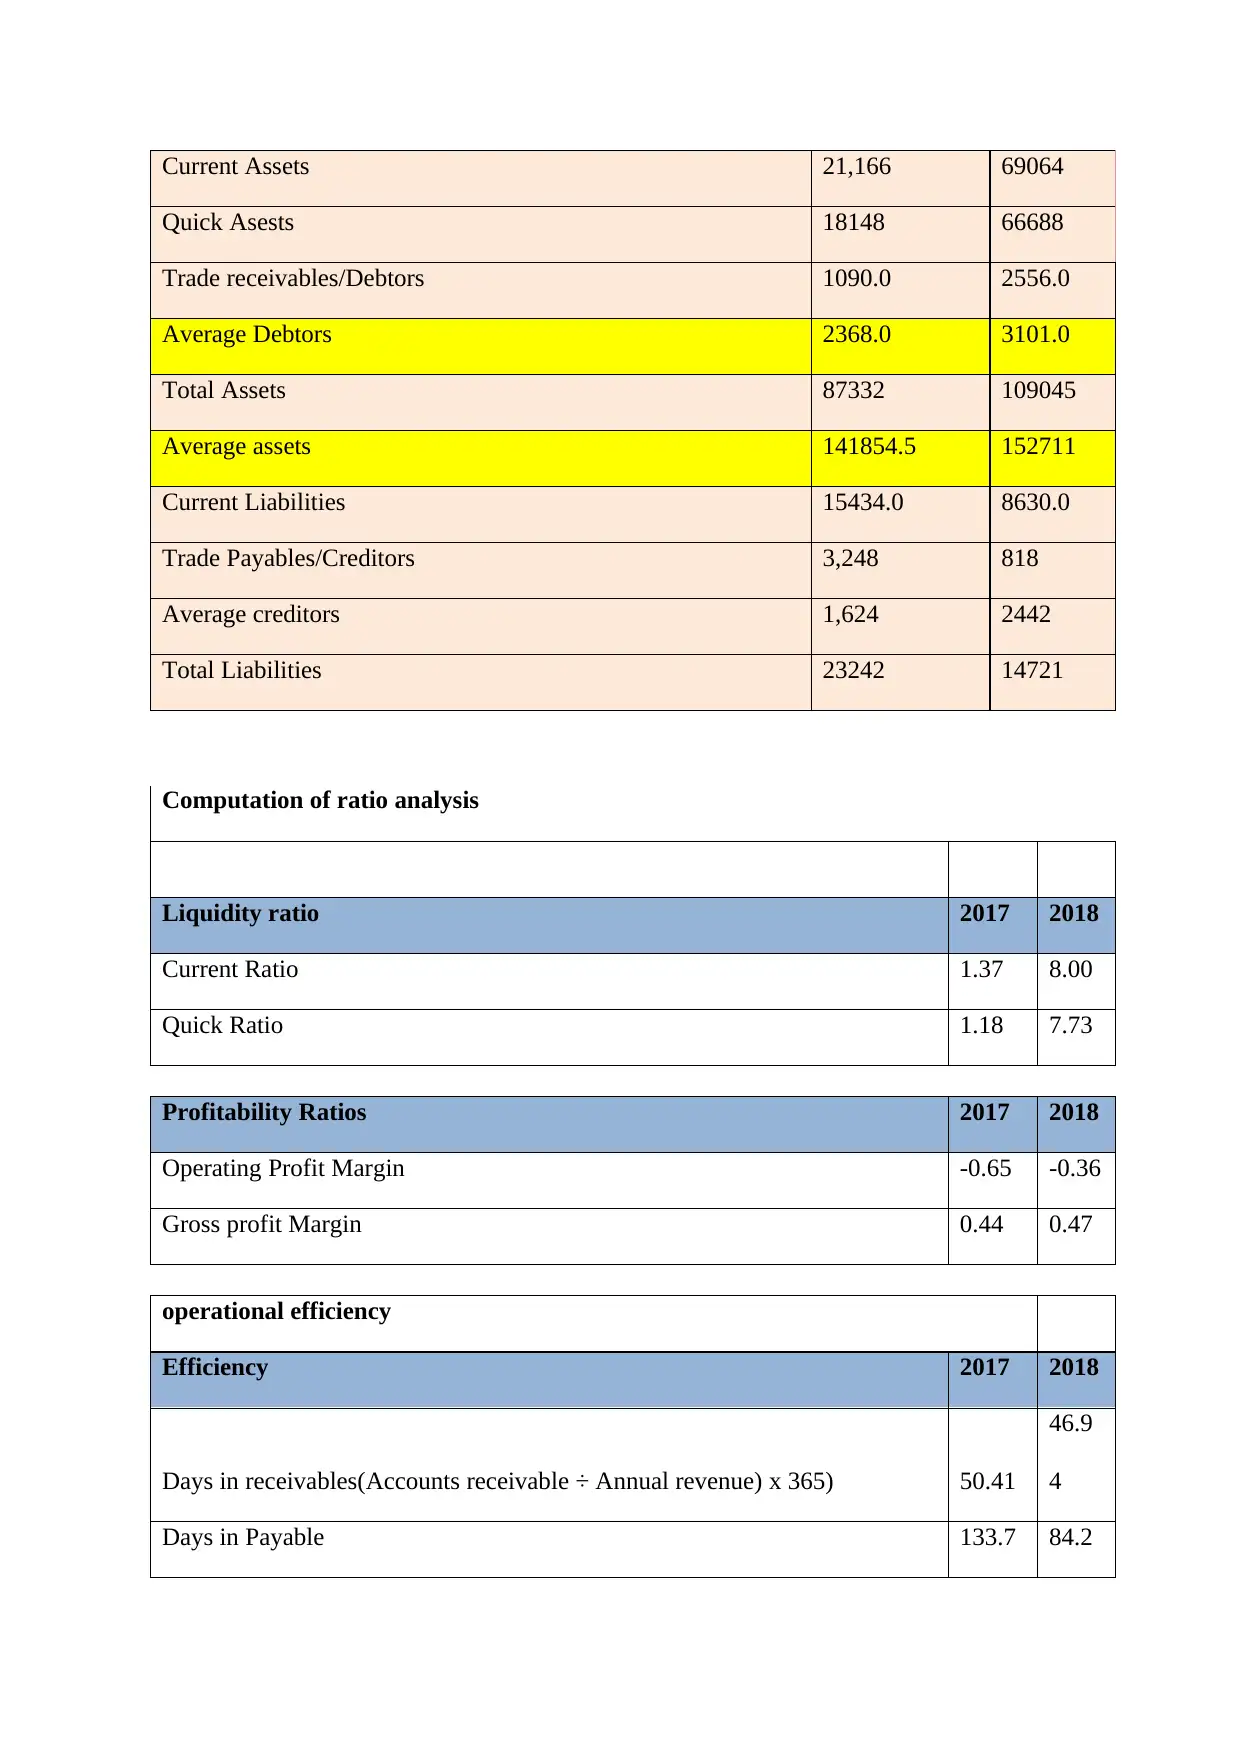
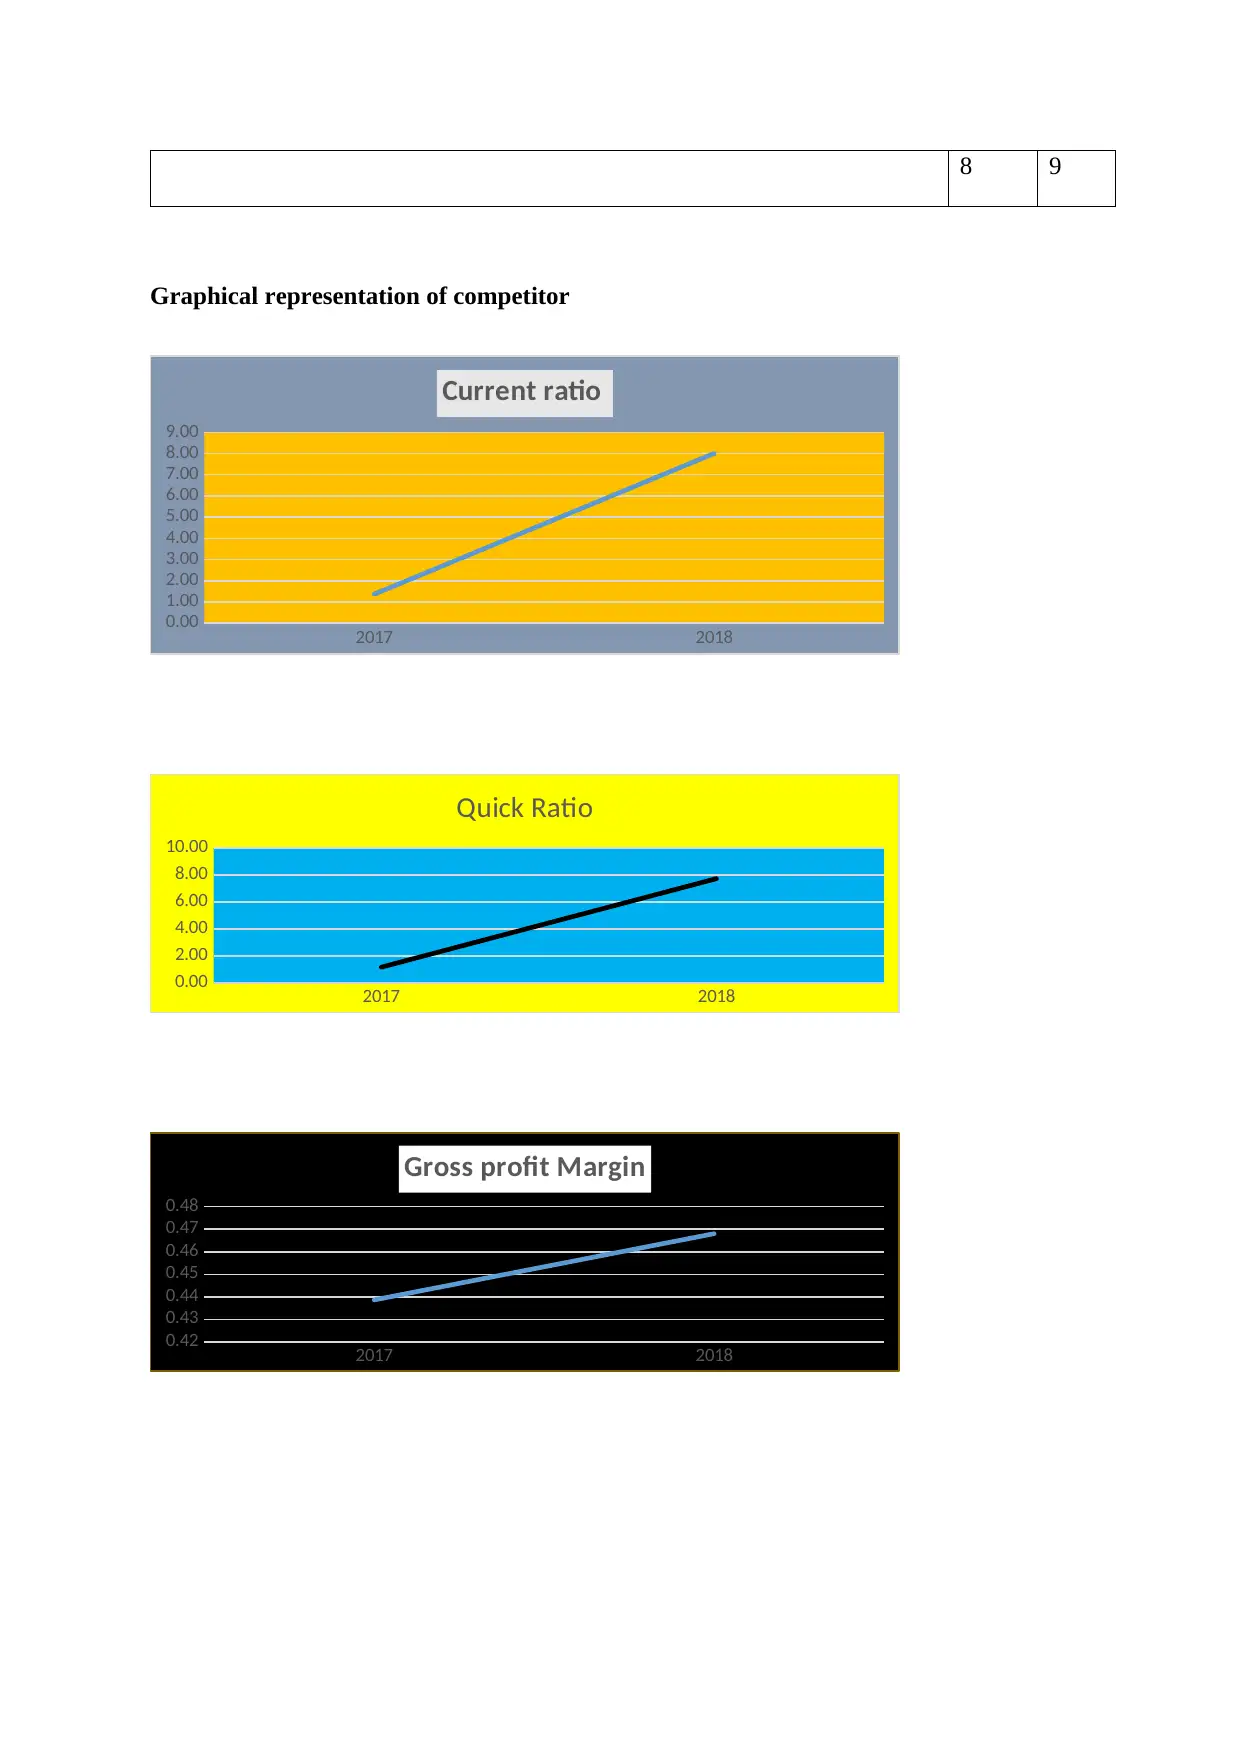
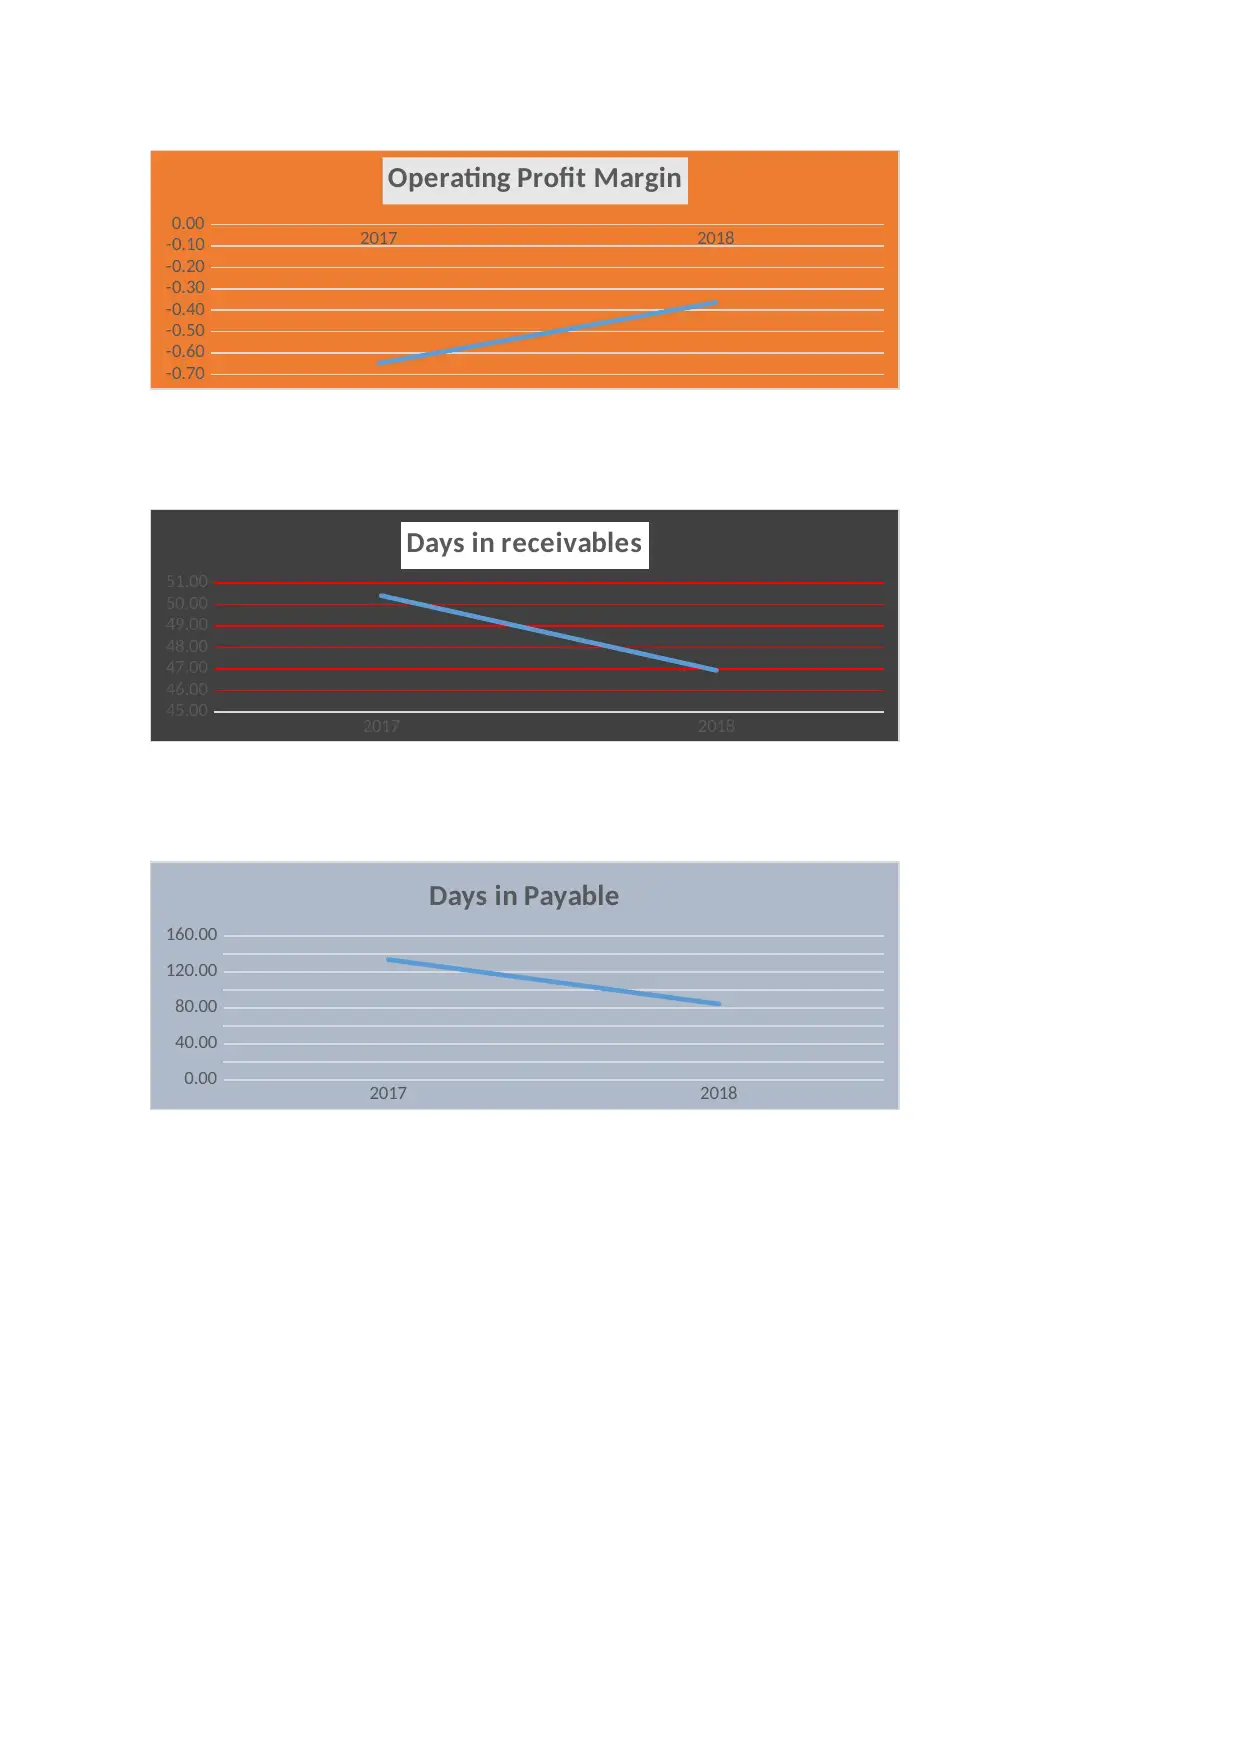
This report provides a comparative financial analysis of AGL Limited and Buru Energy Limited, focusing on key financial statements and ratio analysis. The analysis includes a summary of the companies' financial performance for 2017 and 2018, covering total revenue, cost of goods sold, gross profit, operating profit, net profit, current assets, quick assets, trade receivables, total assets, current liabilities, and trade payables. The report computes and compares various liquidity ratios (current ratio, quick ratio), profitability ratios (operating profit margin, gross profit margin), and operational efficiency metrics (days in receivables, days in payables) for both companies. Graphical representations are included to visualize the data. The report also provides references to the annual reports and academic papers used for the analysis.
tabler-icon-diamond-filled.svg

Contribute Materials

Your contribution can guide someone’s learning journey. Share your documents today.
Document Page
ACCOUNTING AND FINANCIAL
MANAGEMENT
tabler-icon-diamond-filled.svg

Secure Best Marks with AI Grader

Need help grading? Try our AI Grader for instant feedback on your assignments.
Document Page
Contents
Summary...............................................................................................................................................2
PPT-......................................................................................................................................................3
Key Notes..............................................................................................................................................7
Appendix...............................................................................................................................................9
Document Page
Summary
PPT-
1.
2.
3.
Document Page
4.
5.
tabler-icon-diamond-filled.svg

Secure Best Marks with AI Grader

Need help grading? Try our AI Grader for instant feedback on your assignments.
Document Page
6.
7.
Document Page
8.
9.
Document Page
10.
tabler-icon-diamond-filled.svg

Paraphrase This Document

Need a fresh take? Get an instant paraphrase of this document with our AI Paraphraser
Document Page
Appendix
AGL limited
Particulars 2017 2018
AUD$ AUD$
Total Revenue 1,25,84,000 1,28,16,000
COGS 91,98,000 90,76,000
gross profit 33,86,000 37,40,000
Operating Profit/(Loss) 1544000.0 1619000.0
EBIT 1544000.0 1619000.0
Finance cost -173000.0 -165000.0
Net profit 539000 1582000
Current Assets 36,25,000 3690000
Quick Assets 32,74,000 3320000
Trade receivables/Debtors 1944000.0 1922000.0
Average Debtors 2905000.0 2894000.0
Total Assets 14458000 14633000
Average assets 21774500 21862000
Current Liabilities 2731000.0 2323000.0
Trade Payables/Creditors 9,07,000 942000
Average creditors 4,53,500 1395500
Total Liabilities 6884000 6332000
Computation of ratio analysis
Liquidity ratio 2017 2018
Current Ratio 1.33 1.59
Document Page
Quick Ratio 1.20 1.43
Profitability Ratios 2017 2018
Operating Profit Margin 0.12 0.13
Gross profit Margin 0.27 0.29
operational efficiency
Efficiency 2017 2018
Days in receivables(Accounts receivable ÷ Annual revenue) x
365) 56.39 54.74
Days in Payable 18.00 56.12
Its competitor (Buru energy limited)
Buru Energy Limited
Particulars 2017 2018
AUD$ AUD$
Total Revenue 7,893 19,877
COGS 4,431 10,574
gross profit 3,462 9,303
Operating Profit/(Loss) -5109.0 -7226.0
EBIT -5109.0 -7226.0
Finance cost -1511.0 -375.0
Net profit 59 283
Document Page
Current Assets 21,166 69064
Quick Asests 18148 66688
Trade receivables/Debtors 1090.0 2556.0
Average Debtors 2368.0 3101.0
Total Assets 87332 109045
Average assets 141854.5 152711
Current Liabilities 15434.0 8630.0
Trade Payables/Creditors 3,248 818
Average creditors 1,624 2442
Total Liabilities 23242 14721
Computation of ratio analysis
Liquidity ratio 2017 2018
Current Ratio 1.37 8.00
Quick Ratio 1.18 7.73
Profitability Ratios 2017 2018
Operating Profit Margin -0.65 -0.36
Gross profit Margin 0.44 0.47
operational efficiency
Efficiency 2017 2018
Days in receivables(Accounts receivable ÷ Annual revenue) x 365) 50.41
46.9
4
Days in Payable 133.7 84.2
tabler-icon-diamond-filled.svg

Secure Best Marks with AI Grader

Need help grading? Try our AI Grader for instant feedback on your assignments.
Document Page
8 9
Graphical representation of competitor
2017 2018
0.00
1.00
2.00
3.00
4.00
5.00
6.00
7.00
8.00
9.00
Current ratio
2017 2018
0.00
2.00
4.00
6.00
8.00
10.00
Quick Ratio
2017 2018
0.42
0.43
0.44
0.45
0.46
0.47
0.48
Gross profit Margin
Document Page
2017 2018
-0.70
-0.60
-0.50
-0.40
-0.30
-0.20
-0.10
0.00
Operating Profit Margin
2017 2018
45.00
46.00
47.00
48.00
49.00
50.00
51.00
Days in receivables
2017 2018
0.00
40.00
80.00
120.00
160.00
Days in Payable
Document Page
References
AGL limited, (2018). Annual reports. Retrieved from:
http://www.annualreports.com/HostedData/AnnualReports/PDF/ASX_AGK.AX_201
8.pdf
Agrawal, A., & Tambe, P. (2016). Private equity and workers’ career paths: the role of
technological change. The Review of Financial Studies, 29(9), 2455-2489.
Hanselaar, R. M., Stulz, R. M., & Van Dijk, M. A. (2019). Do firms issue more equity when
markets become more liquid?. Journal of Financial Economics, 133(1), 64-82.
Liang, D., Lu, C. C., Tsai, C. F., & Shih, G. A. (2016). Financial ratios and corporate
governance indicators in bankruptcy prediction: A comprehensive study. European
Journal of Operational Research, 252(2), 561-572.
Misund, B. (2017). Financial ratios and prediction on corporate bankruptcy in the Atlantic
salmon industry. Aquaculture economics & management, 21(2), 241-260.
Morales-Díaz, J., & Zamora-Ramírez, C. (2018). The impact of IFRS 16 on key financial
ratios: a new methodological approach. Accounting in Europe, 15(1), 105-133.
Schmidgall, R. S., & DeFranco, A. (2016). How to best use financial ratios in benchmarking
and decision making in clubs: Review of the decade 2003–2012. International Journal
of Hospitality & Tourism Administration, 17(2), 179-197.
Senteney, M., Stowe, D. L., & Stowe, J. D. (2019). Financial Statement Change and Equity
Risk. Available at SSRN 3335910.
Wong, K., & Joshi, M. (2015). The impact of lease capitalisation on financial statements and
key ratios: Evidence from Australia. Australasian Accounting, Business and Finance
Journal, 9(3), 27-44.
chevron_up_icon
1 out of 13
circle_padding
hide_on_mobile
zoom_out_icon
logo.png

Your All-in-One AI-Powered Toolkit for Academic Success.

Available 24*7 on WhatsApp / Email

[object Object]