Semester 1 2018 UUAC5300 Assignment 2: Accounting and Finance Solution
VerifiedAdded on 2021/05/31
|15
|3222
|20
Homework Assignment
AI Summary
This document presents a comprehensive solution to an accounting and finance assignment, focusing on financial statement analysis, ratio analysis, and budgeting. The solution begins with an evaluation of financial statements, including implications of various ratios like current ratio, quick ratio, asset turnover ratio, cash debt coverage, profit and earnings per share, to assess a company's financial health and debt worthiness. It then covers the calculation and significance of key ratios such as debt-equity ratio, interest coverage ratio, and debt ratio. Furthermore, the solution includes a horizontal analysis of net sales and profit after tax, providing insights into sales and profitability trends. It also presents a detailed ratio analysis of profitability, financial stability, and asset utilization, using data from New Zealand Post Group's annual reports. The assignment also includes a budgeting section with a schedule of expected cash receipts and a cash budget. The document offers valuable insights into financial statement analysis and management accounting tools for business decision-making.
1
Accounting and Finance for Executives – UUAC5300
Assignment - 2
Semester 1 - 2018
Accounting and Finance for Executives – UUAC5300
Assignment - 2
Semester 1 - 2018
Paraphrase This Document
Need a fresh take? Get an instant paraphrase of this document with our AI Paraphraser
2
Solution 1: Evaluation of financial statements and reporting findings
Answer 1.1:
A:
Following are implications of the ratio provided for the lending decision:
Current ratio: Current ratio reflects the ability of company to pay the short term
liabilities. In year 2016, the current ratio was 3.1 times whereas it was reduced to 2.1
times in year 2017. It indicates that short term solvency position of Borrower’s company
has been reduced in the current year as compared with previous year. The current ratio of
2.1 times in current year shows that company has enough assets to pay the current
liabilities as it arises.
Quick Ratio: Quick ratio is also an important indicator of liquidity position of the
company as it takes it into account only those assets those are capable of converting into
cash and cash equivalent very rapidly. Quick ratio of Borrowers Company has increased
in year 2017 as compared to previous year that shows improvement in quick assets and
company has now more assets to pay the short term liabilities.
Asset Turnover Ratio: This ratio indicates how frequently company uses total assets to
earn the revenue. This ratio has been decreased in year 2017 as compared to year 2016
that indicated company efficiency to use the assets to produce the revenue has been
decreased in current year (Damodaran, 2011).
Cash Debt Coverage: This ratio shows level of operating cash flows as against the debt
liabilities of the company. As this ratio is less than 1 it indicates that company has very
less cash flow to pay back the debt capital. Although, there has been rise in this ratio that
indicates increase in flow net cash flow from the operating activity.
Profit and Earning per share: Profit of company has been decreased in current year by
8% as compared with previous reflect the poor profitability position. The EPS of
Borrowers Company has also reduced from $3.30 to $2.50 that indicates poor position of
the company in the market in current year.
Although above ratios shows Company has stable liquidity position but poor profitability
position in the current year as compared to previous year made the financial position of the
3
company unfavorable. These ratios are not relevant for evaluating the debt worthiness of the
company.
B:
The three ratios that need to be calculated for analyzing the decision of the debt
worthiness are as follows:
Debt Equity Ratio: This ratio helps to know the level of debt against the shareholder
equity capital of the company. It will provide current level of debt and also shows
increase in debt level will change the capital structure to make it leveraged firm or not.
Interest Coverage Ratio: This ratio tells times the company can pay interest expenses on
the debt capital it is charge on the profitability of the company. This ratio will guide
whether company has enough profitability position to bear the increase in interest
expenses (Davies and Crawford, 2011).
Debt ratio: This ratio will provide information on level of debt capital used to finance
the total assets of the company.
C:
There are some drawbacks associated with the use of financial ratio analysis that limits
the application of technique in investing and credit decisions. The most significant limitation
associated with the use of ratio analysis technique is that it is not suitable to be used on a stand-
alone basis and the results obtained need to be benchmarked against some specific criteria such
as industry norm, aggregate economy and past performance. Also, it is not regarded to be a
useful technique for carrying out comparison of the financial performance of the companies that
differ on the basis of size and also belongs to different industry groups. The ratio analysis
sometimes does not provide an actual depiction of the financial performance of a company as the
financial statements are subjected to distortion by the economic and seasonal factors. In addition
to this, the use of different accounting methods and policies can provide uneven comparison of
the companies that belong to even same sectors. Also, there may be some good and some weak
financial ratios which make it difficult for investors to predict the future growth potential of the
company (Tracy, 2012).
⊘ This is a preview!⊘
Do you want full access?
Subscribe today to unlock all pages.
Trusted by 1+ million students worldwide
4
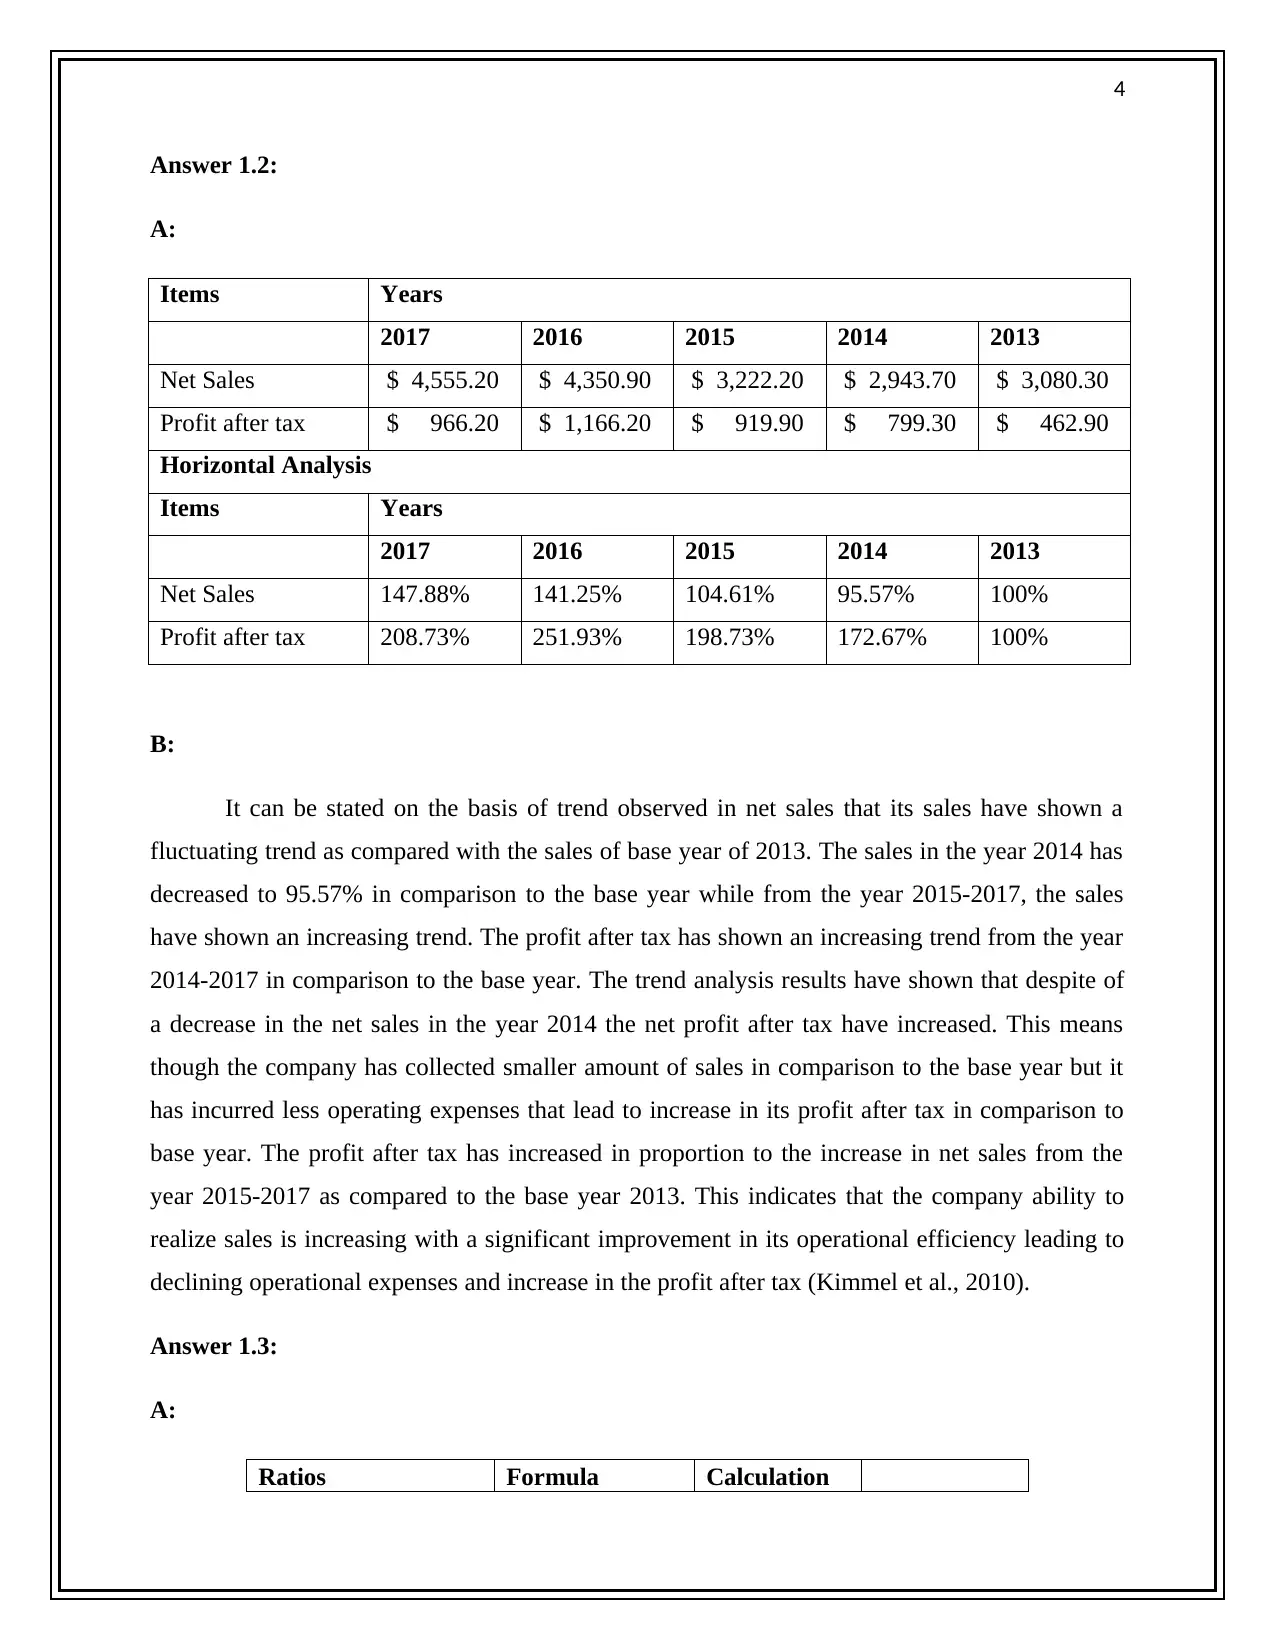
Answer 1.2:
A:
Items Years
2017 2016 2015 2014 2013
Net Sales $ 4,555.20 $ 4,350.90 $ 3,222.20 $ 2,943.70 $ 3,080.30
Profit after tax $ 966.20 $ 1,166.20 $ 919.90 $ 799.30 $ 462.90
Horizontal Analysis
Items Years
2017 2016 2015 2014 2013
Net Sales 147.88% 141.25% 104.61% 95.57% 100%
Profit after tax 208.73% 251.93% 198.73% 172.67% 100%
B:
It can be stated on the basis of trend observed in net sales that its sales have shown a
fluctuating trend as compared with the sales of base year of 2013. The sales in the year 2014 has
decreased to 95.57% in comparison to the base year while from the year 2015-2017, the sales
have shown an increasing trend. The profit after tax has shown an increasing trend from the year
2014-2017 in comparison to the base year. The trend analysis results have shown that despite of
a decrease in the net sales in the year 2014 the net profit after tax have increased. This means
though the company has collected smaller amount of sales in comparison to the base year but it
has incurred less operating expenses that lead to increase in its profit after tax in comparison to
base year. The profit after tax has increased in proportion to the increase in net sales from the
year 2015-2017 as compared to the base year 2013. This indicates that the company ability to
realize sales is increasing with a significant improvement in its operational efficiency leading to
declining operational expenses and increase in the profit after tax (Kimmel et al., 2010).
Answer 1.3:
A:
Ratios Formula Calculation
Paraphrase This Document
Need a fresh take? Get an instant paraphrase of this document with our AI Paraphraser
5
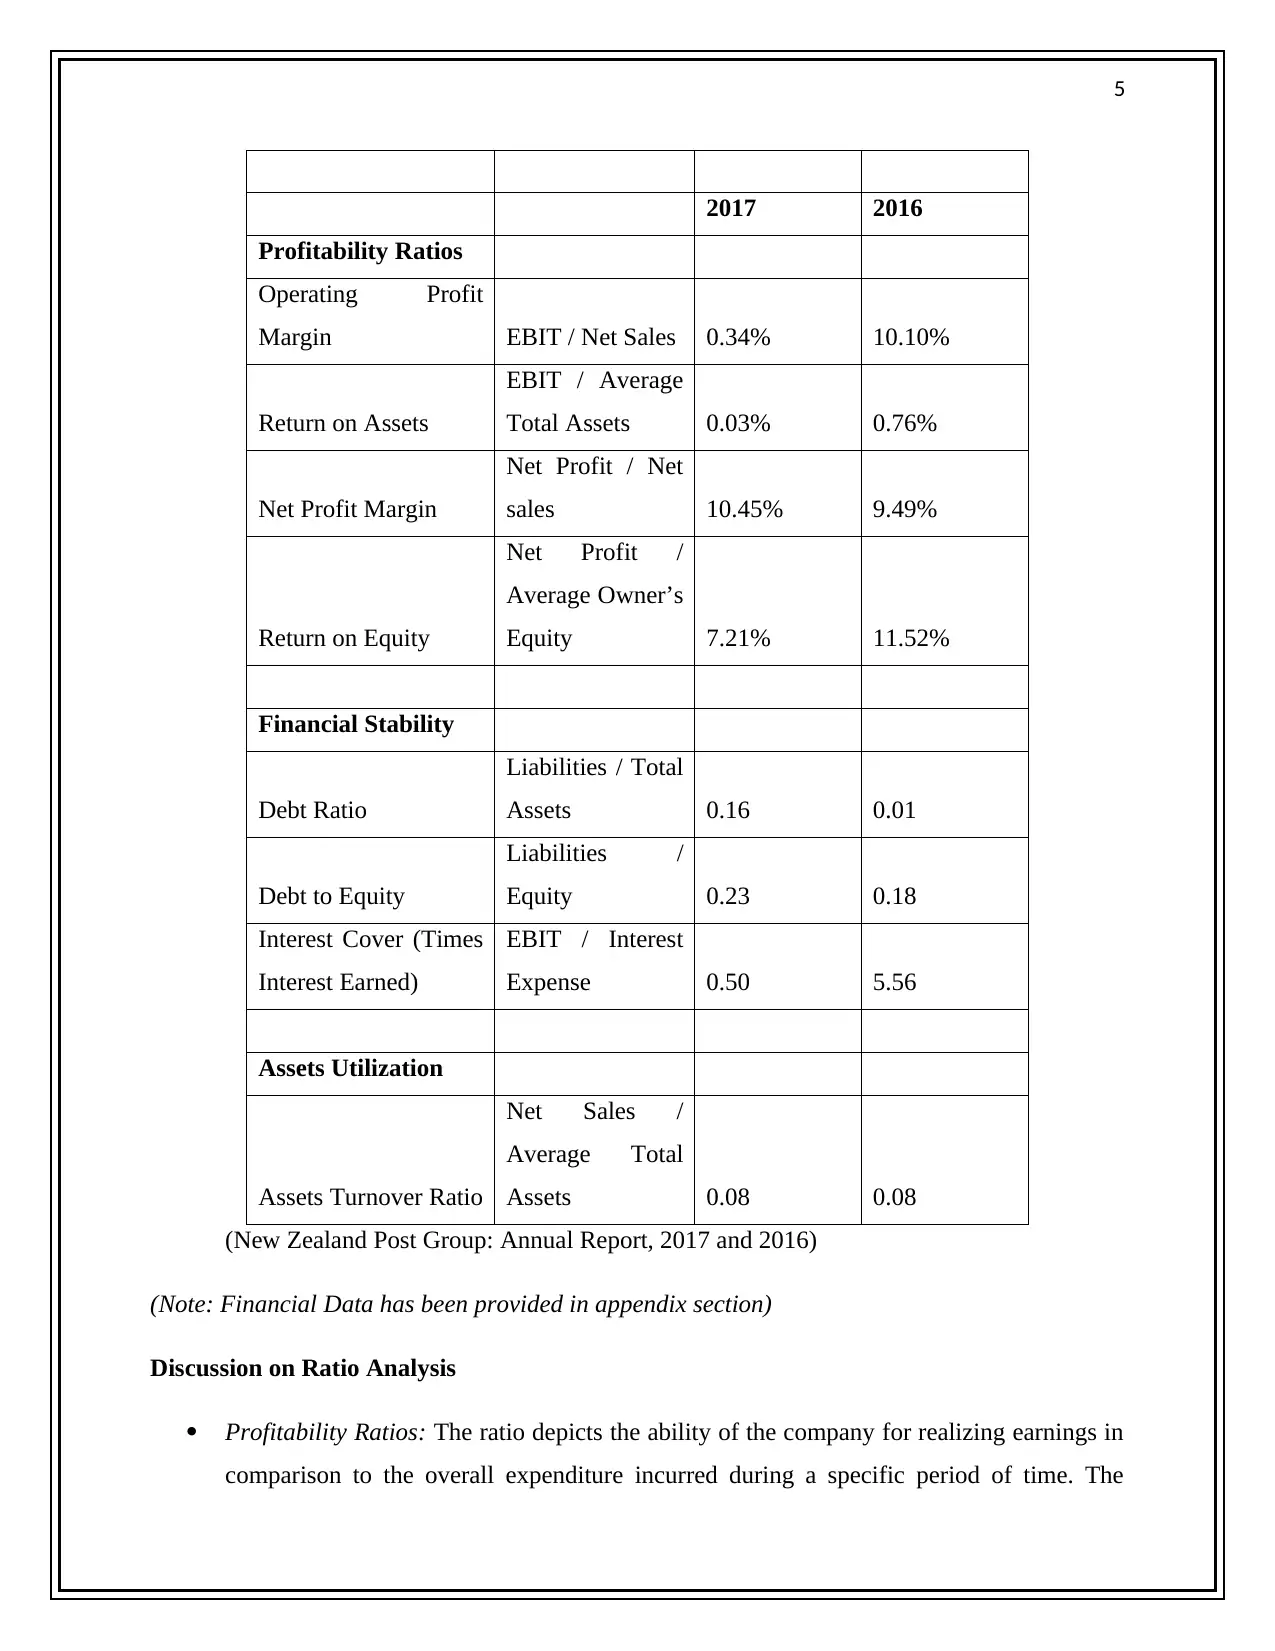
2017 2016
Profitability Ratios
Operating Profit
Margin EBIT / Net Sales 0.34% 10.10%
Return on Assets
EBIT / Average
Total Assets 0.03% 0.76%
Net Profit Margin
Net Profit / Net
sales 10.45% 9.49%
Return on Equity
Net Profit /
Average Owner’s
Equity 7.21% 11.52%
Financial Stability
Debt Ratio
Liabilities / Total
Assets 0.16 0.01
Debt to Equity
Liabilities /
Equity 0.23 0.18
Interest Cover (Times
Interest Earned)
EBIT / Interest
Expense 0.50 5.56
Assets Utilization
Assets Turnover Ratio
Net Sales /
Average Total
Assets 0.08 0.08
(New Zealand Post Group: Annual Report, 2017 and 2016)
(Note: Financial Data has been provided in appendix section)
Discussion on Ratio Analysis
Profitability Ratios: The ratio depicts the ability of the company for realizing earnings in
comparison to the overall expenditure incurred during a specific period of time. The
6
profitability position of New Zealand Post has been examined with the calculation of
following ratios:
Operating Profit Margin: It indicates the profit realized by the company after meeting its
variable cost of production. It is depicted from the calculation of the ratio from the above
table that its operating profit margin has decreased from 2016 to 2017 to a large extent.
Return on Assets: The return on assets ratio of the company has also comparatively
declined from 0.76% to 0.03% from the year 2016 to 2017 which depicts that its ability to
realize revenue from assets have decreased significantly (Lumby and Jones, 2007).
Net Profit Margin: Its net profit margin has increased significantly from 9.49% to 10.45%
in the year 206 to 2017. Thus, it indicates that the efficiency of New Zealand Post to
reduce its operational expenses has increased and this increases the percentage of revenue
available for the company after meeting all the significant expenses.
Return on Equity: The return on equity ratio of the company has decreased significantly
from 2016 to 2017 from 11.52% to 7.21%. This indicates that the ability of the company
to generate returns for the shareholders have reduced to a large extent (Tracy, 2012).
Financial Stability
Debt Ratio: The debt ratio of the company has increased from the year 2016 to 2017 as
depicted in the above table. This indicates that financial leverage on the company is
increasing.
Debt to Equity Ratio: The debt-equity ratio of the company has also increased over the
time period of 2016-2017 as presented in the above table. This indicates that company is
incorporating more debt in comparison to equity in the year 2017 as compared to the year
2016 (Moles and Kidwekk, 2011).
Interest Cover: The interest coverage ratio of the company has reduced to a large extent
from the year 2016 to 2017 as depicted in the above table. This indicates that the ability
of the company to meet its interest expenses on outstanding dent has reduced
(Szydlowska, 2018).
Assets Utilization
⊘ This is a preview!⊘
Do you want full access?
Subscribe today to unlock all pages.
Trusted by 1+ million students worldwide
7
Asset Turnover ratio: The company have maintained a steady growth rate over the year
2016-2017 in relation to asset turnover as depicted in the above table. This indicates that
the value of its sales in relation to the value of its assets has remained steady (Ross, Jaffe
and Kakani, 2008).
Thus, it can be stated on the basis of profitability analysis of the company that its profit
earning capacity has reduced in the year 2017 as compared to the year 2016. In addition to this,
the financial stability ratios have indicated that it is adopting more use of debt in its capital
structure which is not a good sign for the future growth of the company. Also, it is not able to
improve its efficiency of generating sales from asset utilization. This all indicates that the
financial health of the company has deteriorated in the year 2017 as compared to the year 2016.
This is also not indicative of good sign of potential growth of the company (Papadopoulos,
2011).
B:
Cash flow from operating activity ratio provides an overall assessment of the liquidity
position of a company. It is calculated by dividing the cash flow from operations by the current
liabilities that need to be repaid by the company within 1 year and is represented in the balance
sheet. Thus, if the operating cash flow ratio is greater than 1, it indicates that the company is
generating more cash from its business operations for meeting adequately its current liabilities in
the specified period and vice-versa. On the other hand, the earnings figure reflects the net profit
that indicates the actual profit that has been realized after meeting all the significant expenses of
operation, interest and taxes. Thus, if the cash flow from operations is less than the earnings
figure then the company might have a poor financial health. This is because it is not having
sufficient liquidity for meeting its current obligations although its accrued profit level might be
good (Weston and Brigham, 2015). This may indicate that the company is not highly effective in
meeting its current obligations due to its inefficiency in collecting its accounts receivables. The
business companies adopt the use of accrual basis of accounting and thus the earning figure
indicates the net profit to be realized by the company by taking into account the amount of
accounts receivables. Thus, if the cash flow from operations is less than the earning figure then
the company financial condition cannot be regarded as good as there is possibility of default o its
part as its credit obligations become due (White, 2014).
Paraphrase This Document
Need a fresh take? Get an instant paraphrase of this document with our AI Paraphraser

8
9
Solution 2: Application of management accounting tools to business decision making:
Budgeting
Answer 2.1:
A:
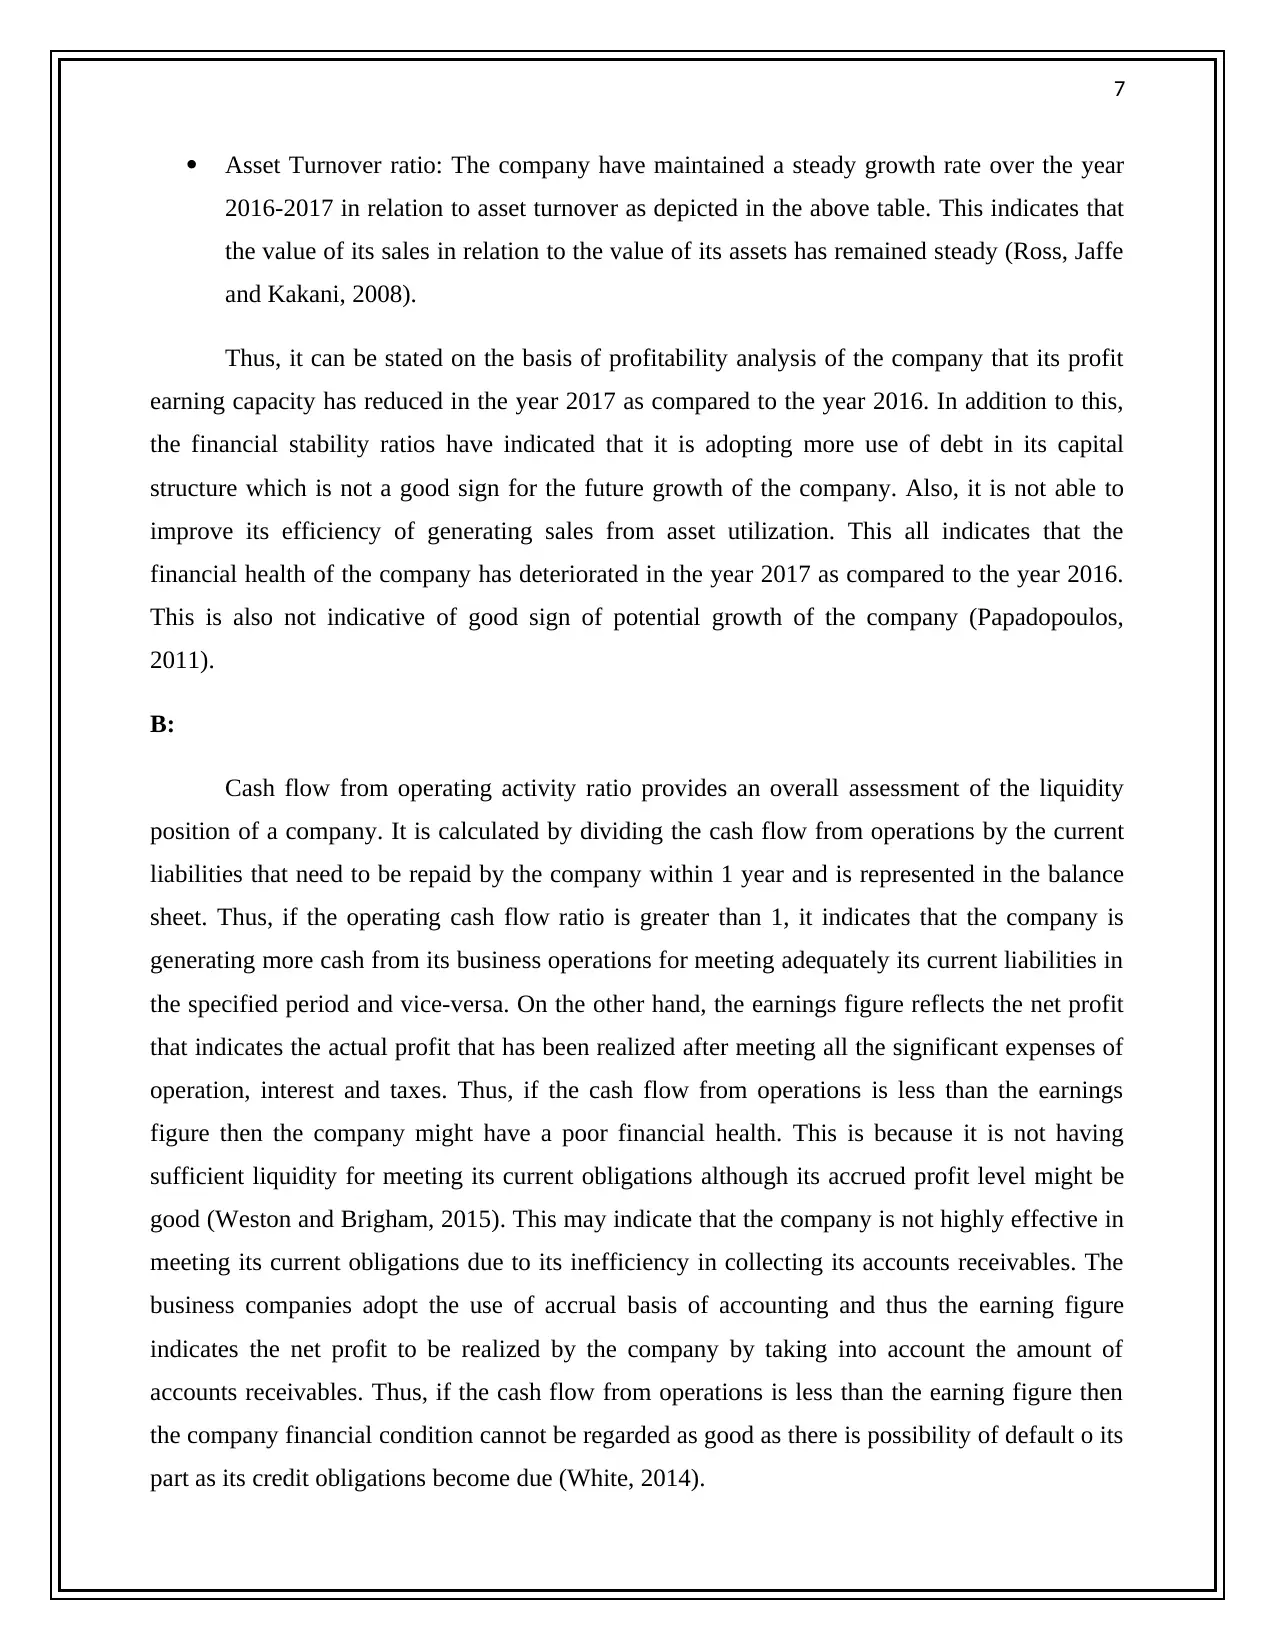
Schedule of expected cash receipts from debtors
Particulars Jan Feb
Estimated Sales
$
60,000.00
$
55,000.00
Cash Sales
$
18,000.00
$
16,500.00
Cash Remain to be Collected from Debtor
$
42,000.00
$
38,500.00
Cash Collected from debtor in same month (40%)
$
16,800.00
$
15,400.00
Cash Collected from debtor in next month (60%)
$
-
$
25,200.00
Total Receipts from debtors
$
16,800.00
$
40,600.00
B:
Cash Budget
Particulars Jan Feb
Cash Receipts
Cash Sales $ 18,000.00 $ 16,500.00
Collection from Debtors $ 16,800.00 $ 40,600.00
Total Cash Receipts $ 34,800.00 $ 57,100.00
Solution 2: Application of management accounting tools to business decision making:
Budgeting
Answer 2.1:
A:
Schedule of expected cash receipts from debtors
Particulars Jan Feb
Estimated Sales
$
60,000.00
$
55,000.00
Cash Sales
$
18,000.00
$
16,500.00
Cash Remain to be Collected from Debtor
$
42,000.00
$
38,500.00
Cash Collected from debtor in same month (40%)
$
16,800.00
$
15,400.00
Cash Collected from debtor in next month (60%)
$
-
$
25,200.00
Total Receipts from debtors
$
16,800.00
$
40,600.00
B:
Cash Budget
Particulars Jan Feb
Cash Receipts
Cash Sales $ 18,000.00 $ 16,500.00
Collection from Debtors $ 16,800.00 $ 40,600.00
Total Cash Receipts $ 34,800.00 $ 57,100.00
⊘ This is a preview!⊘
Do you want full access?
Subscribe today to unlock all pages.
Trusted by 1+ million students worldwide
10
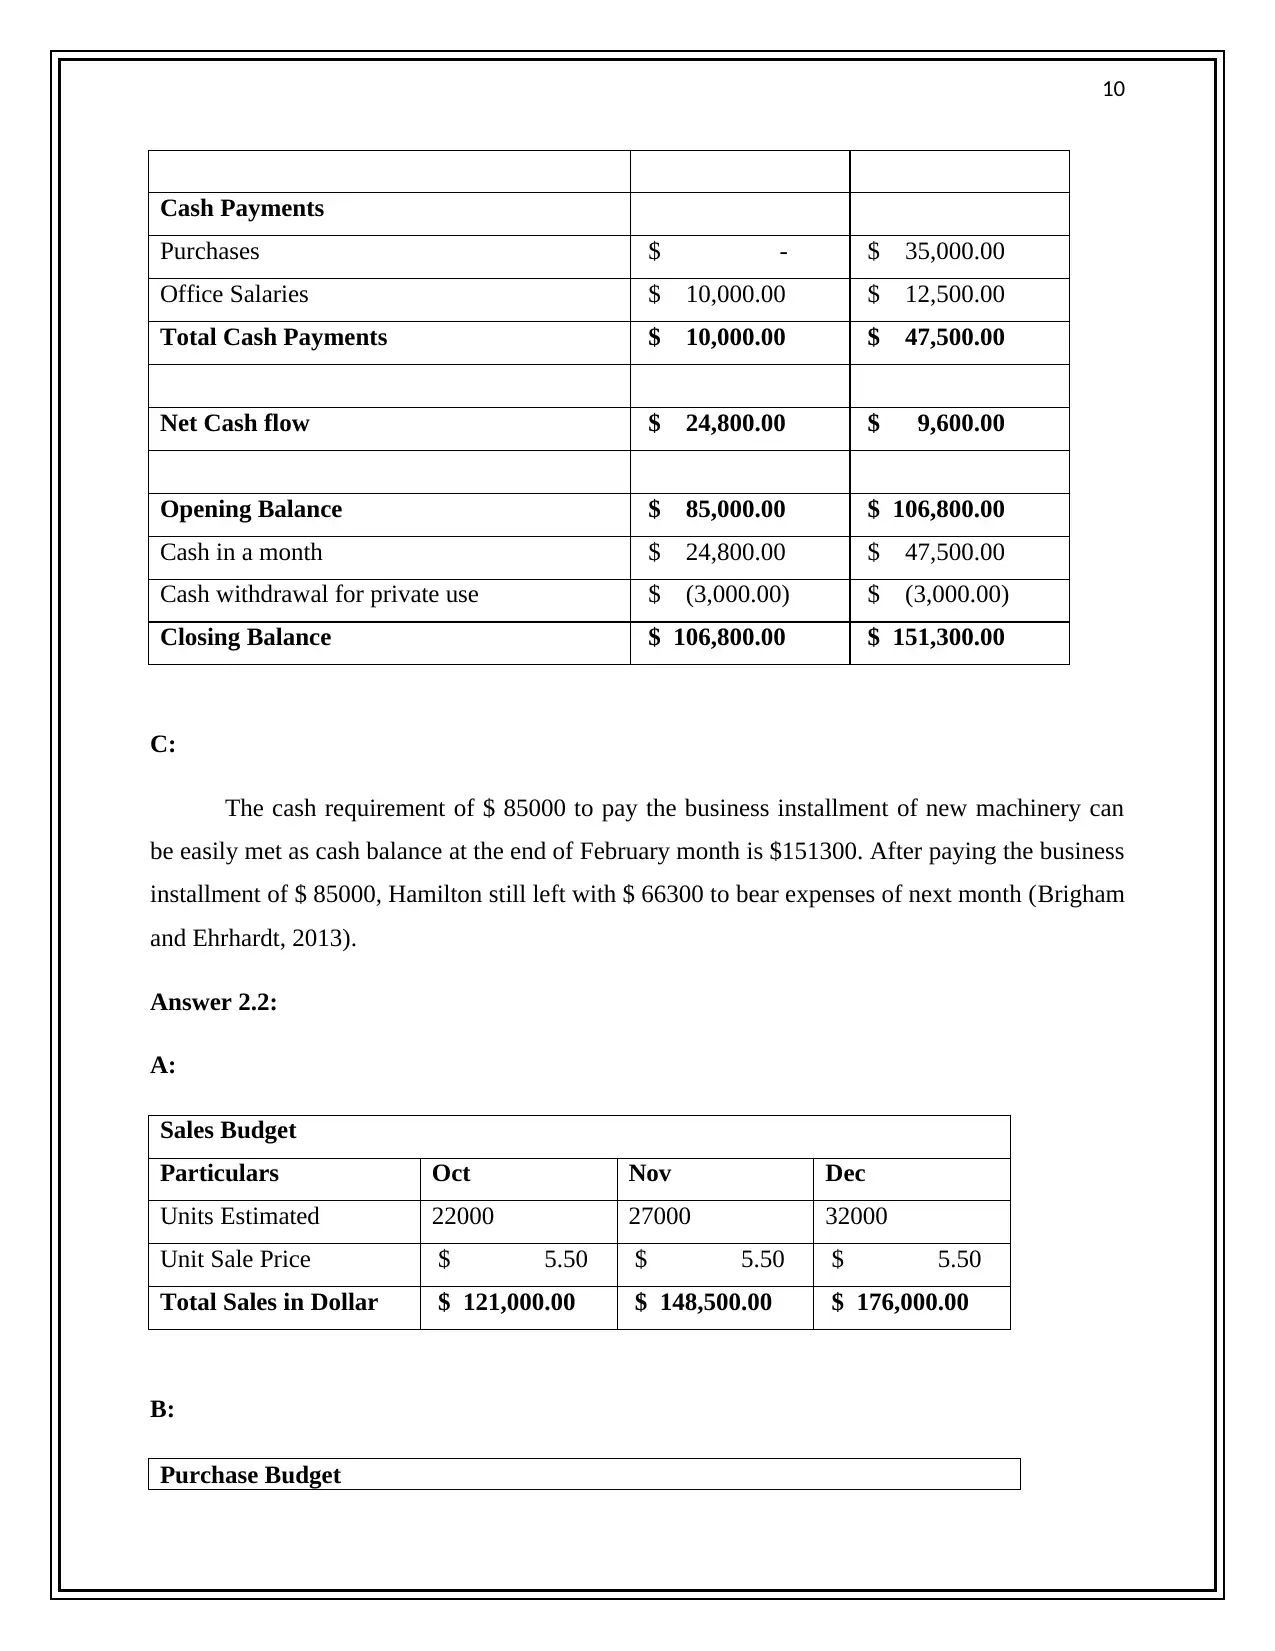
Cash Payments
Purchases $ - $ 35,000.00
Office Salaries $ 10,000.00 $ 12,500.00
Total Cash Payments $ 10,000.00 $ 47,500.00
Net Cash flow $ 24,800.00 $ 9,600.00
Opening Balance $ 85,000.00 $ 106,800.00
Cash in a month $ 24,800.00 $ 47,500.00
Cash withdrawal for private use $ (3,000.00) $ (3,000.00)
Closing Balance $ 106,800.00 $ 151,300.00
C:
The cash requirement of $ 85000 to pay the business installment of new machinery can
be easily met as cash balance at the end of February month is $151300. After paying the business
installment of $ 85000, Hamilton still left with $ 66300 to bear expenses of next month (Brigham
and Ehrhardt, 2013).
Answer 2.2:
A:
Sales Budget
Particulars Oct Nov Dec
Units Estimated 22000 27000 32000
Unit Sale Price $ 5.50 $ 5.50 $ 5.50
Total Sales in Dollar $ 121,000.00 $ 148,500.00 $ 176,000.00
B:
Purchase Budget
Paraphrase This Document
Need a fresh take? Get an instant paraphrase of this document with our AI Paraphraser
11
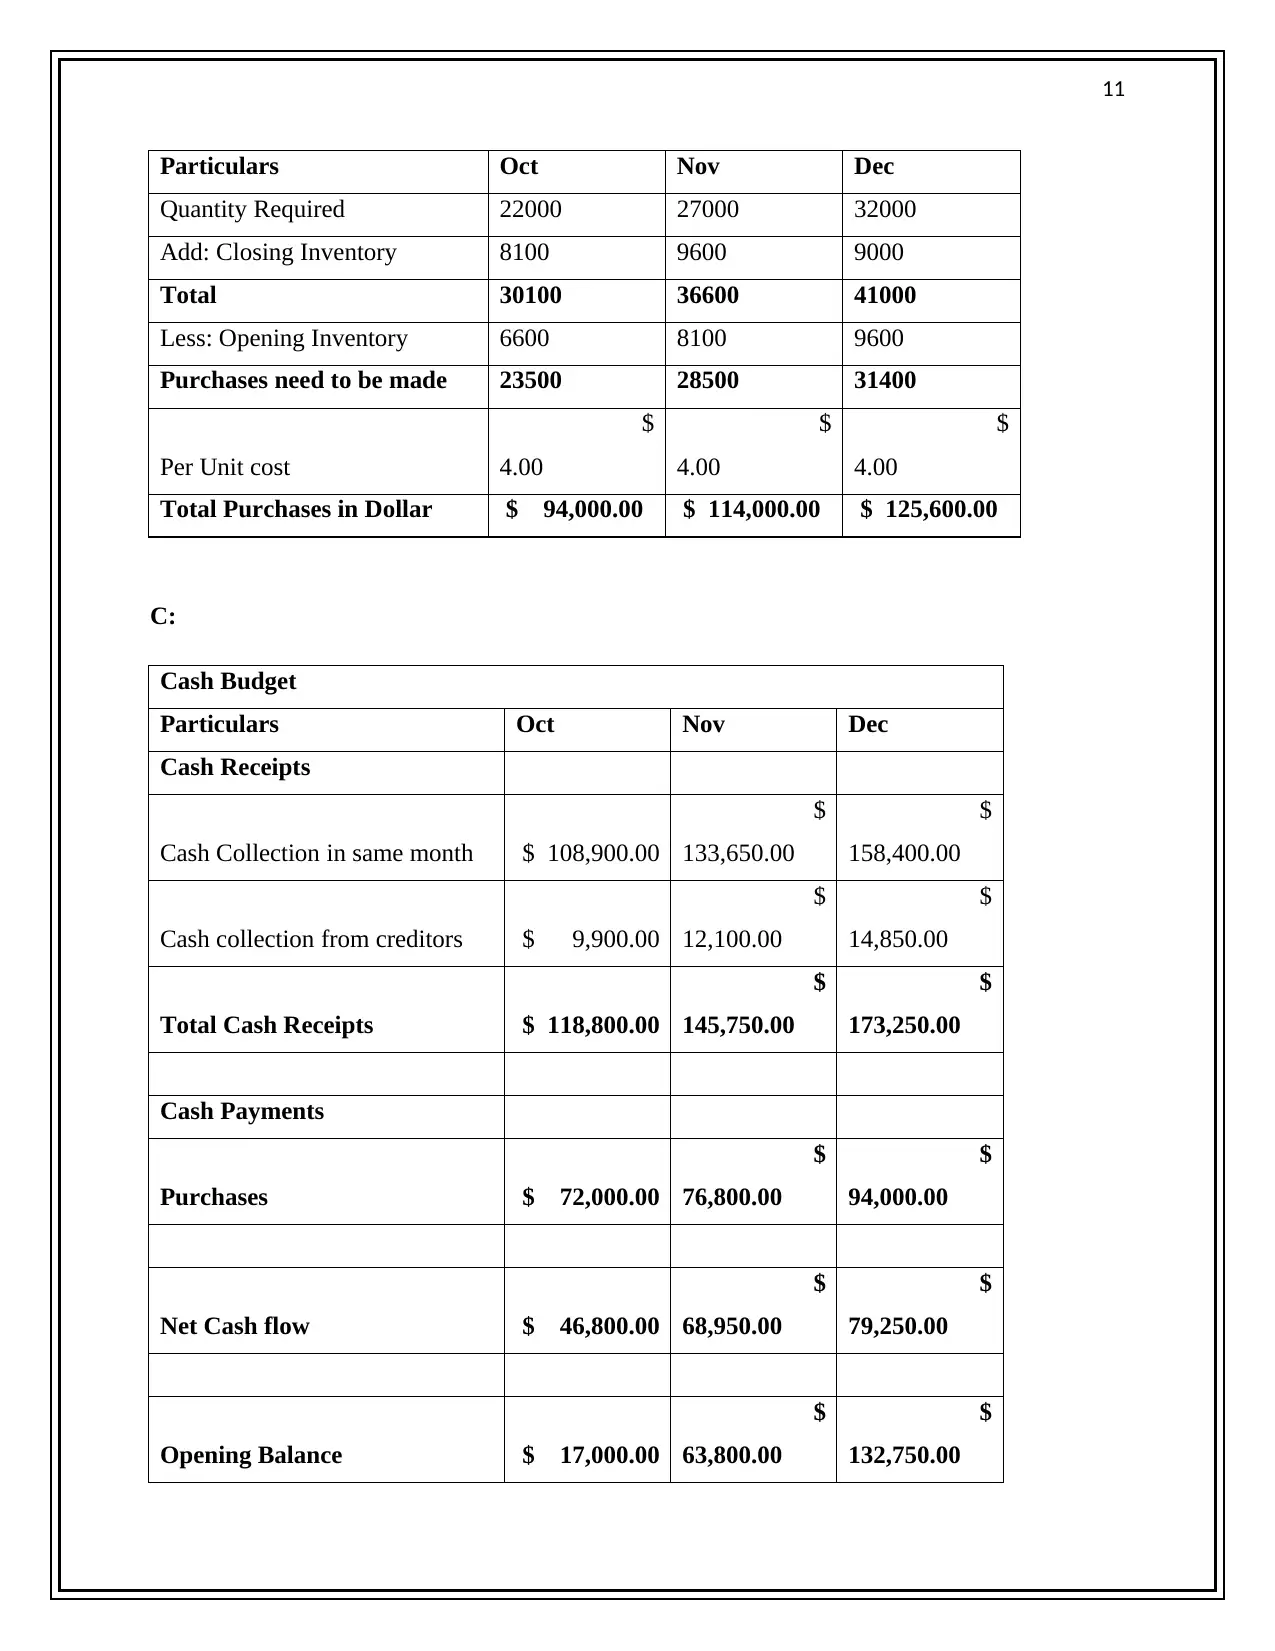
Particulars Oct Nov Dec
Quantity Required 22000 27000 32000
Add: Closing Inventory 8100 9600 9000
Total 30100 36600 41000
Less: Opening Inventory 6600 8100 9600
Purchases need to be made 23500 28500 31400
Per Unit cost
$
4.00
$
4.00
$
4.00
Total Purchases in Dollar $ 94,000.00 $ 114,000.00 $ 125,600.00
C:
Cash Budget
Particulars Oct Nov Dec
Cash Receipts
Cash Collection in same month $ 108,900.00
$
133,650.00
$
158,400.00
Cash collection from creditors $ 9,900.00
$
12,100.00
$
14,850.00
Total Cash Receipts $ 118,800.00
$
145,750.00
$
173,250.00
Cash Payments
Purchases $ 72,000.00
$
76,800.00
$
94,000.00
Net Cash flow $ 46,800.00
$
68,950.00
$
79,250.00
Opening Balance $ 17,000.00
$
63,800.00
$
132,750.00
Particulars Oct Nov Dec
Quantity Required 22000 27000 32000
Add: Closing Inventory 8100 9600 9000
Total 30100 36600 41000
Less: Opening Inventory 6600 8100 9600
Purchases need to be made 23500 28500 31400
Per Unit cost
$
4.00
$
4.00
$
4.00
Total Purchases in Dollar $ 94,000.00 $ 114,000.00 $ 125,600.00
C:
Cash Budget
Particulars Oct Nov Dec
Cash Receipts
Cash Collection in same month $ 108,900.00
$
133,650.00
$
158,400.00
Cash collection from creditors $ 9,900.00
$
12,100.00
$
14,850.00
Total Cash Receipts $ 118,800.00
$
145,750.00
$
173,250.00
Cash Payments
Purchases $ 72,000.00
$
76,800.00
$
94,000.00
Net Cash flow $ 46,800.00
$
68,950.00
$
79,250.00
Opening Balance $ 17,000.00
$
63,800.00
$
132,750.00
12
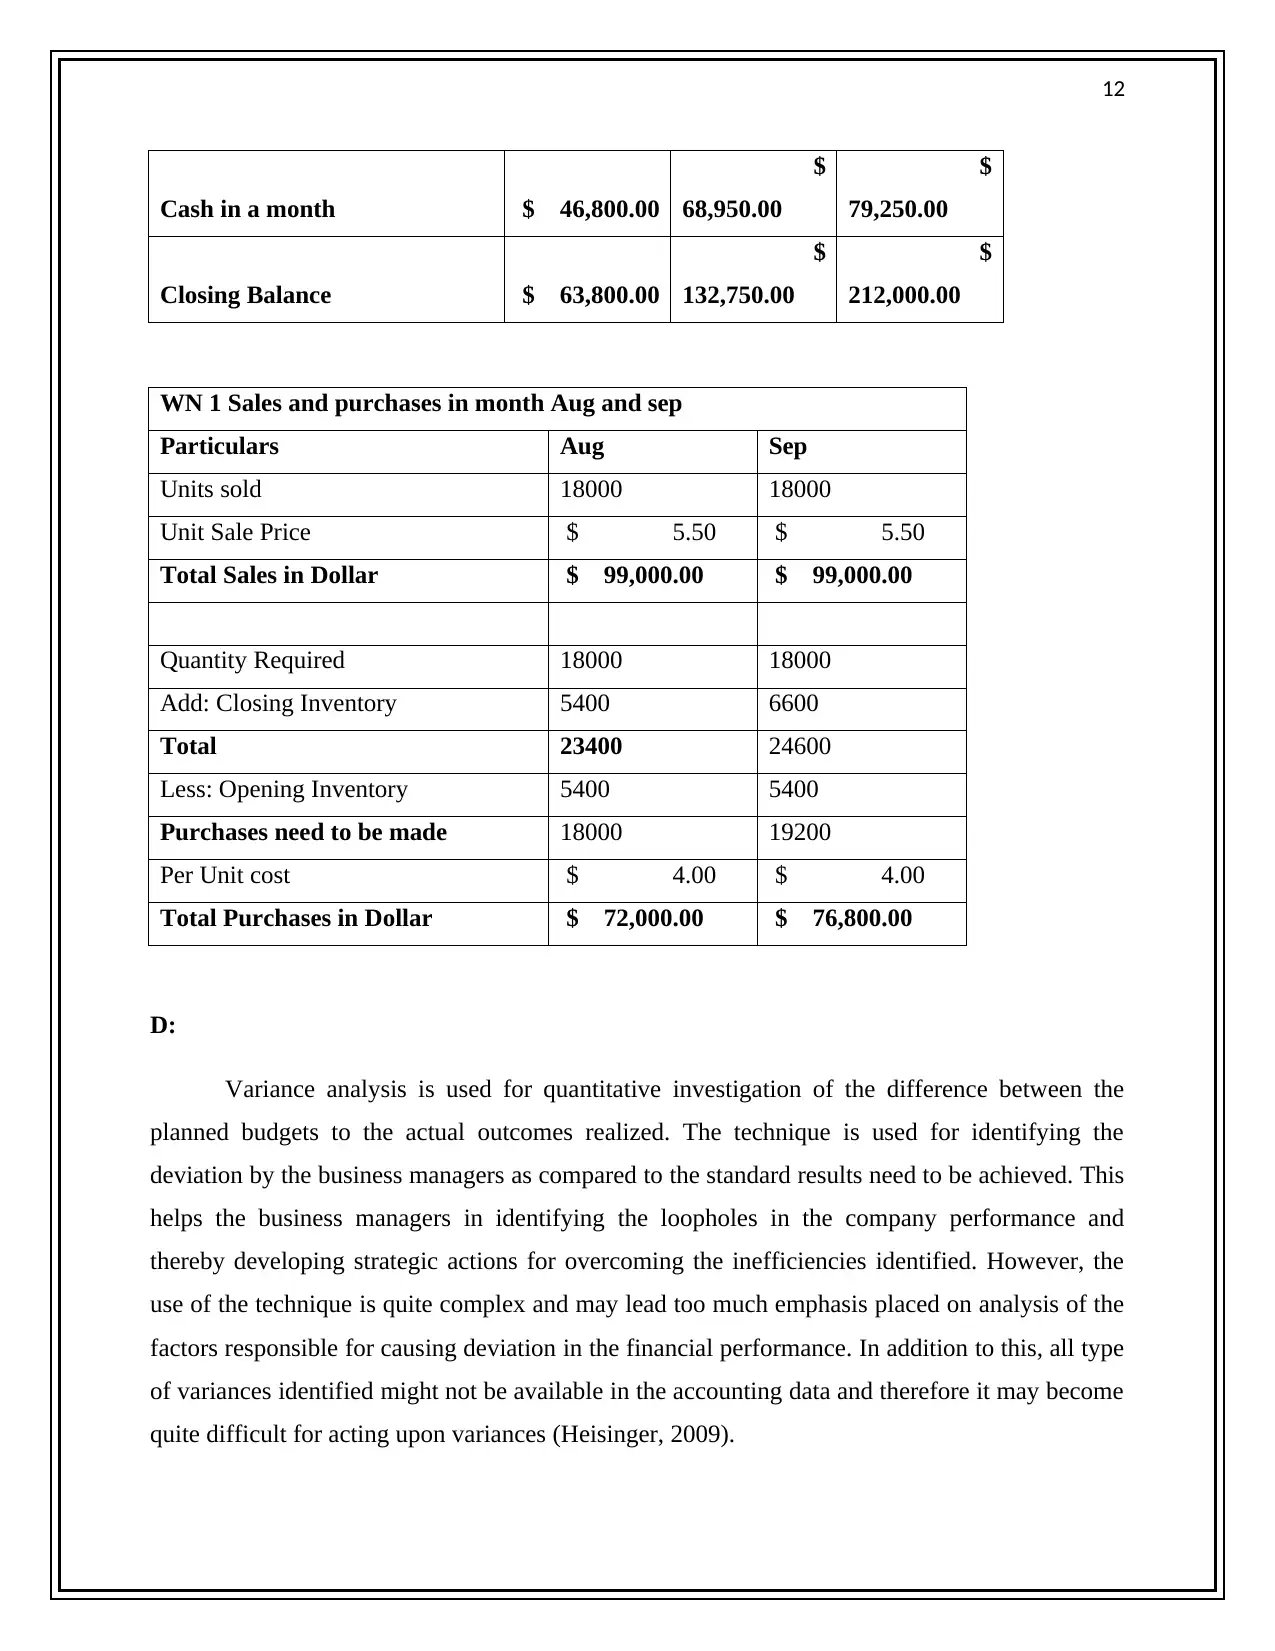
Cash in a month $ 46,800.00
$
68,950.00
$
79,250.00
Closing Balance $ 63,800.00
$
132,750.00
$
212,000.00
WN 1 Sales and purchases in month Aug and sep
Particulars Aug Sep
Units sold 18000 18000
Unit Sale Price $ 5.50 $ 5.50
Total Sales in Dollar $ 99,000.00 $ 99,000.00
Quantity Required 18000 18000
Add: Closing Inventory 5400 6600
Total 23400 24600
Less: Opening Inventory 5400 5400
Purchases need to be made 18000 19200
Per Unit cost $ 4.00 $ 4.00
Total Purchases in Dollar $ 72,000.00 $ 76,800.00
D:
Variance analysis is used for quantitative investigation of the difference between the
planned budgets to the actual outcomes realized. The technique is used for identifying the
deviation by the business managers as compared to the standard results need to be achieved. This
helps the business managers in identifying the loopholes in the company performance and
thereby developing strategic actions for overcoming the inefficiencies identified. However, the
use of the technique is quite complex and may lead too much emphasis placed on analysis of the
factors responsible for causing deviation in the financial performance. In addition to this, all type
of variances identified might not be available in the accounting data and therefore it may become
quite difficult for acting upon variances (Heisinger, 2009).
⊘ This is a preview!⊘
Do you want full access?
Subscribe today to unlock all pages.
Trusted by 1+ million students worldwide
1 out of 15
Related Documents


Your All-in-One AI-Powered Toolkit for Academic Success.
+13062052269
info@desklib.com
Available 24*7 on WhatsApp / Email
![[object Object]](/_next/static/media/star-bottom.7253800d.svg)
Unlock your academic potential
Copyright © 2020–2026 A2Z Services. All Rights Reserved. Developed and managed by ZUCOL.