Financial Analysis Report: Spotless Group Holdings vs. Compass
VerifiedAdded on 2022/08/21
|17
|3273
|15
Report
AI Summary
This report presents a comprehensive financial analysis of Spotless Group Holdings, examining its financial performance using ratio analysis, horizontal analysis, and vertical analysis. The analysis includes profitability, liquidity, efficiency, and solvency ratios, comparing Spotless to its competitor, Compass. The report highlights Spotless's challenges in generating profit compared to Compass, suggesting improvements like changing funding sources. The horizontal analysis reveals revenue and profit trends, while the vertical analysis provides a percentage breakdown of the income statement and balance sheet. The study provides valuable insights into Spotless's financial health, emphasizing areas for improvement and strategic recommendations for enhancing its financial position.

Financial Statement Analysis
Paraphrase This Document
Need a fresh take? Get an instant paraphrase of this document with our AI Paraphraser
Finance 1
Executive Summary
The main objective of this report is to discuss the concept of financial analysis. Financial
analysis is the procedure of measuring the financial situation. Ratio analysis, horizontal analysis,
and vertical analysis are the financial analysis tools those are used by the company to evaluate
the financial statement. As per the analysis, it is observed that Spotless has to improve its
financial situation as its competitor (Compass) has strong financial position. Spotless has less
capability to generate the profit as compare to the competitors due to which it faces the
challenges in financially terms. It is recommended that the company has to change its sources of
funds such as it has issue the share instead of borrowing money.
Finance 2
Contents
Introduction.................................................................................................................................................2
Ratio Analysis.............................................................................................................................................2
Horizontal Analysis.....................................................................................................................................8
Vertical Analysis.......................................................................................................................................10
Comparison Analysis.................................................................................................................................11
Recommendation.......................................................................................................................................12
Conclusion.................................................................................................................................................12
References.................................................................................................................................................14
⊘ This is a preview!⊘
Do you want full access?
Subscribe today to unlock all pages.
Trusted by 1+ million students worldwide
Finance 3
Introduction
Financial analysis is the procedure of assessing the financial situation of the firm by
determining the firm budgets and the other financing activities. It is necessary for the
organization to assess the financial situation with the motive to take financial decision in an
effective manner. There are numerous ways those are used to examine the financial statements
such as ratio analysis, trend analysis, horizontal analysis and the others (Robinson, Henry, Pirie,
& Broihahn, 2015). The method and methods are can be adopted on the historical data of the
firm those are recorded in financial statements with the motive to compare its performance from
last years. In this paper, the discussion is made on the topic of “financial analysis”. Spotless has
been taken into consideration to estimate the financial situation in the market. In this paper, the
financial position of the firm will be discussed by using different techniques, tools to calculate
the financial statements.
Spotless Group Holding is an Australian company that operates the business in various fields as
it offers the integrated facility services. It offers the Health, education and government,
Commercial and leisure, Catering food services, Laundry and linen, Base and township services
to consumers. It operates the business in Australia and New Zealand with the 36000 number of
employees. It was established in the year 1957. As per its history, acquisition is the strategy from
which they achieve the objective and success in business. Compass is also one of the competitors
of the company in terms of serving the food to consumers (Spotless, 2019a).
Ratio Analysis
Ratio's
Paraphrase This Document
Need a fresh take? Get an instant paraphrase of this document with our AI Paraphraser
Finance 4
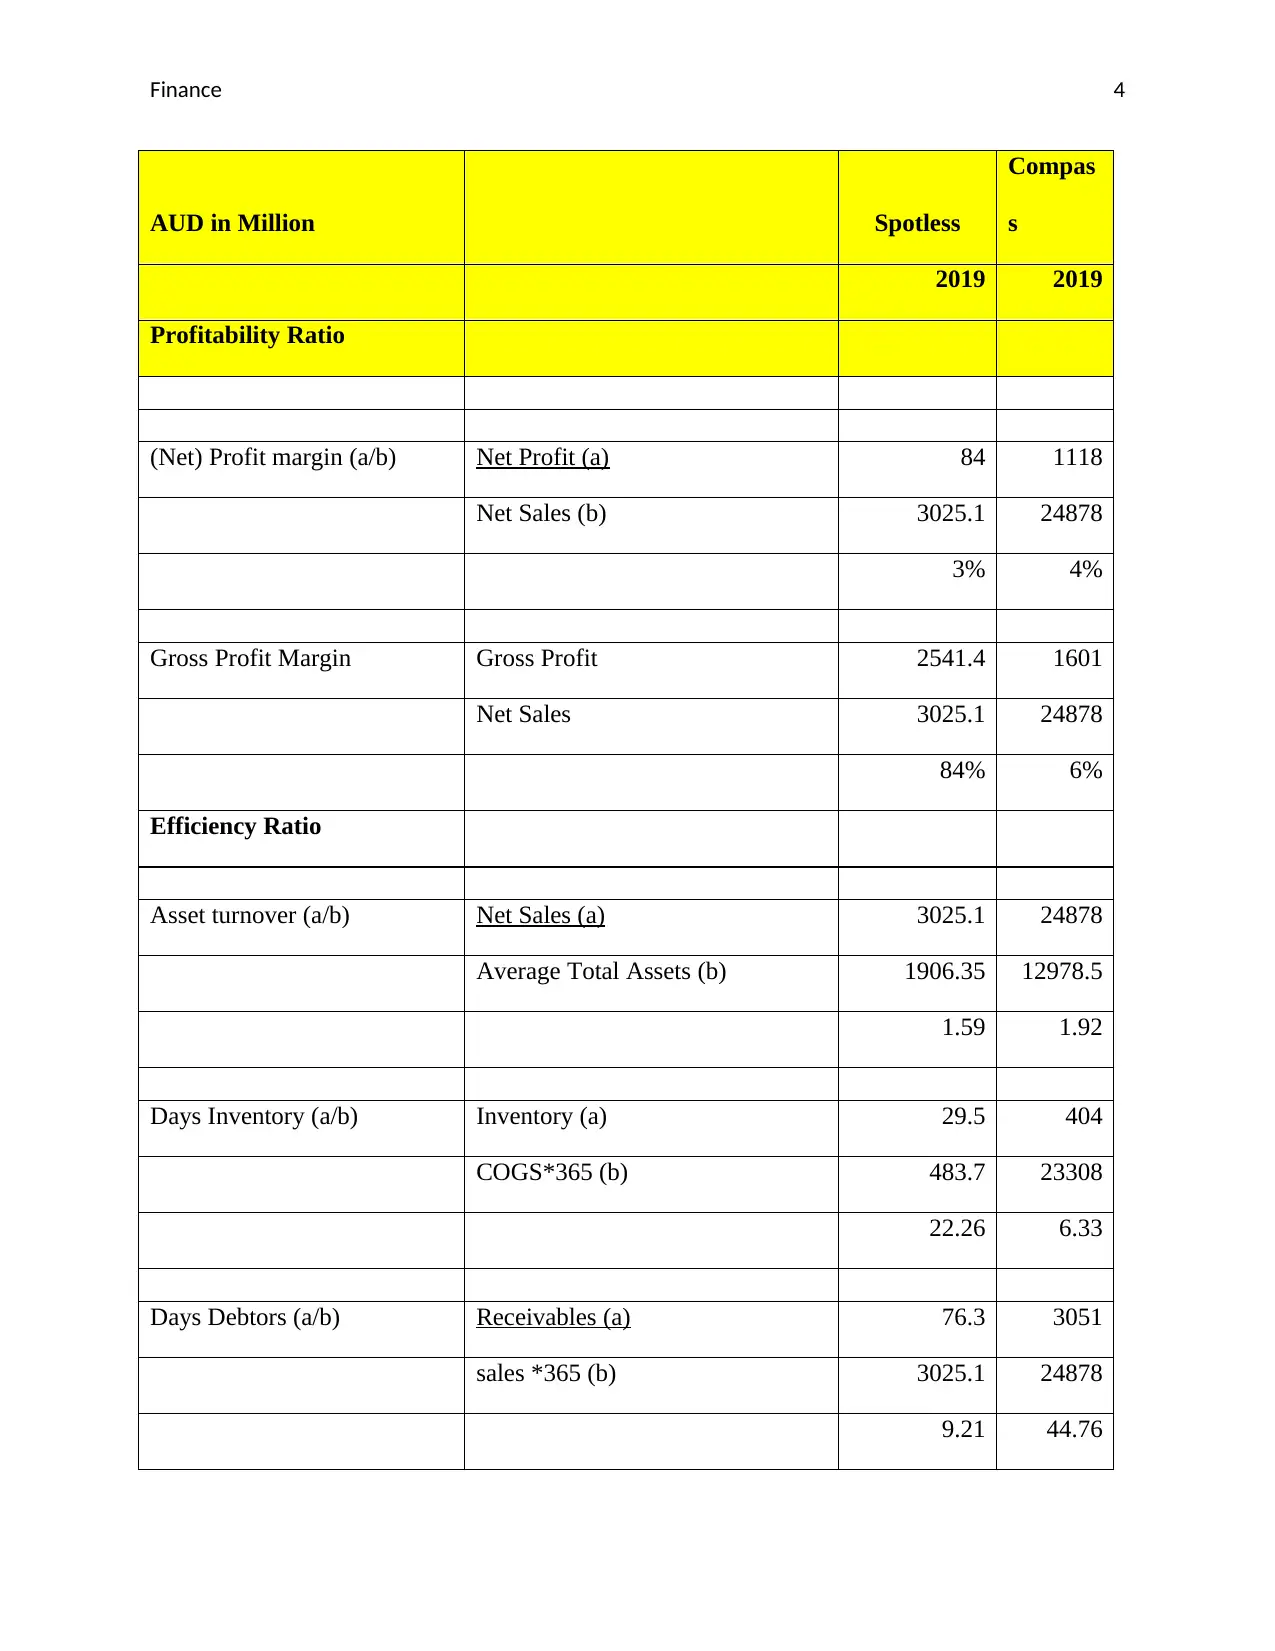
AUD in Million Spotless
Compas
s
2019 2019
Profitability Ratio
(Net) Profit margin (a/b) Net Profit (a) 84 1118
Net Sales (b) 3025.1 24878
3% 4%
Gross Profit Margin Gross Profit 2541.4 1601
Net Sales 3025.1 24878
84% 6%
Efficiency Ratio
Asset turnover (a/b) Net Sales (a) 3025.1 24878
Average Total Assets (b) 1906.35 12978.5
1.59 1.92
Days Inventory (a/b) Inventory (a) 29.5 404
COGS*365 (b) 483.7 23308
22.26 6.33
Days Debtors (a/b) Receivables (a) 76.3 3051
sales *365 (b) 3025.1 24878
9.21 44.76
Finance 5
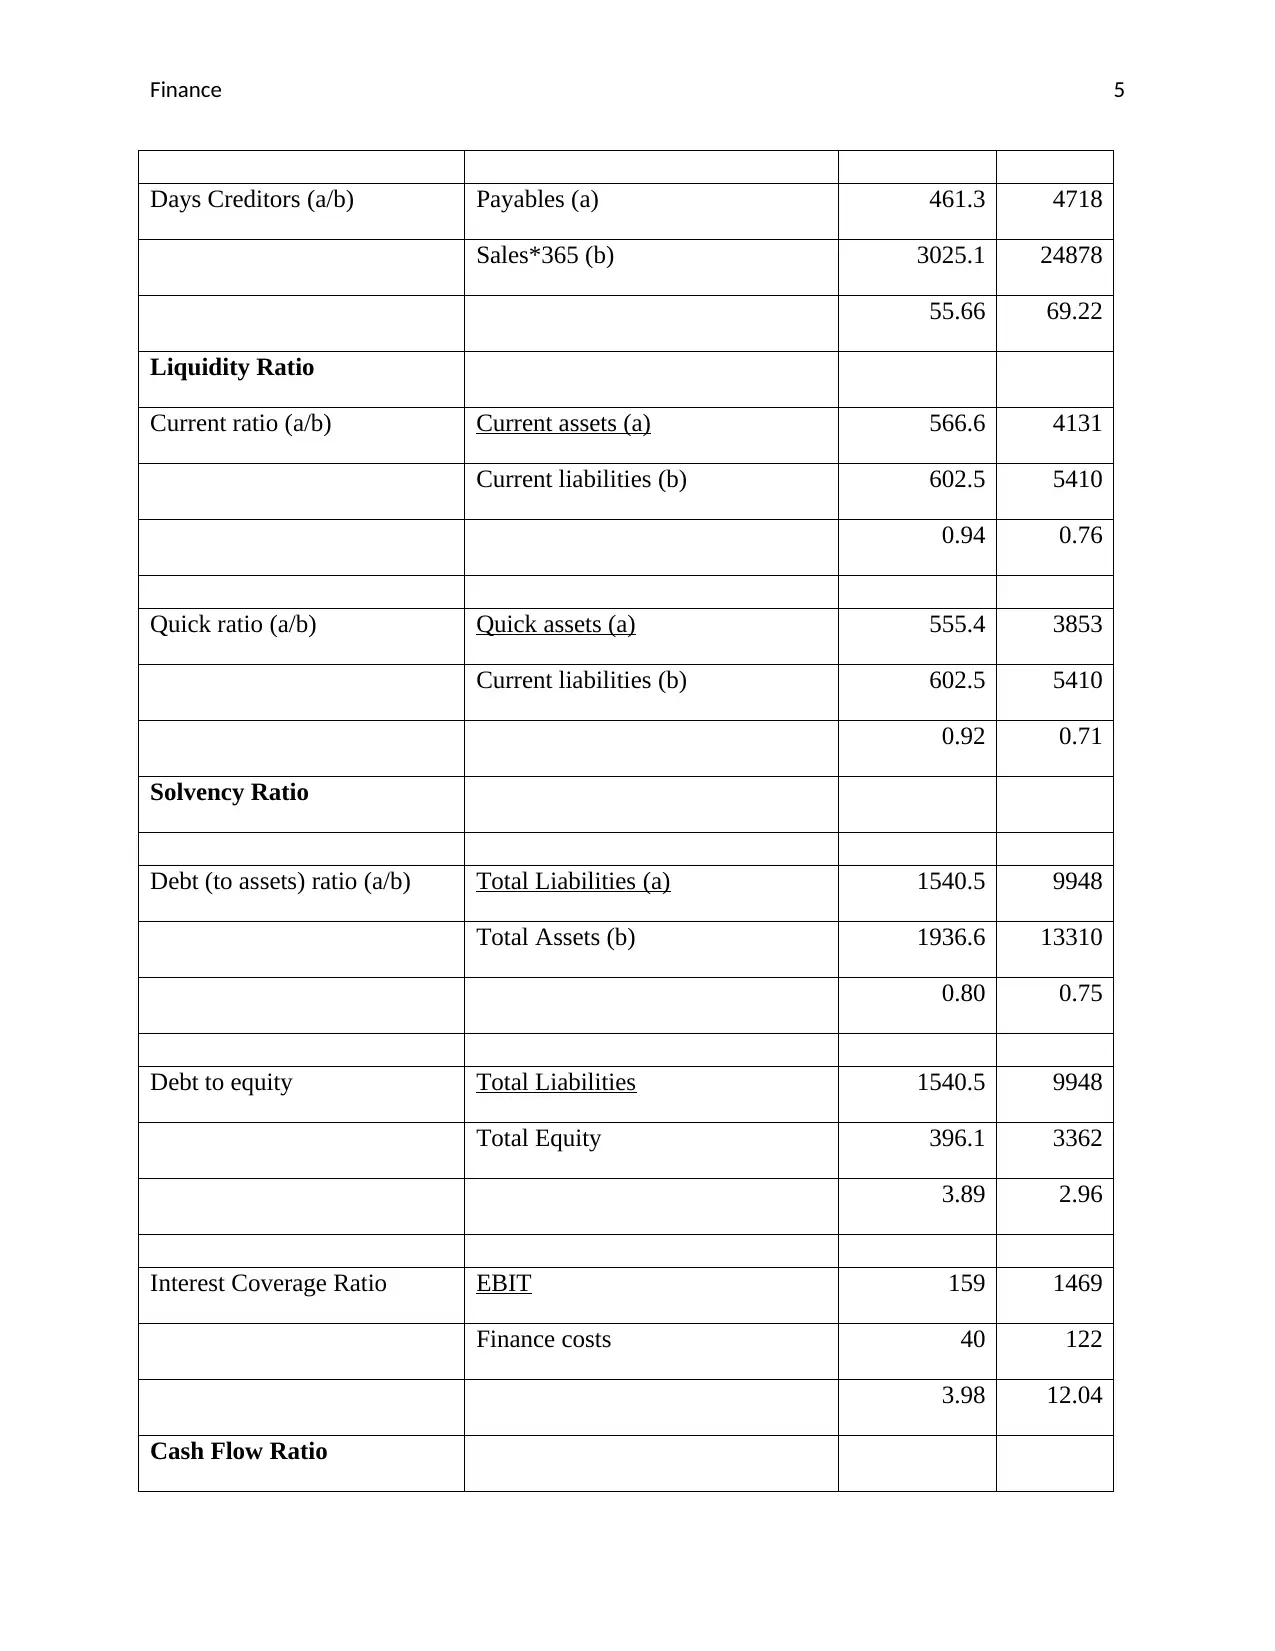
Days Creditors (a/b) Payables (a) 461.3 4718
Sales*365 (b) 3025.1 24878
55.66 69.22
Liquidity Ratio
Current ratio (a/b) Current assets (a) 566.6 4131
Current liabilities (b) 602.5 5410
0.94 0.76
Quick ratio (a/b) Quick assets (a) 555.4 3853
Current liabilities (b) 602.5 5410
0.92 0.71
Solvency Ratio
Debt (to assets) ratio (a/b) Total Liabilities (a) 1540.5 9948
Total Assets (b) 1936.6 13310
0.80 0.75
Debt to equity Total Liabilities 1540.5 9948
Total Equity 396.1 3362
3.89 2.96
Interest Coverage Ratio EBIT 159 1469
Finance costs 40 122
3.98 12.04
Cash Flow Ratio
⊘ This is a preview!⊘
Do you want full access?
Subscribe today to unlock all pages.
Trusted by 1+ million students worldwide
Finance 6
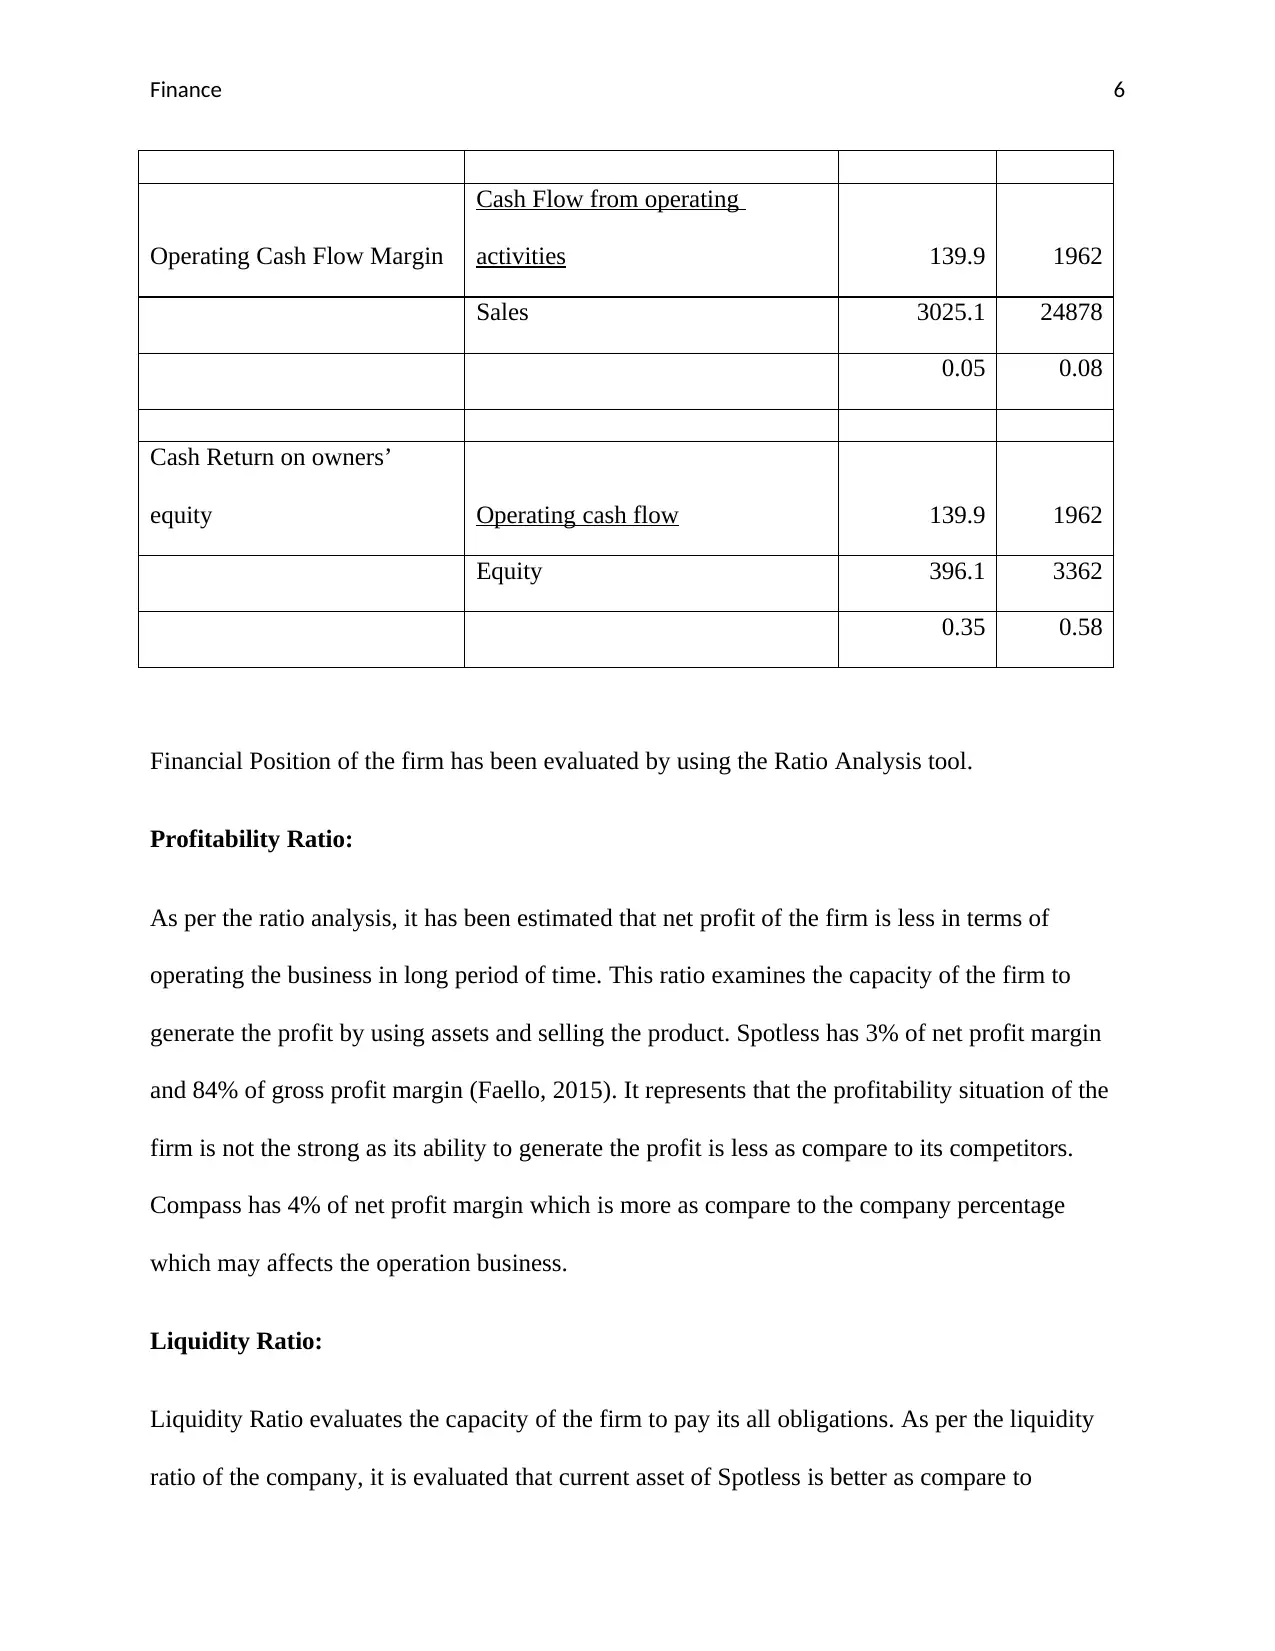
Operating Cash Flow Margin
Cash Flow from operating
activities 139.9 1962
Sales 3025.1 24878
0.05 0.08
Cash Return on owners’
equity Operating cash flow 139.9 1962
Equity 396.1 3362
0.35 0.58
Financial Position of the firm has been evaluated by using the Ratio Analysis tool.
Profitability Ratio:
As per the ratio analysis, it has been estimated that net profit of the firm is less in terms of
operating the business in long period of time. This ratio examines the capacity of the firm to
generate the profit by using assets and selling the product. Spotless has 3% of net profit margin
and 84% of gross profit margin (Faello, 2015). It represents that the profitability situation of the
firm is not the strong as its ability to generate the profit is less as compare to its competitors.
Compass has 4% of net profit margin which is more as compare to the company percentage
which may affects the operation business.
Liquidity Ratio:
Liquidity Ratio evaluates the capacity of the firm to pay its all obligations. As per the liquidity
ratio of the company, it is evaluated that current asset of Spotless is better as compare to
Paraphrase This Document
Need a fresh take? Get an instant paraphrase of this document with our AI Paraphraser
Finance 7
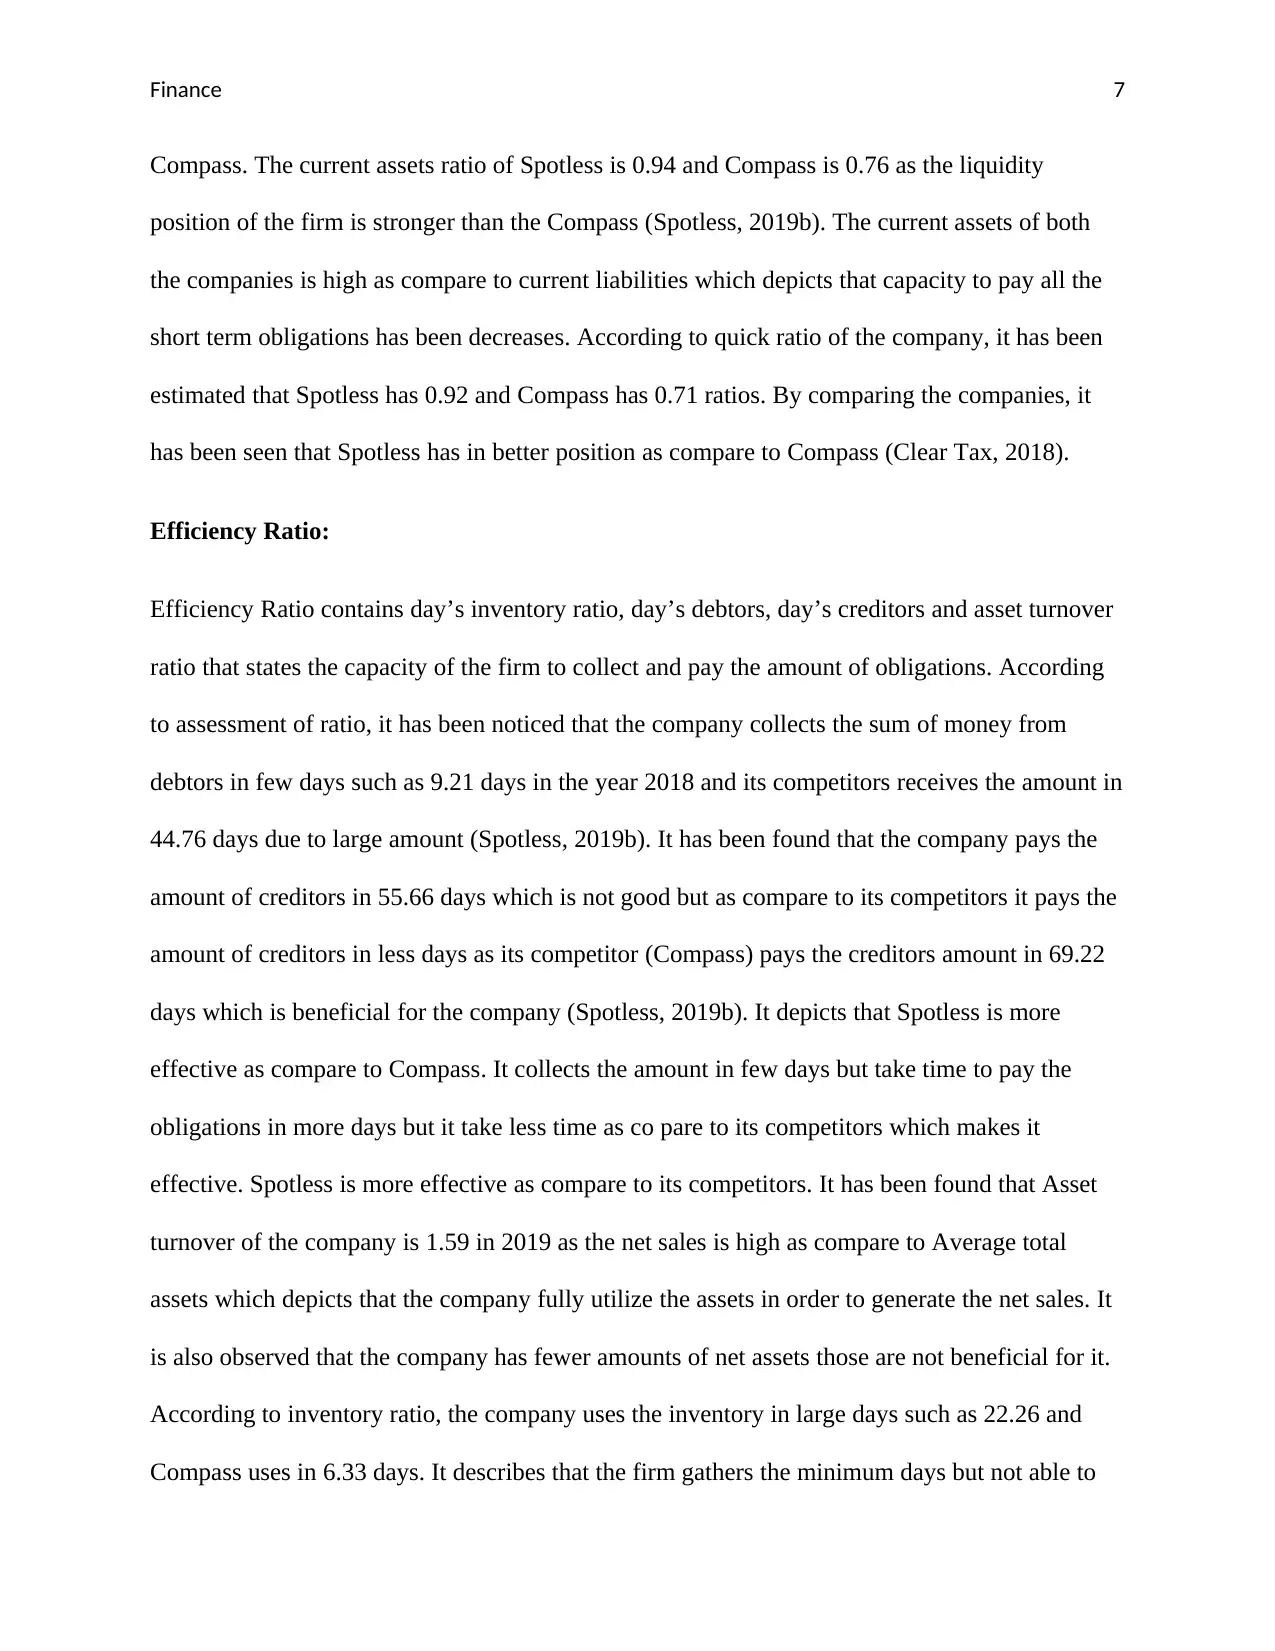
Compass. The current assets ratio of Spotless is 0.94 and Compass is 0.76 as the liquidity
position of the firm is stronger than the Compass (Spotless, 2019b). The current assets of both
the companies is high as compare to current liabilities which depicts that capacity to pay all the
short term obligations has been decreases. According to quick ratio of the company, it has been
estimated that Spotless has 0.92 and Compass has 0.71 ratios. By comparing the companies, it
has been seen that Spotless has in better position as compare to Compass (Clear Tax, 2018).
Efficiency Ratio:
Efficiency Ratio contains day’s inventory ratio, day’s debtors, day’s creditors and asset turnover
ratio that states the capacity of the firm to collect and pay the amount of obligations. According
to assessment of ratio, it has been noticed that the company collects the sum of money from
debtors in few days such as 9.21 days in the year 2018 and its competitors receives the amount in
44.76 days due to large amount (Spotless, 2019b). It has been found that the company pays the
amount of creditors in 55.66 days which is not good but as compare to its competitors it pays the
amount of creditors in less days as its competitor (Compass) pays the creditors amount in 69.22
days which is beneficial for the company (Spotless, 2019b). It depicts that Spotless is more
effective as compare to Compass. It collects the amount in few days but take time to pay the
obligations in more days but it take less time as co pare to its competitors which makes it
effective. Spotless is more effective as compare to its competitors. It has been found that Asset
turnover of the company is 1.59 in 2019 as the net sales is high as compare to Average total
assets which depicts that the company fully utilize the assets in order to generate the net sales. It
is also observed that the company has fewer amounts of net assets those are not beneficial for it.
According to inventory ratio, the company uses the inventory in large days such as 22.26 and
Compass uses in 6.33 days. It describes that the firm gathers the minimum days but not able to
Finance 8
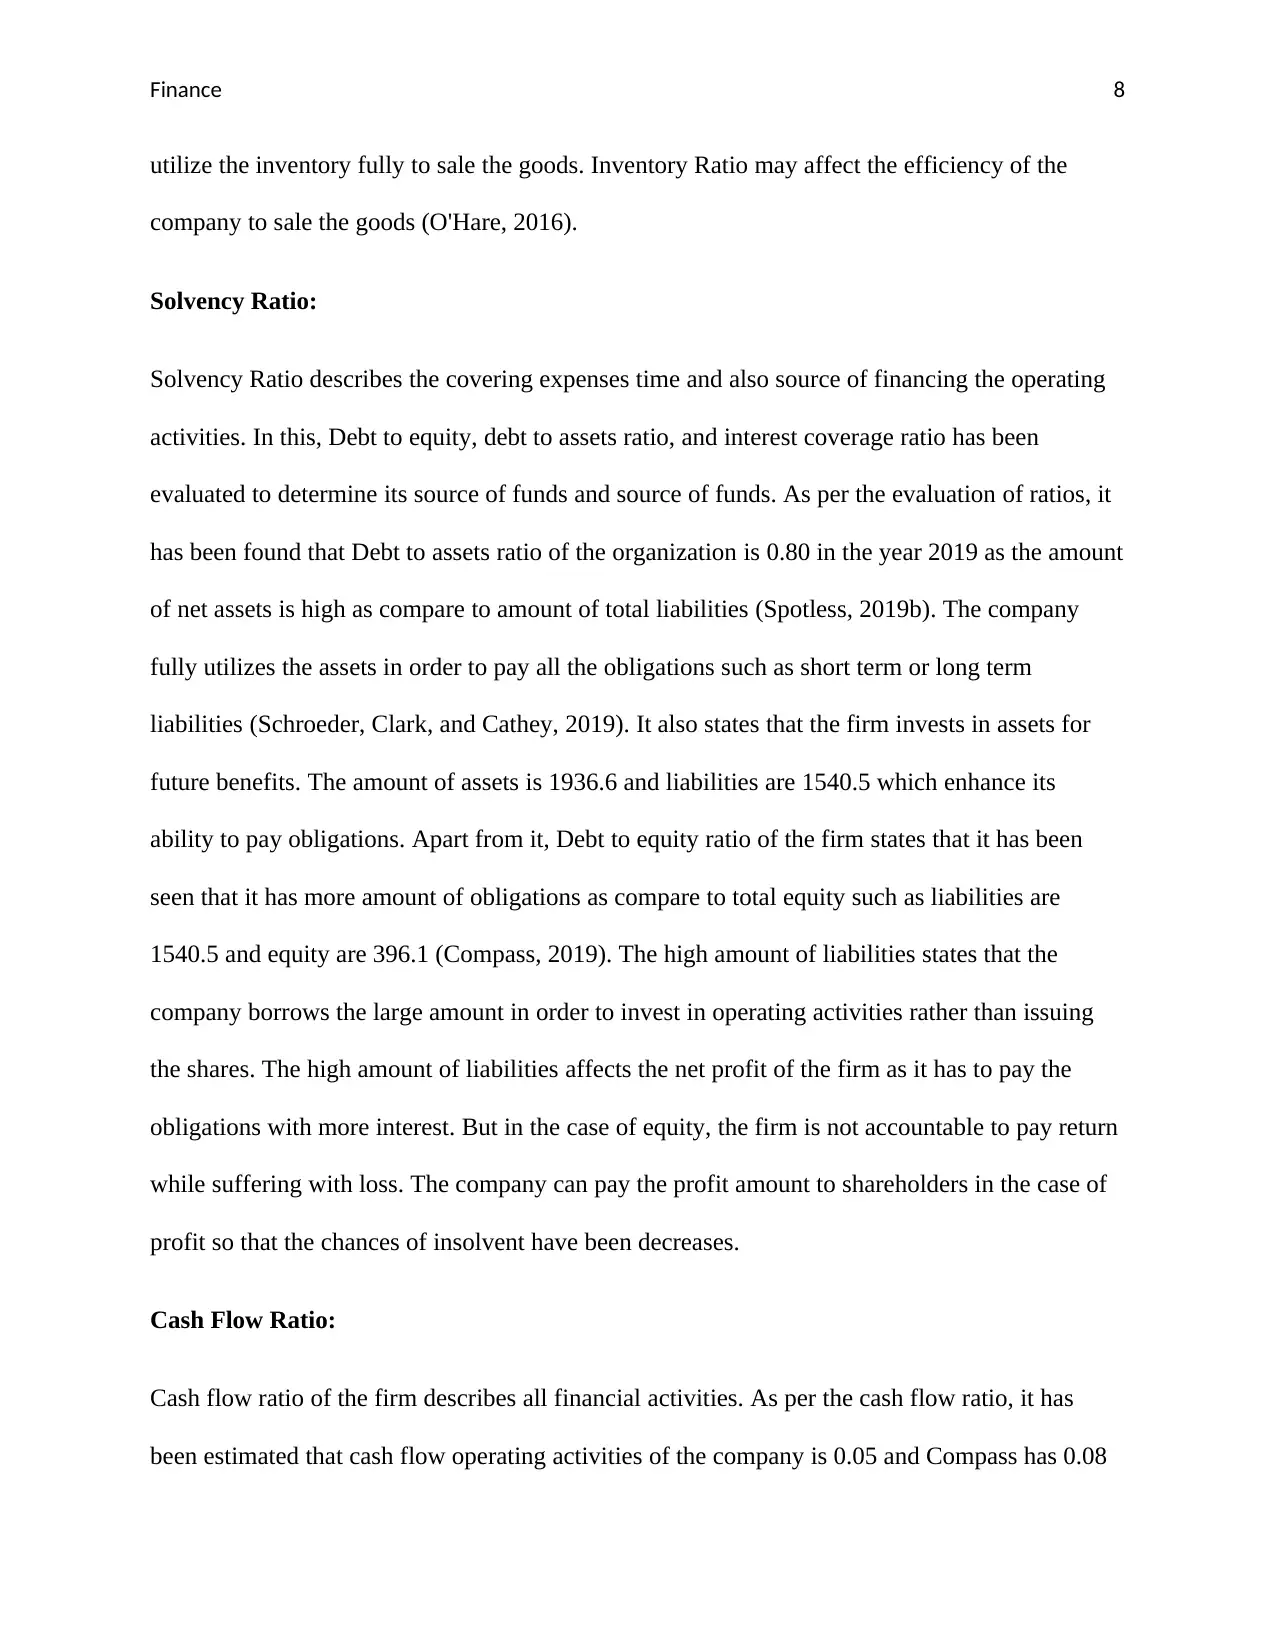
utilize the inventory fully to sale the goods. Inventory Ratio may affect the efficiency of the
company to sale the goods (O'Hare, 2016).
Solvency Ratio:
Solvency Ratio describes the covering expenses time and also source of financing the operating
activities. In this, Debt to equity, debt to assets ratio, and interest coverage ratio has been
evaluated to determine its source of funds and source of funds. As per the evaluation of ratios, it
has been found that Debt to assets ratio of the organization is 0.80 in the year 2019 as the amount
of net assets is high as compare to amount of total liabilities (Spotless, 2019b). The company
fully utilizes the assets in order to pay all the obligations such as short term or long term
liabilities (Schroeder, Clark, and Cathey, 2019). It also states that the firm invests in assets for
future benefits. The amount of assets is 1936.6 and liabilities are 1540.5 which enhance its
ability to pay obligations. Apart from it, Debt to equity ratio of the firm states that it has been
seen that it has more amount of obligations as compare to total equity such as liabilities are
1540.5 and equity are 396.1 (Compass, 2019). The high amount of liabilities states that the
company borrows the large amount in order to invest in operating activities rather than issuing
the shares. The high amount of liabilities affects the net profit of the firm as it has to pay the
obligations with more interest. But in the case of equity, the firm is not accountable to pay return
while suffering with loss. The company can pay the profit amount to shareholders in the case of
profit so that the chances of insolvent have been decreases.
Cash Flow Ratio:
Cash flow ratio of the firm describes all financial activities. As per the cash flow ratio, it has
been estimated that cash flow operating activities of the company is 0.05 and Compass has 0.08
⊘ This is a preview!⊘
Do you want full access?
Subscribe today to unlock all pages.
Trusted by 1+ million students worldwide
Finance 9
(Spotless, 2019b). As per this ratio, the operating activities of the company are not more
beneficial from which it generate the high amount of sale. The ratio of cash return on equity
represents that the firm gives the high return to shareholders in order to develop the strong
relation with shareholder. It maintains the strong relation due to which it is able to attain the high
success in business.
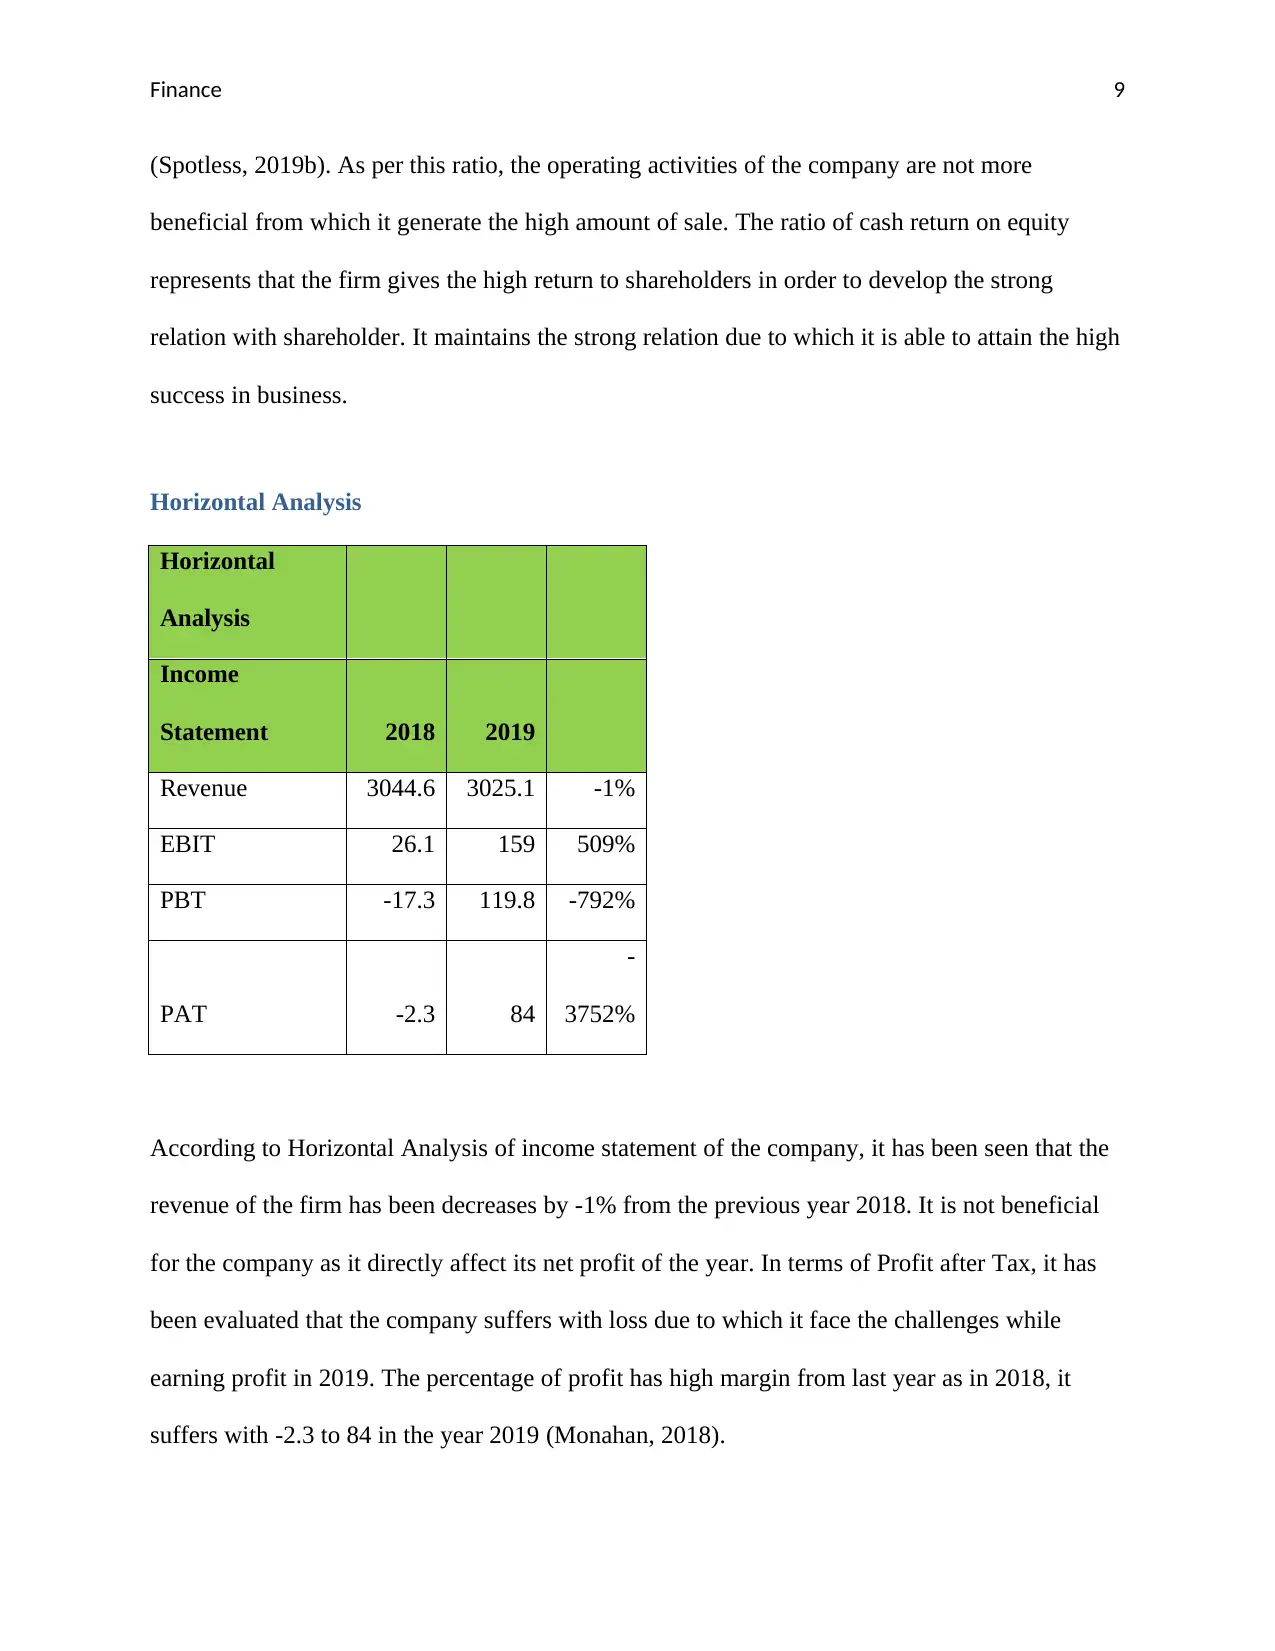
Horizontal Analysis
Horizontal
Analysis
Income
Statement 2018 2019
Revenue 3044.6 3025.1 -1%
EBIT 26.1 159 509%
PBT -17.3 119.8 -792%
PAT -2.3 84
-
3752%
According to Horizontal Analysis of income statement of the company, it has been seen that the
revenue of the firm has been decreases by -1% from the previous year 2018. It is not beneficial
for the company as it directly affect its net profit of the year. In terms of Profit after Tax, it has
been evaluated that the company suffers with loss due to which it face the challenges while
earning profit in 2019. The percentage of profit has high margin from last year as in 2018, it
suffers with -2.3 to 84 in the year 2019 (Monahan, 2018).
(Spotless, 2019b). As per this ratio, the operating activities of the company are not more
beneficial from which it generate the high amount of sale. The ratio of cash return on equity
represents that the firm gives the high return to shareholders in order to develop the strong
relation with shareholder. It maintains the strong relation due to which it is able to attain the high
success in business.
Horizontal Analysis
Horizontal
Analysis
Income
Statement 2018 2019
Revenue 3044.6 3025.1 -1%
EBIT 26.1 159 509%
PBT -17.3 119.8 -792%
PAT -2.3 84
-
3752%
According to Horizontal Analysis of income statement of the company, it has been seen that the
revenue of the firm has been decreases by -1% from the previous year 2018. It is not beneficial
for the company as it directly affect its net profit of the year. In terms of Profit after Tax, it has
been evaluated that the company suffers with loss due to which it face the challenges while
earning profit in 2019. The percentage of profit has high margin from last year as in 2018, it
suffers with -2.3 to 84 in the year 2019 (Monahan, 2018).
Paraphrase This Document
Need a fresh take? Get an instant paraphrase of this document with our AI Paraphraser
Finance 10
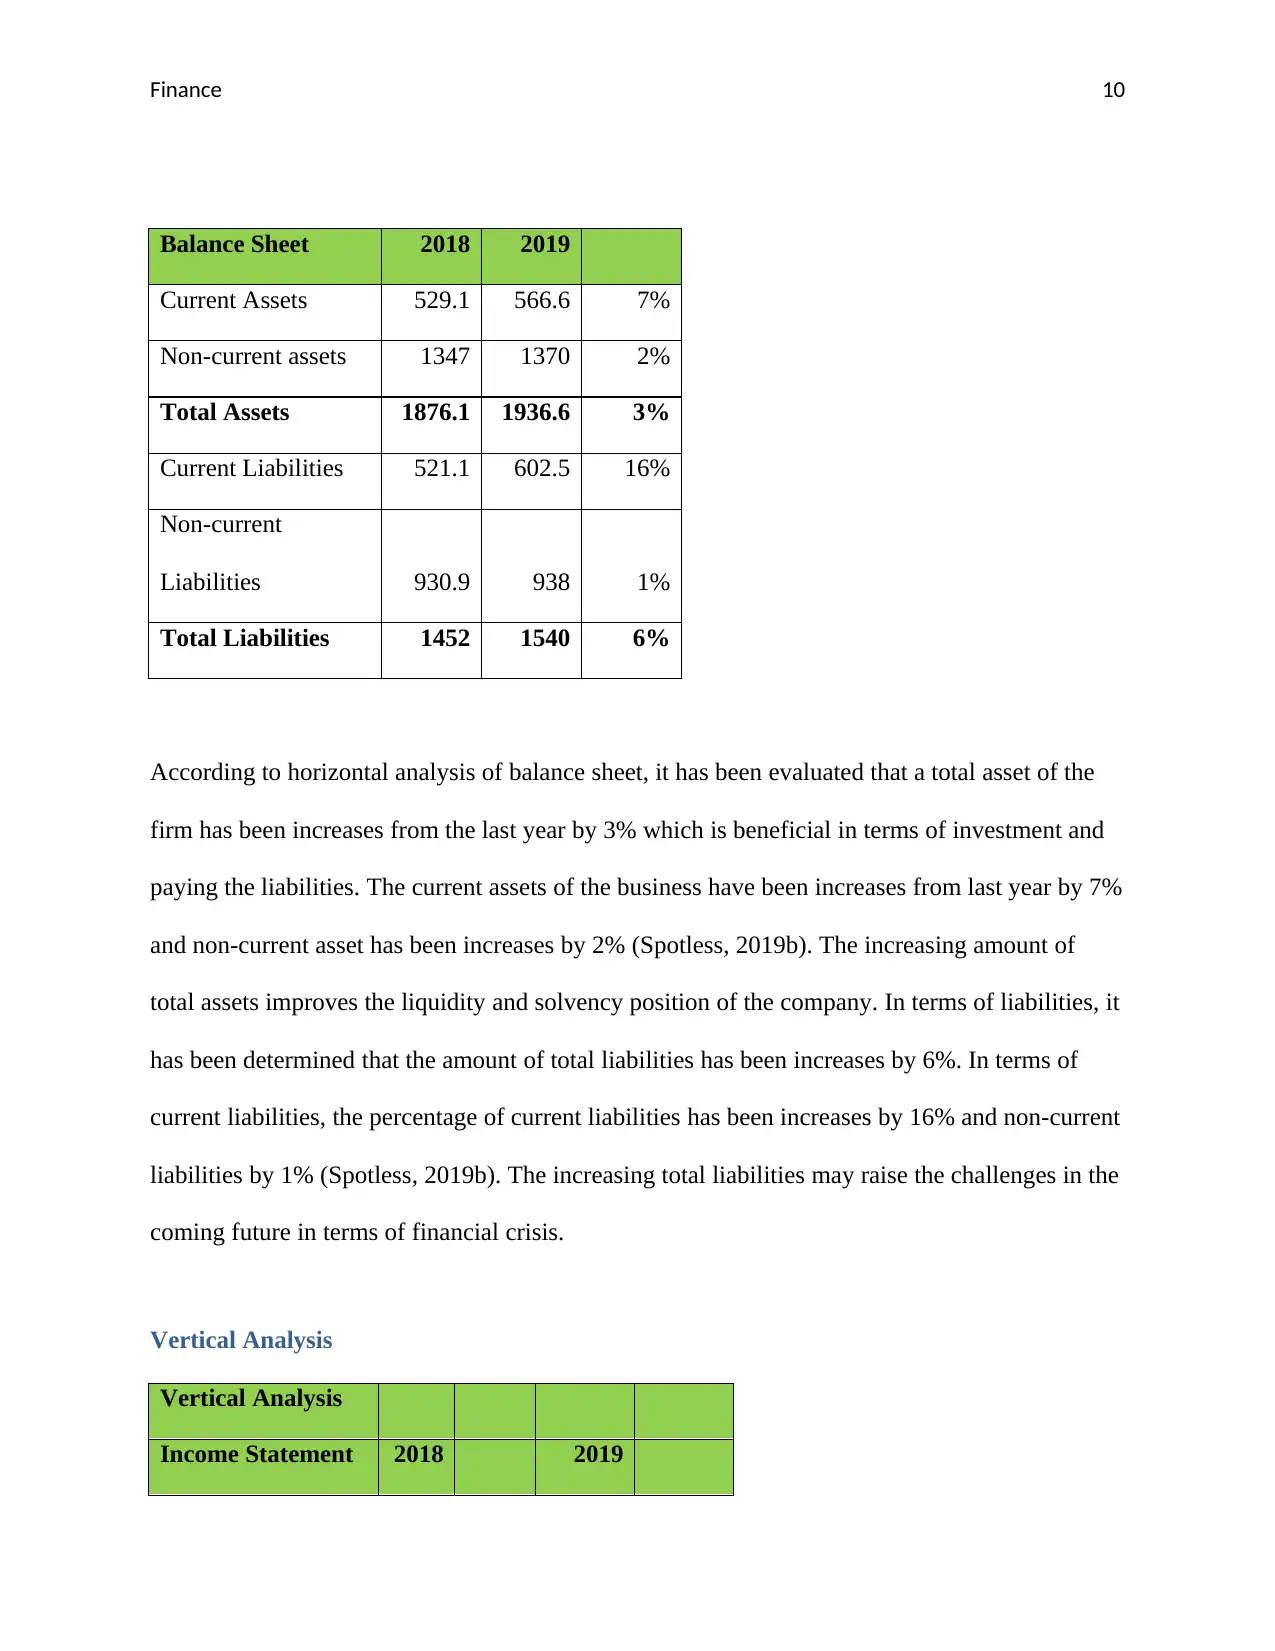
Balance Sheet 2018 2019
Current Assets 529.1 566.6 7%
Non-current assets 1347 1370 2%
Total Assets 1876.1 1936.6 3%
Current Liabilities 521.1 602.5 16%
Non-current
Liabilities 930.9 938 1%
Total Liabilities 1452 1540 6%
According to horizontal analysis of balance sheet, it has been evaluated that a total asset of the
firm has been increases from the last year by 3% which is beneficial in terms of investment and
paying the liabilities. The current assets of the business have been increases from last year by 7%
and non-current asset has been increases by 2% (Spotless, 2019b). The increasing amount of
total assets improves the liquidity and solvency position of the company. In terms of liabilities, it
has been determined that the amount of total liabilities has been increases by 6%. In terms of
current liabilities, the percentage of current liabilities has been increases by 16% and non-current
liabilities by 1% (Spotless, 2019b). The increasing total liabilities may raise the challenges in the
coming future in terms of financial crisis.
Vertical Analysis
Vertical Analysis
Income Statement 2018 2019
Finance 11
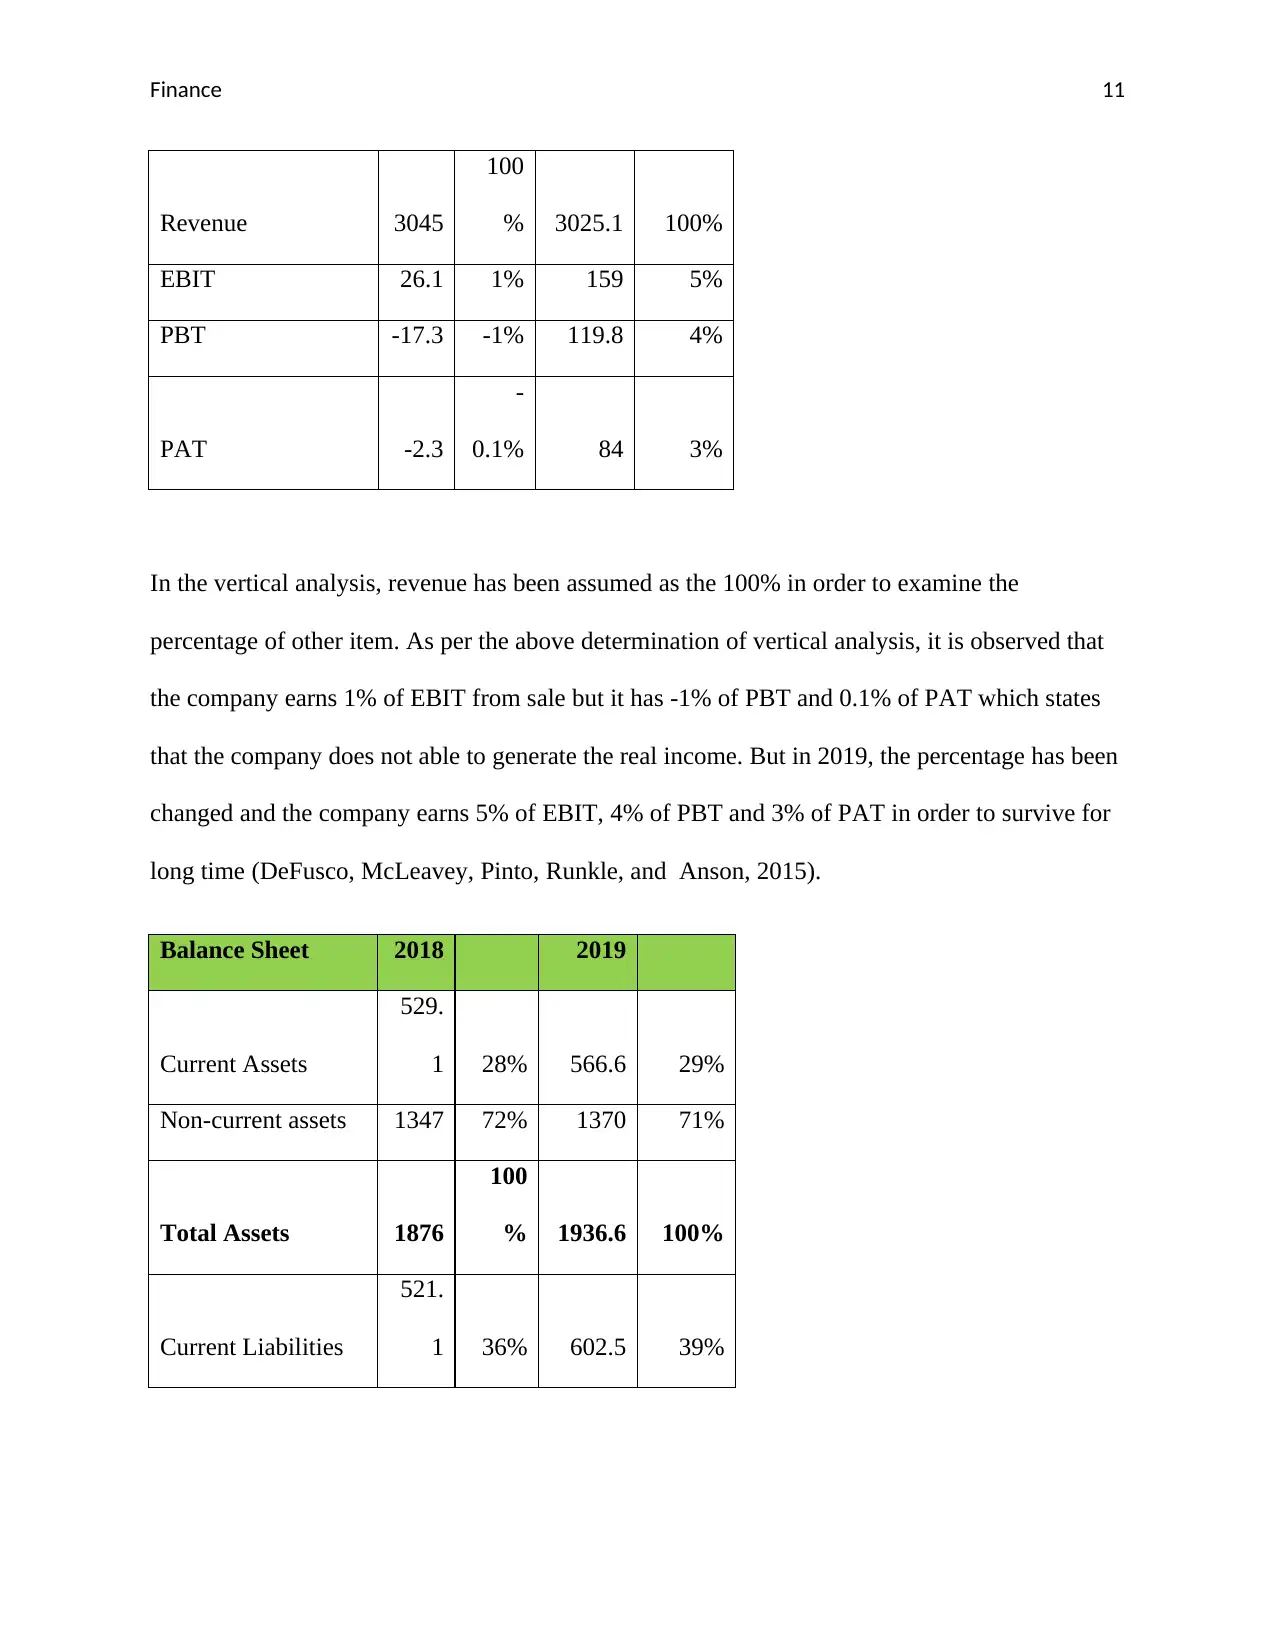
Revenue 3045
100
% 3025.1 100%
EBIT 26.1 1% 159 5%
PBT -17.3 -1% 119.8 4%
PAT -2.3
-
0.1% 84 3%
In the vertical analysis, revenue has been assumed as the 100% in order to examine the
percentage of other item. As per the above determination of vertical analysis, it is observed that
the company earns 1% of EBIT from sale but it has -1% of PBT and 0.1% of PAT which states
that the company does not able to generate the real income. But in 2019, the percentage has been
changed and the company earns 5% of EBIT, 4% of PBT and 3% of PAT in order to survive for
long time (DeFusco, McLeavey, Pinto, Runkle, and Anson, 2015).
Balance Sheet 2018 2019
Current Assets
529.
1 28% 566.6 29%
Non-current assets 1347 72% 1370 71%
Total Assets 1876
100
% 1936.6 100%
Current Liabilities
521.
1 36% 602.5 39%
⊘ This is a preview!⊘
Do you want full access?
Subscribe today to unlock all pages.
Trusted by 1+ million students worldwide
1 out of 17
Related Documents


Your All-in-One AI-Powered Toolkit for Academic Success.
+13062052269
info@desklib.com
Available 24*7 on WhatsApp / Email
![[object Object]](/_next/static/media/star-bottom.7253800d.svg)
Unlock your academic potential
Copyright © 2020–2026 A2Z Services. All Rights Reserved. Developed and managed by ZUCOL.