Potential Difficulties: Comparing Financial Statements of HP and Dell

Verified

Added on  2022/08/08

|6
|769
|322
Report
AI Summary
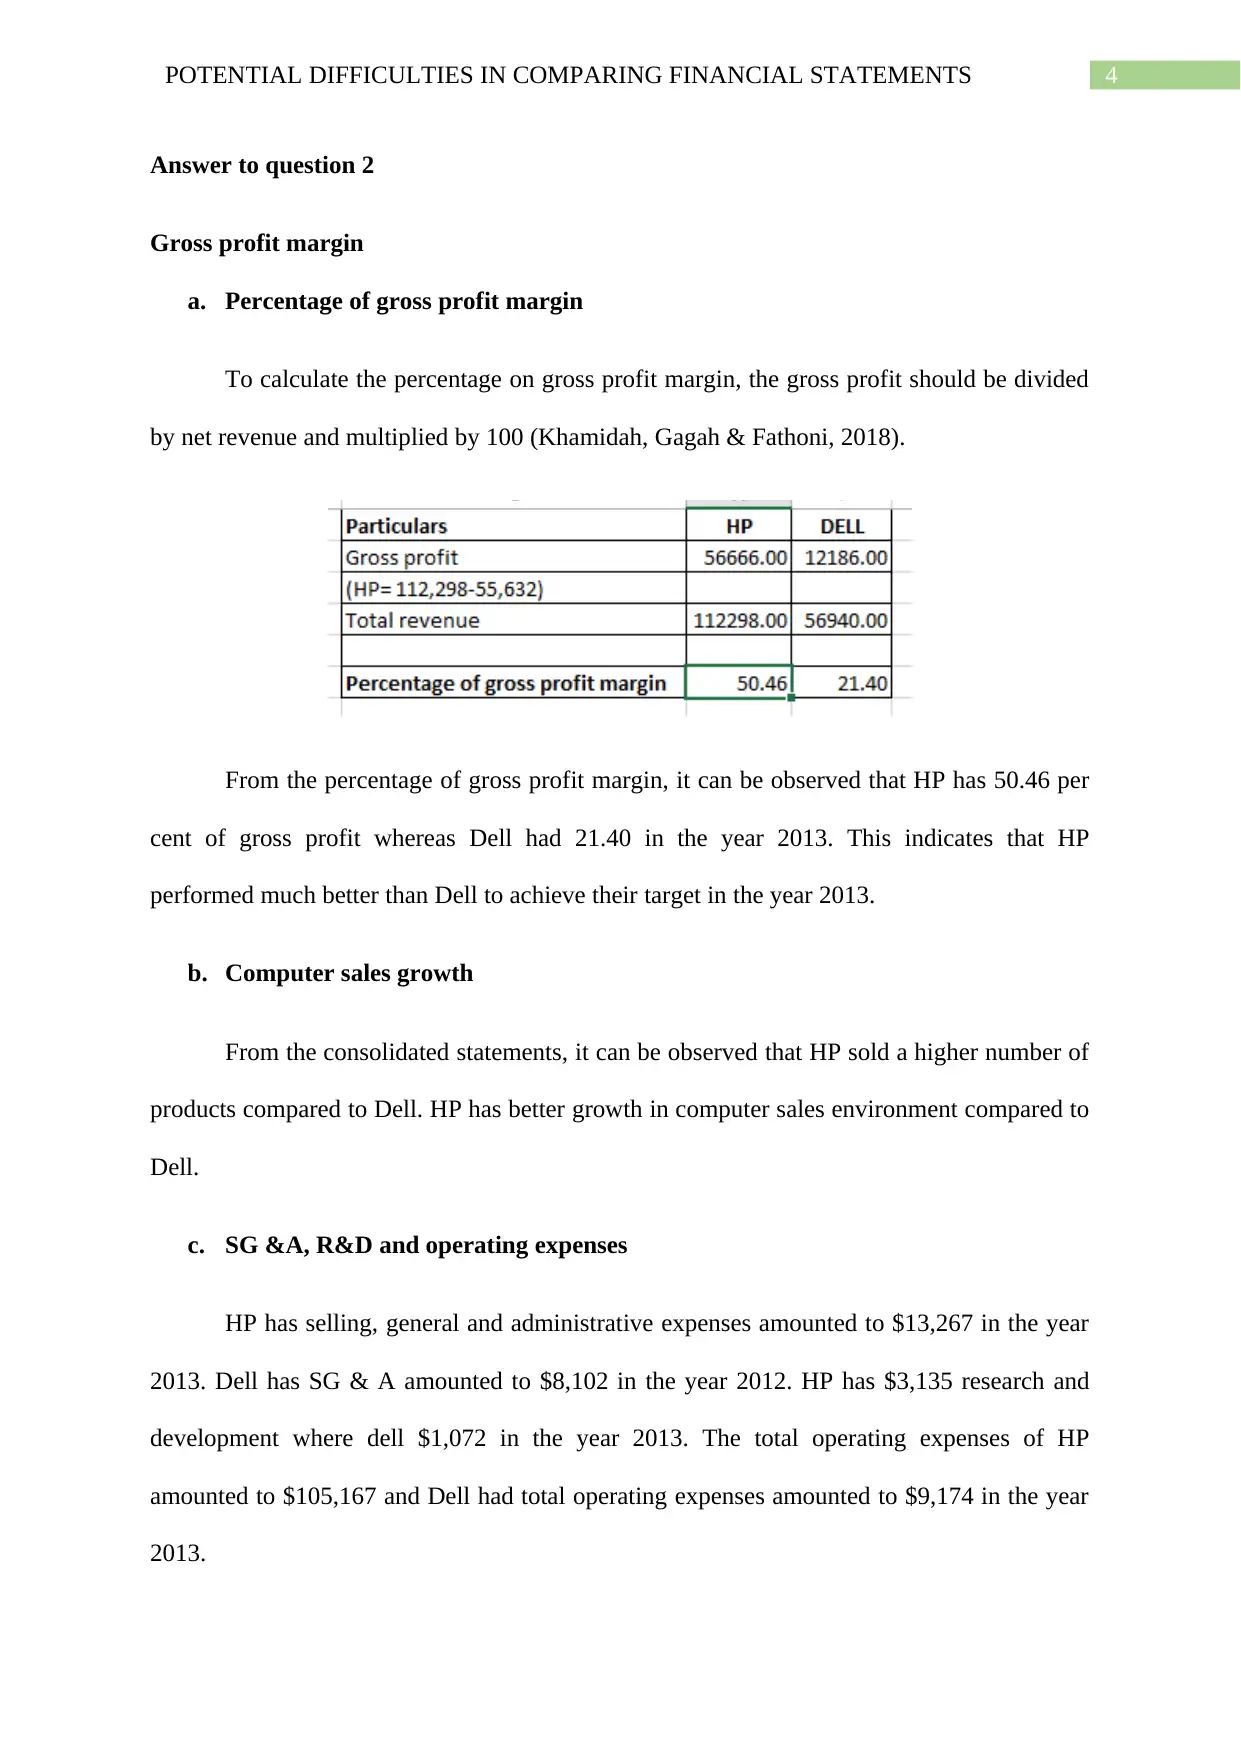
This report presents a comparative analysis of Hewlett Packard (HP) and Dell's financial statements for the fiscal year 2013. It begins by comparing the revenue figures of both companies and assessing which financial statement provides more detailed information. The analysis then delves into key financial metrics, including gross profit margin, computer sales growth, selling, general, and administrative expenses (SG&A), research and development (R&D) expenses, and overall operating expenses. The report highlights significant differences in the financial performance of HP and Dell, drawing inferences about their operational strategies and financial health. The report also addresses the potential difficulties in comparing financial statements across companies, emphasizing the importance of detailed information and consistent reporting. The findings indicate that HP demonstrated a stronger financial position compared to Dell during the analyzed period.
Document Page
Running head: POTENTIAL DIFFICULTIES IN COMPARING FINANCIAL
STATEMENTS
POTENTIAL DIFFICULTIES IN COMPARING FINANCIAL STATEMENTS
Name of Student
Name of the University
Author note
Word count
tabler-icon-diamond-filled.svg

Secure Best Marks with AI Grader

Need help grading? Try our AI Grader for instant feedback on your assignments.
Document Page
2POTENTIAL DIFFICULTIES IN COMPARING FINANCIAL STATEMENTS
Table of Contents
Answer to question 1..................................................................................................................3
1. Comparison of HP and Dell................................................................................................3
Answer to question 2..................................................................................................................4
Gross profit margin................................................................................................................4
References..................................................................................................................................6
Document Page
3POTENTIAL DIFFICULTIES IN COMPARING FINANCIAL STATEMENTS
Answer to question 1
This report will discuss the financial statements of HP and Dell in the fiscal year
2013.
1. Comparison of HP and Dell
a. Comparison of numbers
From the consolidated statement of earnings in the fiscal year 2013, HP made a net
revenue of $ 112,298 million, which was decreased from the previous year. In the year 2012,
HP made a loss that they recovered in the fiscal year 2013. The profit from net earnings
amounted to $5,113 in the year 2013.
From the consolidated statement of earnings of Dell in the fiscal year 2013, Dell made
a net revenue of $ 56,940, which was $62,071 in the previous year. The net income of Dell is
also reduced in the year 2013.
b. Informations from financial statement
From the observation of both of the consolidated statements, it can be observed that
HP is in better financial condition than Dell as HP recovered their net loss, as well as the
revenue of HP, is higher than Dell in the fiscal year 2013 (Kahn & Baum, 2020).
c. Differences on income statement
Financial statements of HP provides more detailed financial information compared to
Dell. HP provided every required information to estimate the financial condition of the
company. Financial statements of Dell has some missing information like comprehensive
income statement, which is needed to evaluate their financial situation effectively (Robinson,
2020).
Document Page
4POTENTIAL DIFFICULTIES IN COMPARING FINANCIAL STATEMENTS
Answer to question 2
Gross profit margin
a. Percentage of gross profit margin
To calculate the percentage on gross profit margin, the gross profit should be divided
by net revenue and multiplied by 100 (Khamidah, Gagah & Fathoni, 2018).
From the percentage of gross profit margin, it can be observed that HP has 50.46 per
cent of gross profit whereas Dell had 21.40 in the year 2013. This indicates that HP
performed much better than Dell to achieve their target in the year 2013.
b. Computer sales growth
From the consolidated statements, it can be observed that HP sold a higher number of
products compared to Dell. HP has better growth in computer sales environment compared to
Dell.
c. SG &A, R&D and operating expenses
HP has selling, general and administrative expenses amounted to $13,267 in the year
2013. Dell has SG & A amounted to $8,102 in the year 2012. HP has $3,135 research and
development where dell $1,072 in the year 2013. The total operating expenses of HP
amounted to $105,167 and Dell had total operating expenses amounted to $9,174 in the year
2013.
tabler-icon-diamond-filled.svg

Secure Best Marks with AI Grader

Need help grading? Try our AI Grader for instant feedback on your assignments.
Document Page
5POTENTIAL DIFFICULTIES IN COMPARING FINANCIAL STATEMENTS
HP had a higher SG&A, R&D and total operating expenses than that of Dell.
d. Observation from analysis
From the analysis, it can be observed that the financial operations of HP are better in
every aspect. Dell still needs to look after its revenue and income statements to increase the
profitability of the firm (Williams & Dobelman, 2017).
Document Page
6POTENTIAL DIFFICULTIES IN COMPARING FINANCIAL STATEMENTS
References
Khamidah, A., Gagah, E., & Fathoni, A. (2018). Analysis Of The Effect Of Gross Profit
Margin (GPM), Earning Per Share (EPS), Debt To Equity Ratio (DER), Net Profit
Margin (NPM) On Return On Assets (ROA)(Study On Property and Real Estate
Companies listed on the Indonesia Stock Exchange Year 2012–2016). Journal of
Management, 4(4).
Kahn, M. J., & Baum, N. (2020). Basic Accounting and Interpretation of Financial
Statements. In The Business Basics of Building and Managing a Healthcare
Practice (pp. 13-18). Springer, Cham.
Robinson, T.R., 2020. International financial statement analysis. John Wiley & Sons.
Williams, E. E., & Dobelman, J. A. (2017). Financial statement analysis. World Scientific
Book Chapters, 109-169.
chevron_up_icon
1 out of 6
circle_padding
hide_on_mobile
zoom_out_icon
logo.png

Your All-in-One AI-Powered Toolkit for Academic Success.

Available 24*7 on WhatsApp / Email

[object Object]