Financial Analysis: Project Evaluation Report - University Finance
VerifiedAdded on 2022/08/13
|26
|5166
|14
Project
AI Summary
This project presents a comprehensive financial analysis of a hypothetical company's investment decisions. Part A focuses on Net Present Value (NPV) and Internal Rate of Return (IRR) analysis, evaluating the impact of various factors such as product pricing, depreciation methods, and the addition of new machinery on project profitability and value creation for stakeholders. Part B compares two projects, emphasizing the importance of NPV over IRR in making investment choices. Part C delves into financial statement analysis, utilizing profitability, liquidity, leverage, and cash flow ratios to assess the company's financial health and performance. The analysis includes graphical representations of key ratios and discusses the implications of these ratios on business decisions. The project highlights the importance of financial analysis in making informed investment decisions and understanding the factors that influence a company's financial performance.

Running head: FINANCIALS ANALYSIS
Financials Analysis
Name of the Student:
Name of the University:
Author Note:
Financials Analysis
Name of the Student:
Name of the University:
Author Note:
Paraphrase This Document
Need a fresh take? Get an instant paraphrase of this document with our AI Paraphraser
1FINANCIALS ANALYSIS
Table of Contents
Answer to Part A:.......................................................................................................................2
Answer 1:...............................................................................................................................2
Answer 2:...............................................................................................................................3
Answer 3:...............................................................................................................................4
Answer 4:...............................................................................................................................6
Answer to Part B:.......................................................................................................................8
Answer to Part C:.......................................................................................................................9
Introduction:...........................................................................................................................9
Discussion:...........................................................................................................................10
Profitability Ratio:............................................................................................................10
Liquidity Ratio:................................................................................................................13
Leverage Ratio:................................................................................................................15
Cash Flow Ratio:..............................................................................................................18
Actions Taken by management and their effects:............................................................20
Conclusion:..........................................................................................................................21
References:...............................................................................................................................22
2FINANCIALS ANALYSIS
Answer to Part A:
Answer 1:
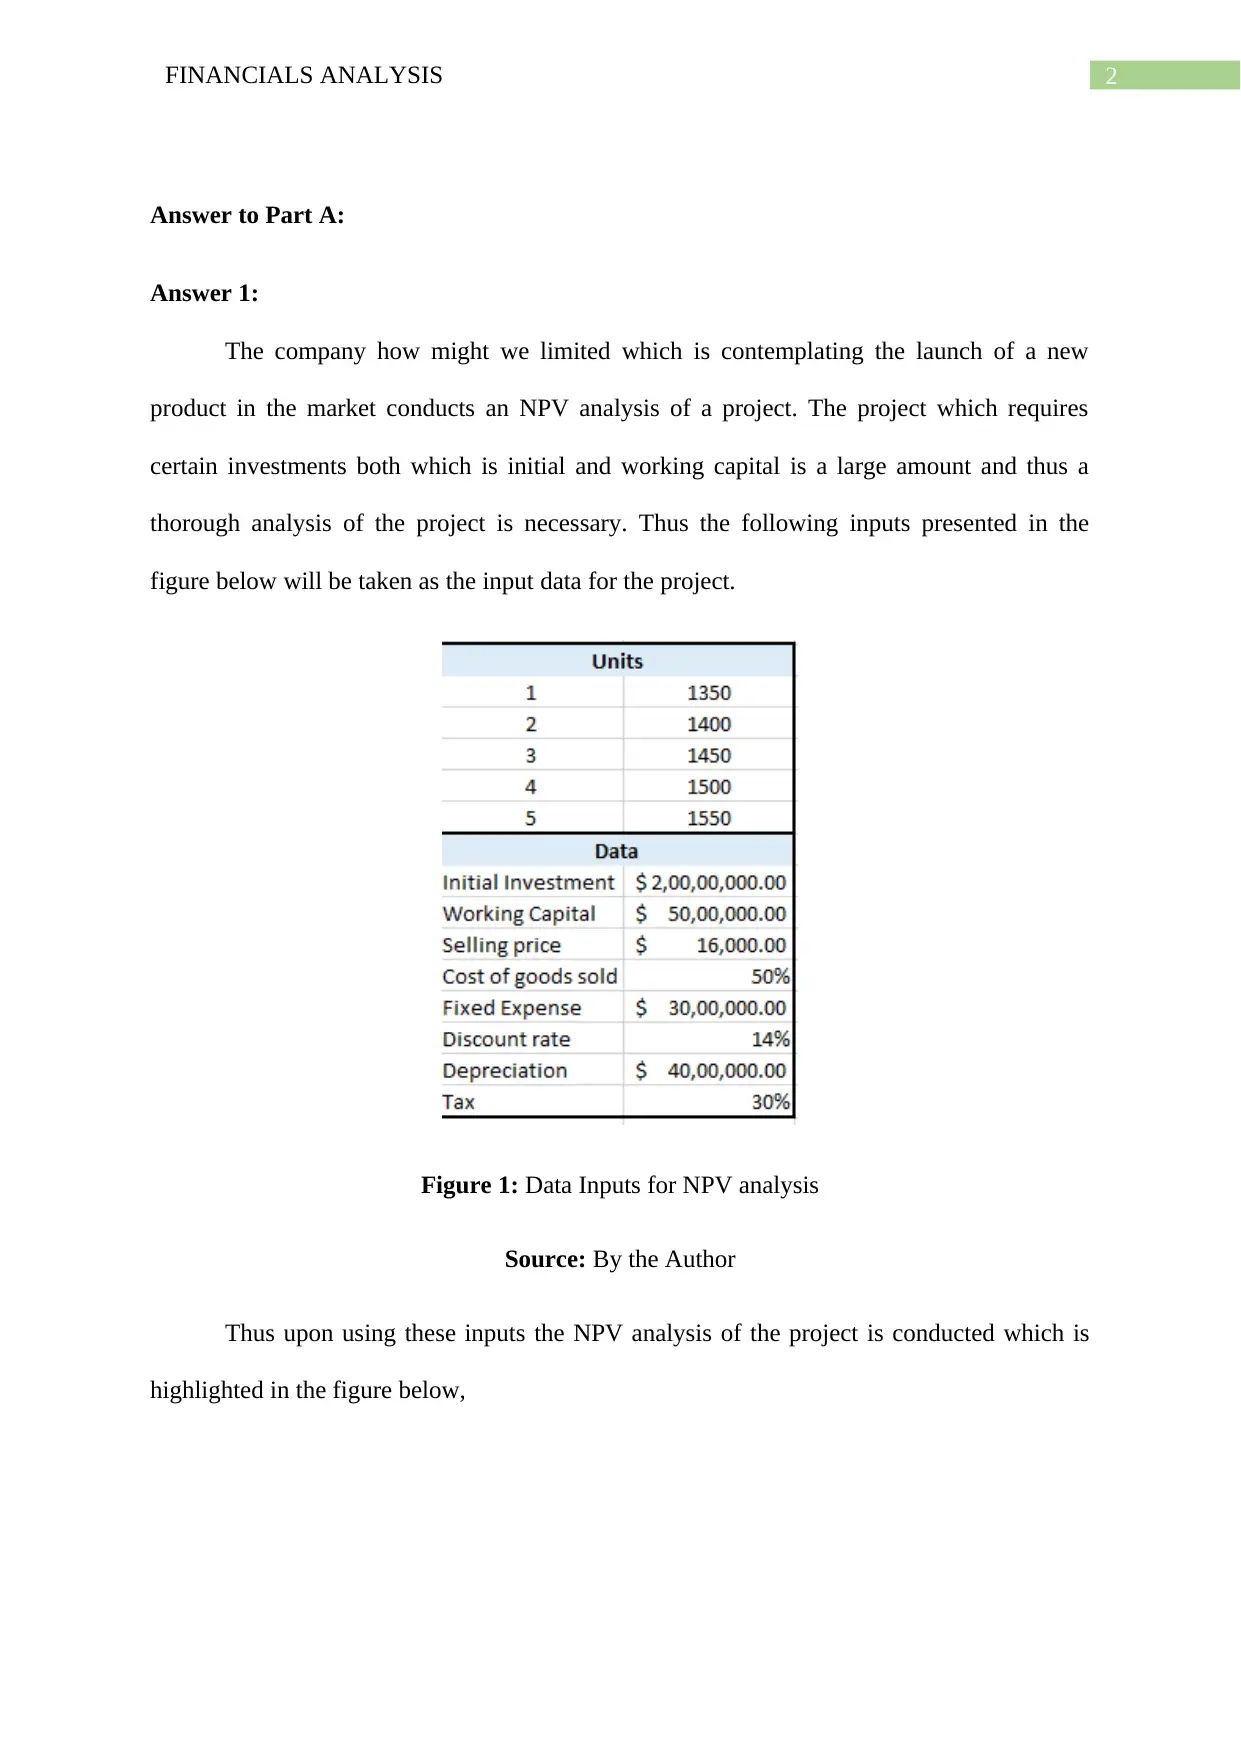
The company how might we limited which is contemplating the launch of a new
product in the market conducts an NPV analysis of a project. The project which requires
certain investments both which is initial and working capital is a large amount and thus a
thorough analysis of the project is necessary. Thus the following inputs presented in the
figure below will be taken as the input data for the project.
Figure 1: Data Inputs for NPV analysis
Source: By the Author
Thus upon using these inputs the NPV analysis of the project is conducted which is
highlighted in the figure below,
Answer to Part A:
Answer 1:
The company how might we limited which is contemplating the launch of a new
product in the market conducts an NPV analysis of a project. The project which requires
certain investments both which is initial and working capital is a large amount and thus a
thorough analysis of the project is necessary. Thus the following inputs presented in the
figure below will be taken as the input data for the project.
Figure 1: Data Inputs for NPV analysis
Source: By the Author
Thus upon using these inputs the NPV analysis of the project is conducted which is
highlighted in the figure below,
⊘ This is a preview!⊘
Do you want full access?
Subscribe today to unlock all pages.
Trusted by 1+ million students worldwide
3FINANCIALS ANALYSIS
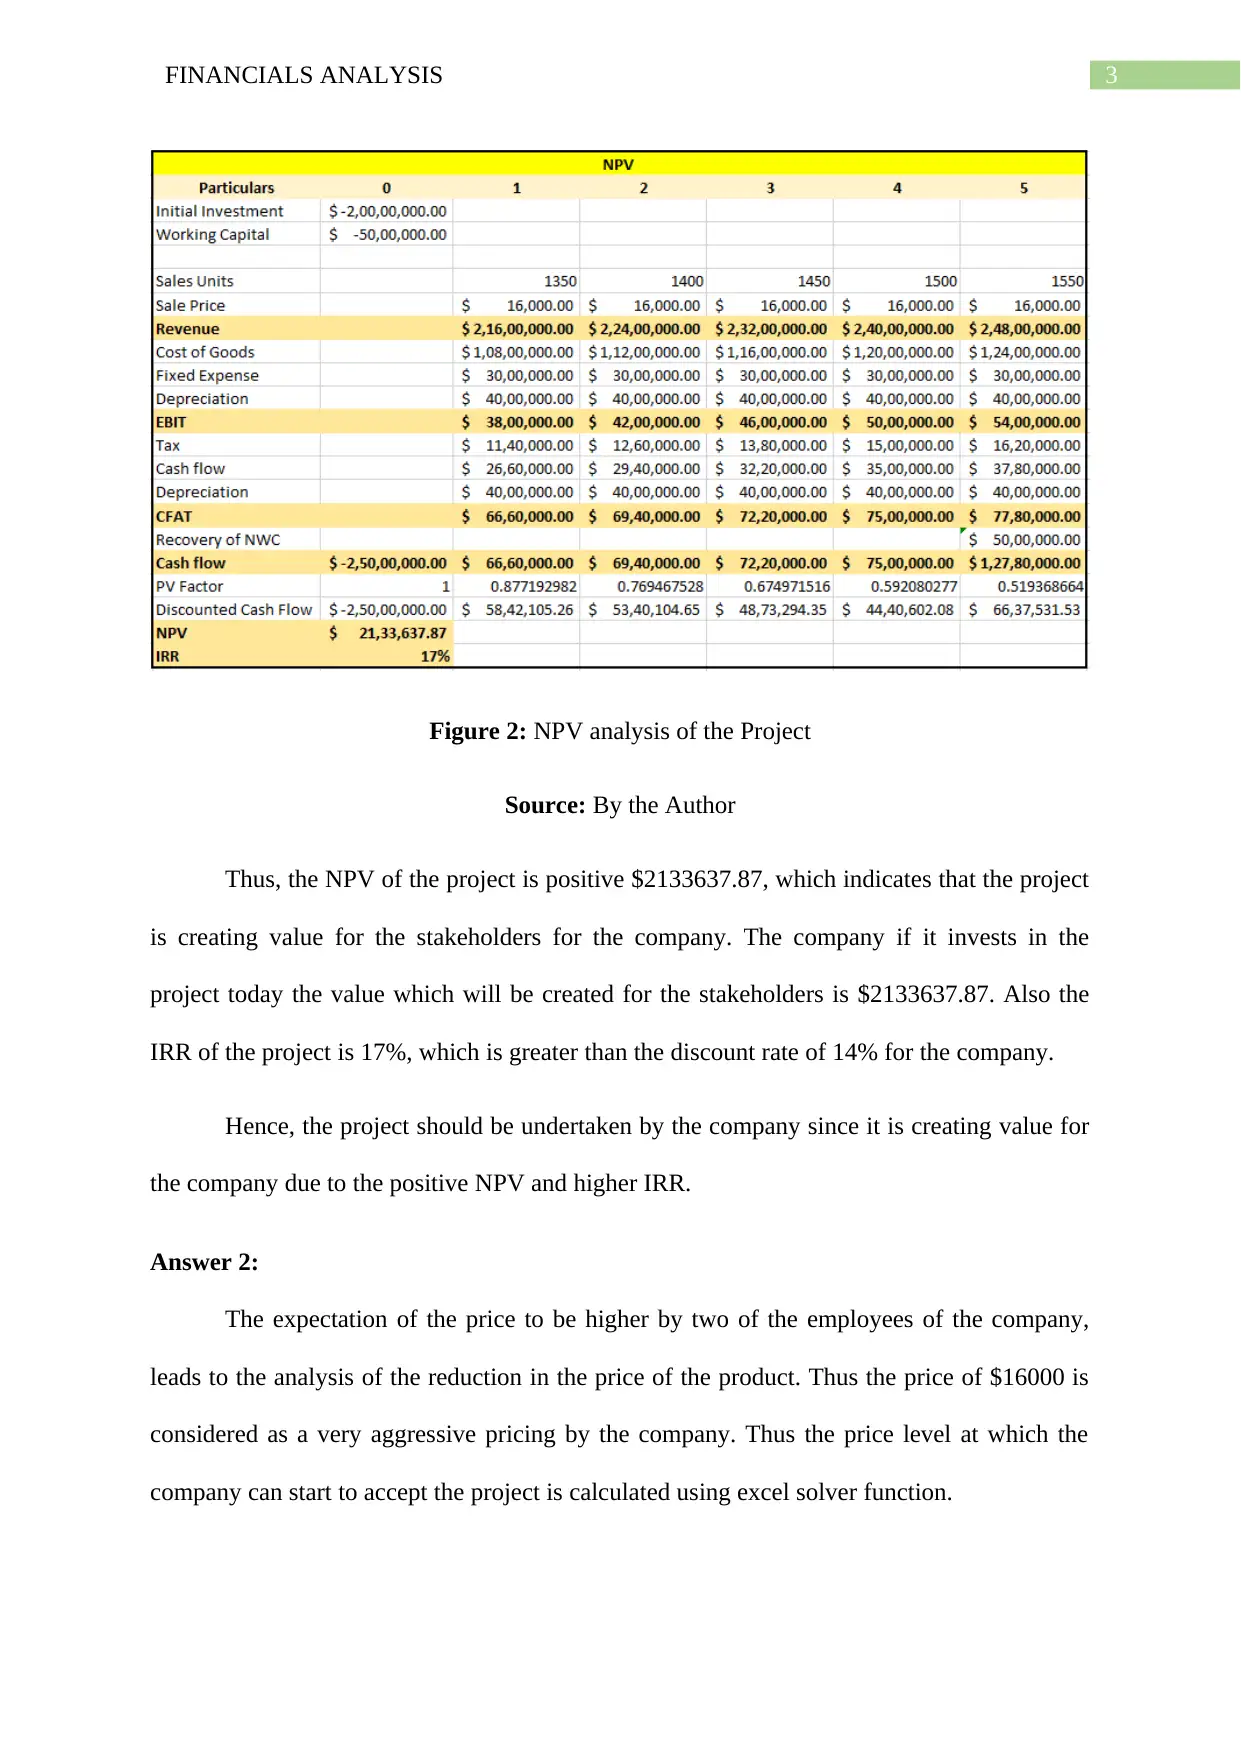
Figure 2: NPV analysis of the Project
Source: By the Author
Thus, the NPV of the project is positive $2133637.87, which indicates that the project
is creating value for the stakeholders for the company. The company if it invests in the
project today the value which will be created for the stakeholders is $2133637.87. Also the
IRR of the project is 17%, which is greater than the discount rate of 14% for the company.
Hence, the project should be undertaken by the company since it is creating value for
the company due to the positive NPV and higher IRR.
Answer 2:
The expectation of the price to be higher by two of the employees of the company,
leads to the analysis of the reduction in the price of the product. Thus the price of $16000 is
considered as a very aggressive pricing by the company. Thus the price level at which the
company can start to accept the project is calculated using excel solver function.
Paraphrase This Document
Need a fresh take? Get an instant paraphrase of this document with our AI Paraphraser
4FINANCIALS ANALYSIS
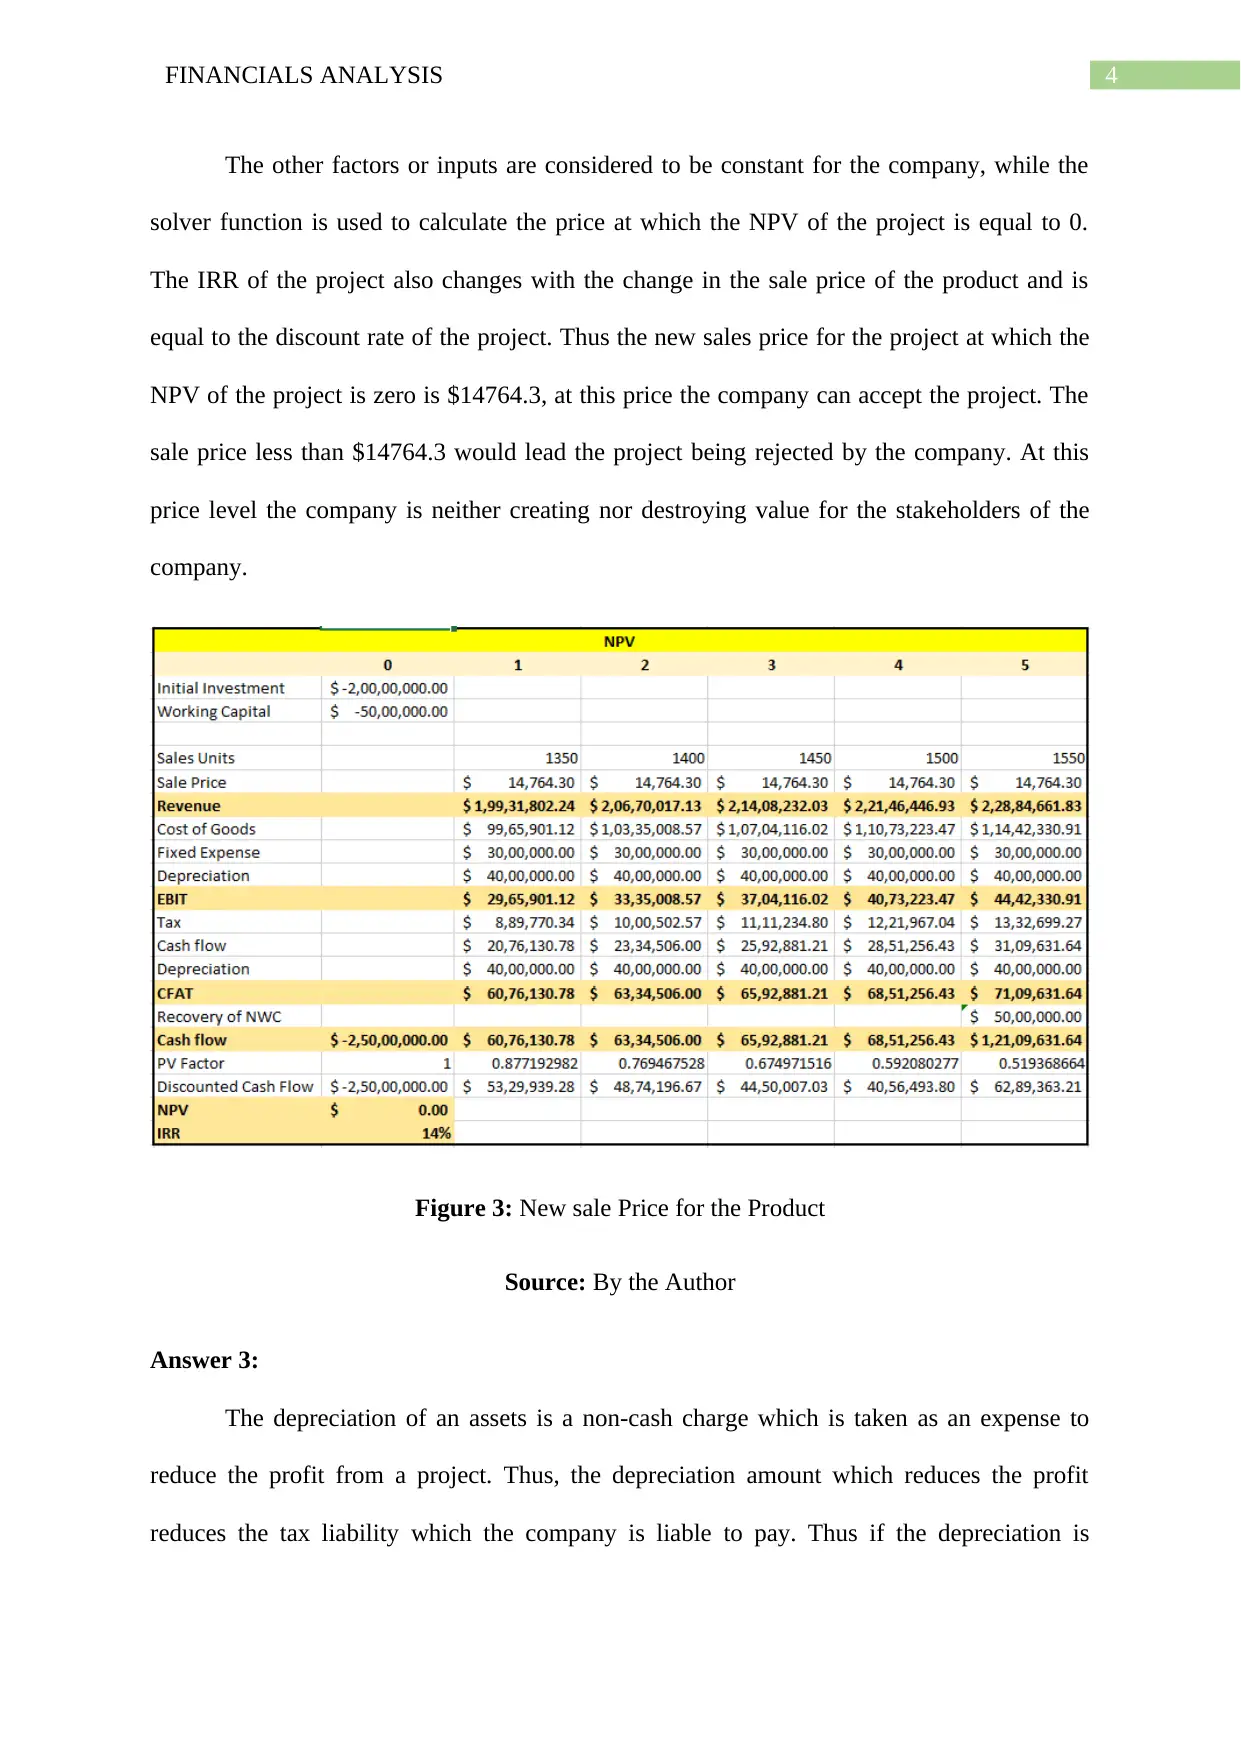
The other factors or inputs are considered to be constant for the company, while the
solver function is used to calculate the price at which the NPV of the project is equal to 0.
The IRR of the project also changes with the change in the sale price of the product and is
equal to the discount rate of the project. Thus the new sales price for the project at which the
NPV of the project is zero is $14764.3, at this price the company can accept the project. The
sale price less than $14764.3 would lead the project being rejected by the company. At this
price level the company is neither creating nor destroying value for the stakeholders of the
company.
Figure 3: New sale Price for the Product
Source: By the Author
Answer 3:
The depreciation of an assets is a non-cash charge which is taken as an expense to
reduce the profit from a project. Thus, the depreciation amount which reduces the profit
reduces the tax liability which the company is liable to pay. Thus if the depreciation is
5FINANCIALS ANALYSIS
charged initially at a higher rate the tax liability of the company reduces in the initial years,
but increases in the later years.
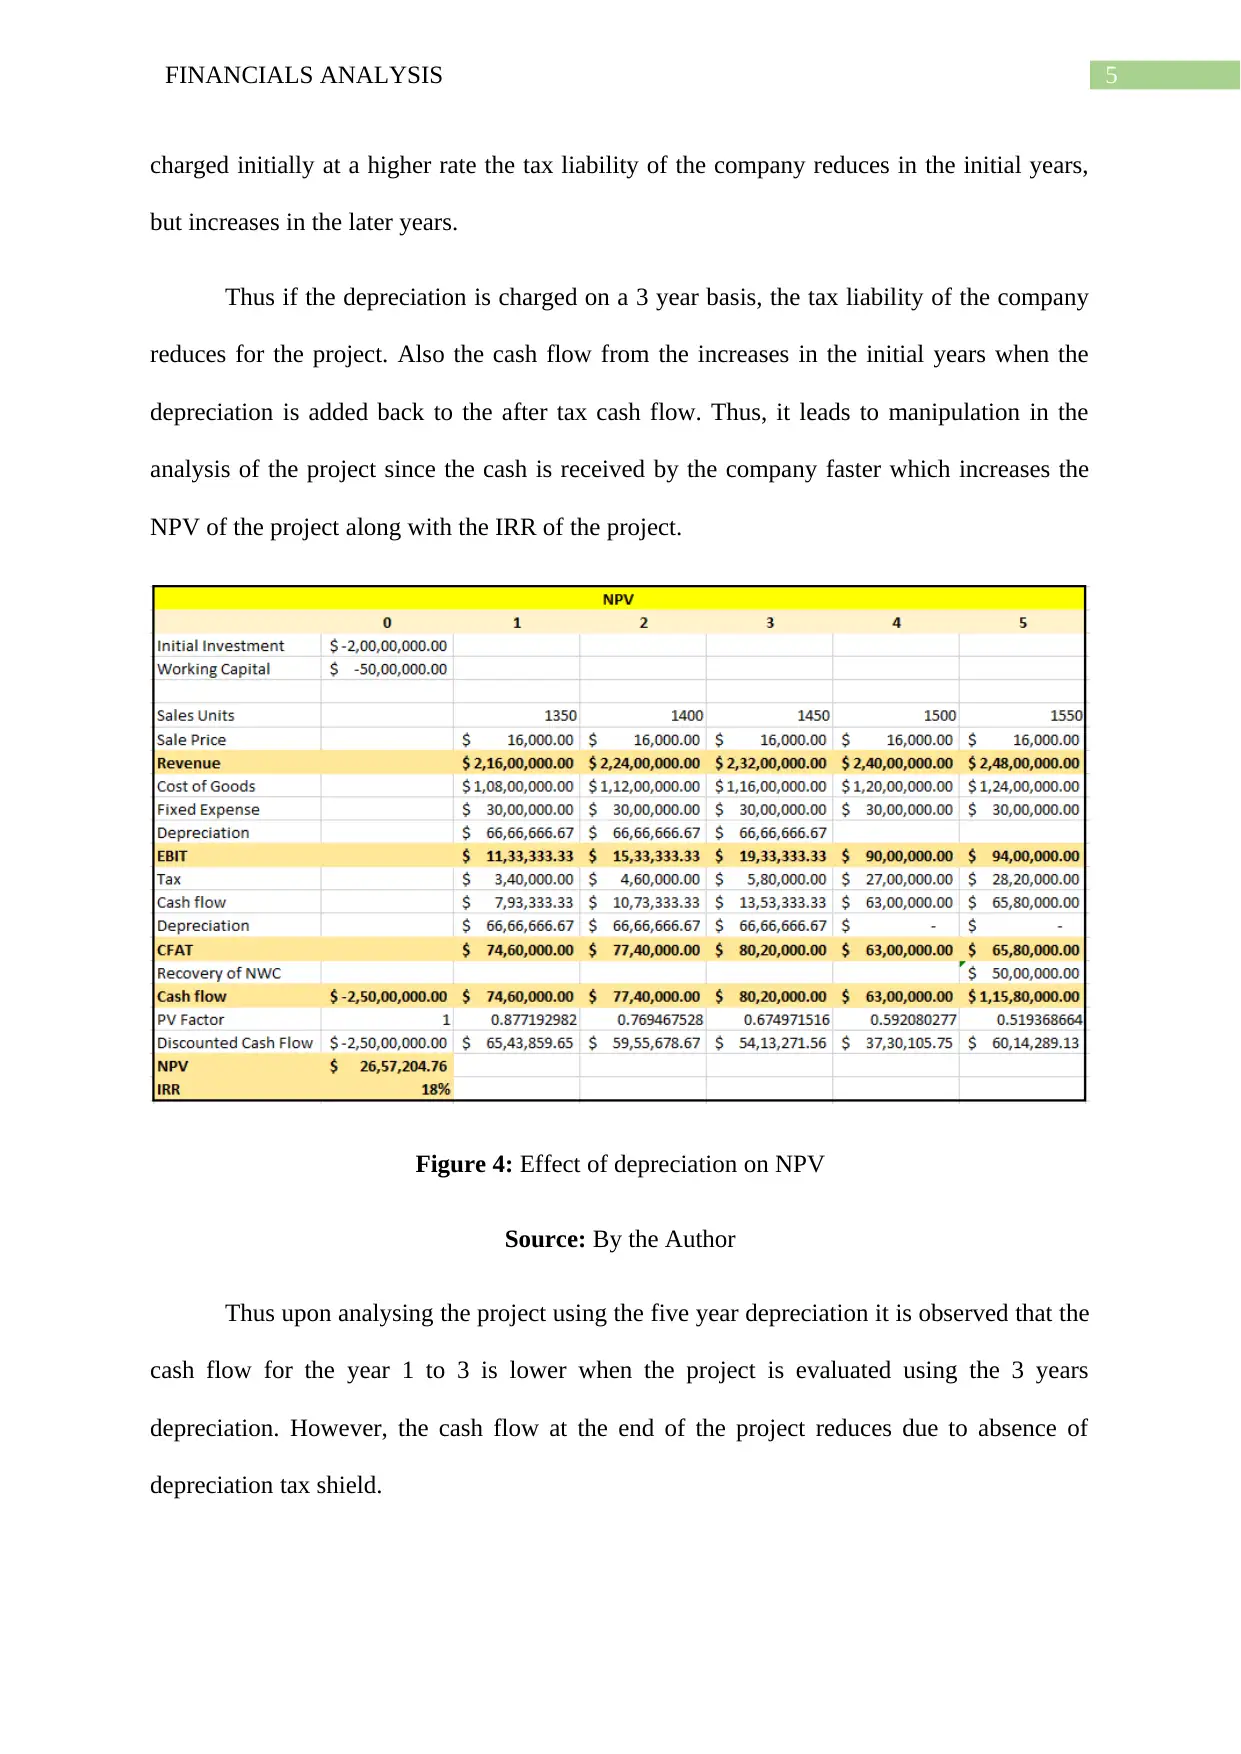
Thus if the depreciation is charged on a 3 year basis, the tax liability of the company
reduces for the project. Also the cash flow from the increases in the initial years when the
depreciation is added back to the after tax cash flow. Thus, it leads to manipulation in the
analysis of the project since the cash is received by the company faster which increases the
NPV of the project along with the IRR of the project.
Figure 4: Effect of depreciation on NPV
Source: By the Author
Thus upon analysing the project using the five year depreciation it is observed that the
cash flow for the year 1 to 3 is lower when the project is evaluated using the 3 years
depreciation. However, the cash flow at the end of the project reduces due to absence of
depreciation tax shield.
charged initially at a higher rate the tax liability of the company reduces in the initial years,
but increases in the later years.
Thus if the depreciation is charged on a 3 year basis, the tax liability of the company
reduces for the project. Also the cash flow from the increases in the initial years when the
depreciation is added back to the after tax cash flow. Thus, it leads to manipulation in the
analysis of the project since the cash is received by the company faster which increases the
NPV of the project along with the IRR of the project.
Figure 4: Effect of depreciation on NPV
Source: By the Author
Thus upon analysing the project using the five year depreciation it is observed that the
cash flow for the year 1 to 3 is lower when the project is evaluated using the 3 years
depreciation. However, the cash flow at the end of the project reduces due to absence of
depreciation tax shield.
⊘ This is a preview!⊘
Do you want full access?
Subscribe today to unlock all pages.
Trusted by 1+ million students worldwide
6FINANCIALS ANALYSIS
The NPV of the project increases to $2657204.76, while the IRR is also increased to
18%. Thus the project seems to create more value for the company if the treatment of
depreciation is changed in analysis. This because higher amount of cash flow is received by
the company at the beginning of the project, which reduces the risk for the company and thus
the project seems profitable for the company (Mellichamp 2019).
Thus this creates a conflict for the company since if the project provides some
incentive scheme to the managers after being accepted, the managers can portray the receipt
of higher cash in the beginning years of the project. Thus this can be done by changing the
treatment of depreciation of the project, which has been done in this project.
Thus this also seeks to create a conflict of interest for the stakeholders, since a project
which would not had been creating value for them in real life, but the analysis will lead to the
acceptance of the project. Thus this leads to loss in the stakeholder’s wealth due to greed of
the managers (Pranadi, Haramaini, Setiawan, Setiawan and Ali 2019).
Answer 4:
The addition of a new machinery to the project which provides a benefit of reduction
of the working capital. Also the extra machinery would provide additional depreciation
deduction for the company which would further reduce the tax liability of the company. If the
base case is considered, the initial outlay of the project is $25000000, while with the purchase
of the extra machinery the initial investment is reduced by $200000 to $24800000. Thus the
initial investment by the company is reduced with the new machinery .
The cash flow from the project increase with the extra machinery in the 1st four years
of the project, highlighting the effect of depreciation tax shield on the project. However, in
the terminal year the cash flow from the project is reduced due to the reduction in the
Paraphrase This Document
Need a fresh take? Get an instant paraphrase of this document with our AI Paraphraser
7FINANCIALS ANALYSIS
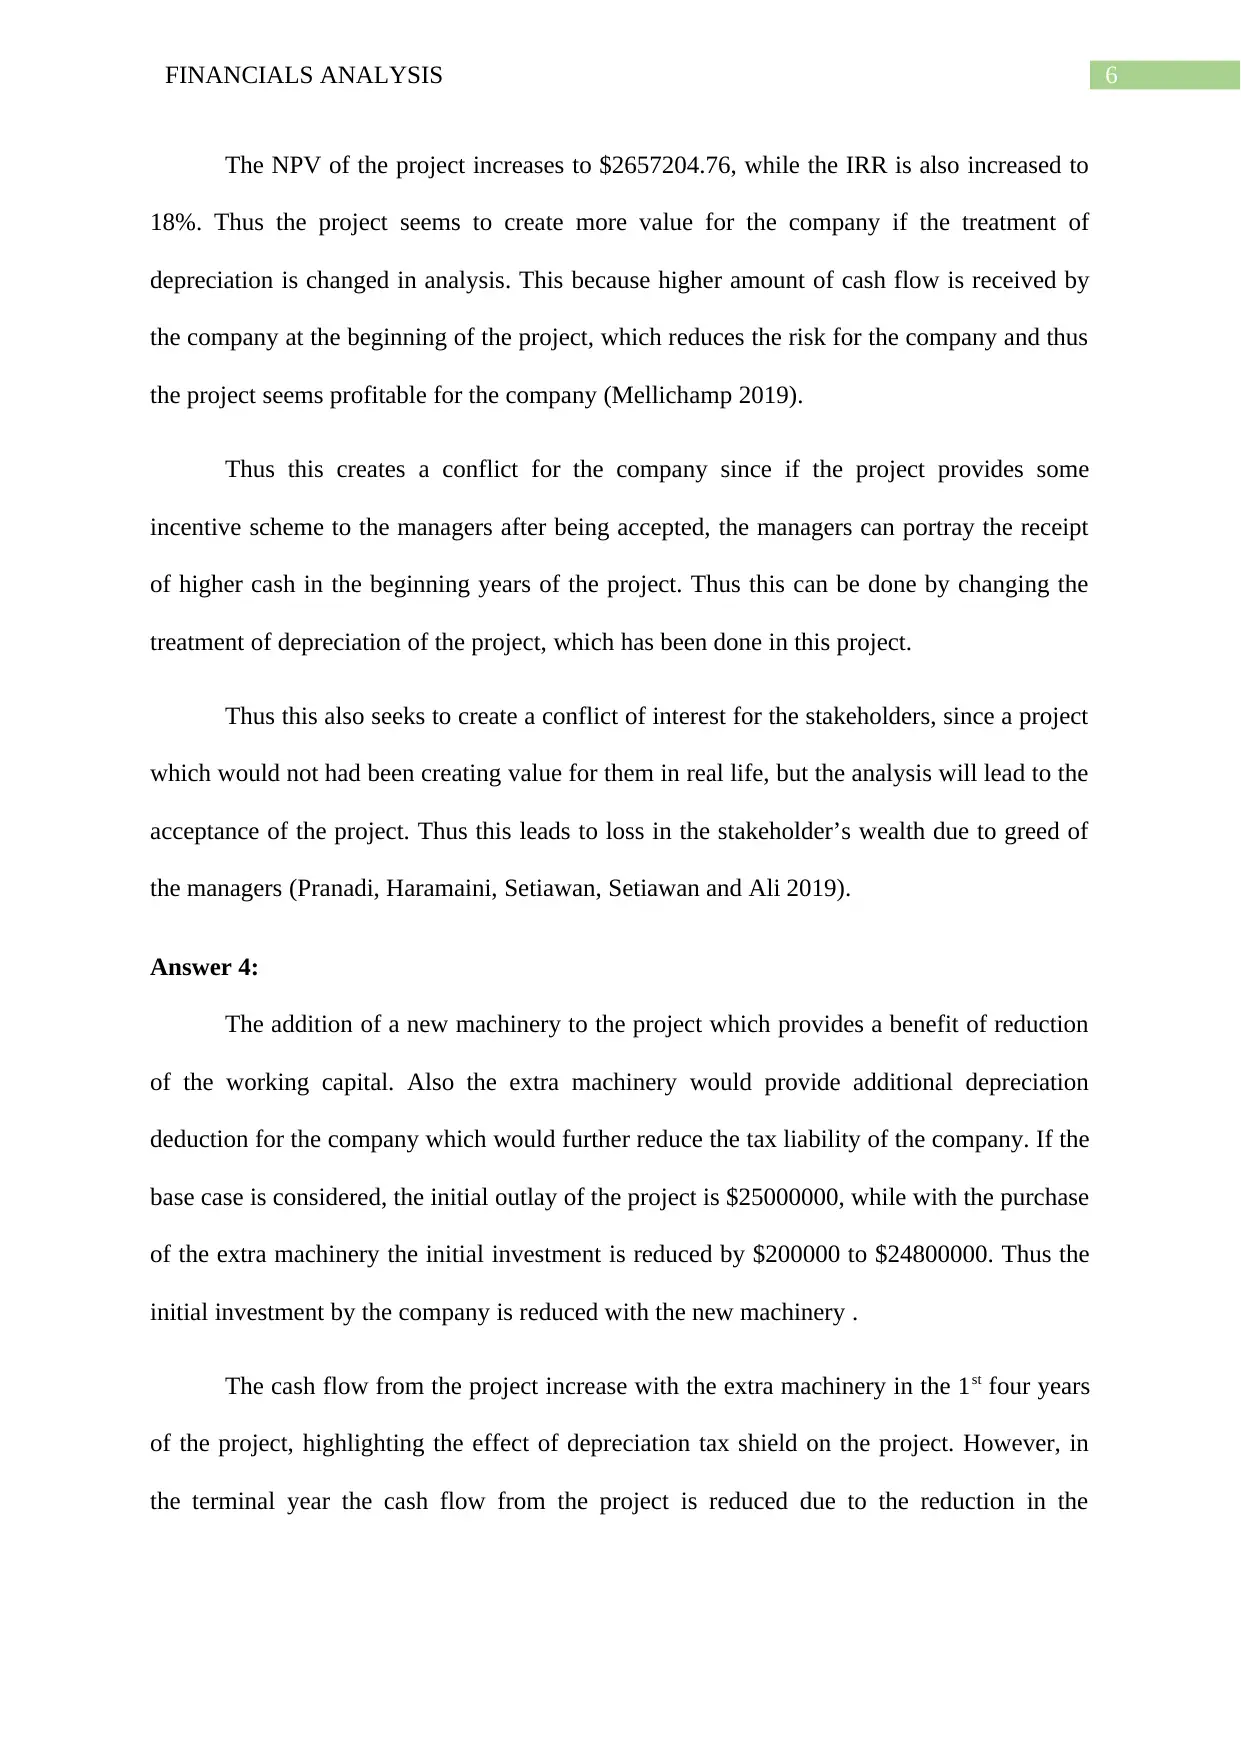
working capital of the project. Thus the project provides a lower terminal cash flow due to
the reduction in the recovery of net working capital.
Figure 5: Effect of new machinery on project
Source: By the Author
The NPV of the project with the addition of the new machinery is $1979057.09, thus
which is a reduction from the NPV in the base case. However, the IRR of the project is same
as the base case at 17%, which can be manipulated with the change in the depreciation
treatment of the project.
Thus upon analysing the above factors and effects, the addition of machinery leads to
reduction in the initial investment but also leads to the reduction of the NPV. Thus the
reduction in the initial investment is around $200000, while the reduction in NPV is $154780.
Thus the benefits of cost reduction is almost same as the reduction in the NPV. Thus the
company should choose the project in which higher NPV is created for the company, which
leads to greater valuation for the company (Nasution, Rahmad and Rusyanto 2018).
8FINANCIALS ANALYSIS
Thus the additional machinery should not be taken by the company as a part of its
project as it leads to the reduction of NPV and ultimately the reduction in the value of the
firm.
Answer to Part B:
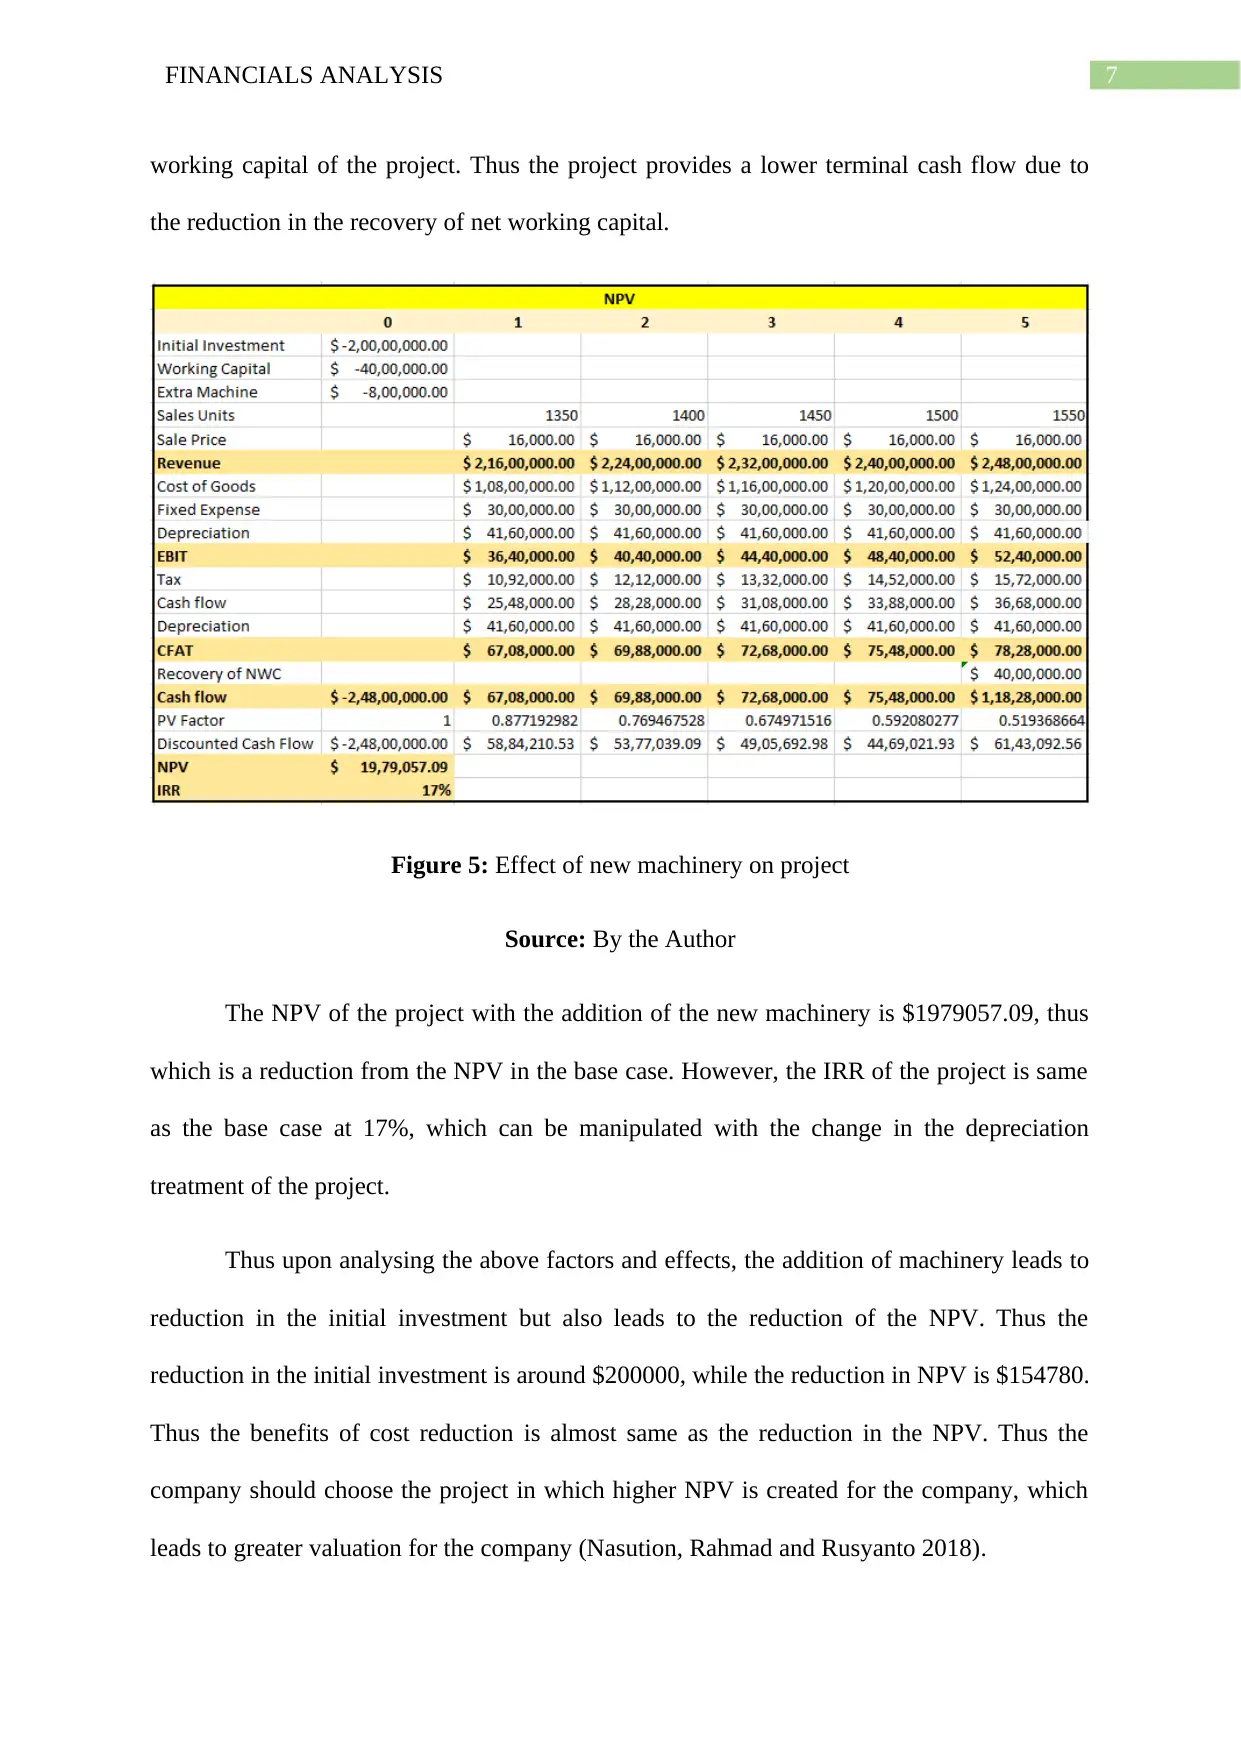
The two project under consideration have the same initial investment and investment
horizon, while the cash flows from the project arrive at different amount. The IRR of the
project depends upon the timing of the cash flows which is received in the project. The earlier
and higher the amount of cash flows of the project, the more higher is the IRR (Magni and
Martin 2017).
Thus the IRR of the two projects is calculated along with the NPV of the project in
the figure below,
Figure 6: NPV and IRR of the Project
Source: By the Author
The IRR of the project A is 14%, since the cash flows from the project is the same as
$260 over the 6 year investment horizon. The IRR from project B is 17%, with variable cash
flows over the investment horizon. The higher amount of IRR is due to early receipt of $480
in project B, which tends to reduce the risk of the project and thus provides a higher IRR.
Thus if the decision to invest in the projects is to be taken as per IRR, both the projects
provide a higher IRR than the hurdle rate. However, project B provides a higher IRR than
project A and needs to be considered for investment (O'Brien 2017).
Thus the additional machinery should not be taken by the company as a part of its
project as it leads to the reduction of NPV and ultimately the reduction in the value of the
firm.
Answer to Part B:
The two project under consideration have the same initial investment and investment
horizon, while the cash flows from the project arrive at different amount. The IRR of the
project depends upon the timing of the cash flows which is received in the project. The earlier
and higher the amount of cash flows of the project, the more higher is the IRR (Magni and
Martin 2017).
Thus the IRR of the two projects is calculated along with the NPV of the project in
the figure below,
Figure 6: NPV and IRR of the Project
Source: By the Author
The IRR of the project A is 14%, since the cash flows from the project is the same as
$260 over the 6 year investment horizon. The IRR from project B is 17%, with variable cash
flows over the investment horizon. The higher amount of IRR is due to early receipt of $480
in project B, which tends to reduce the risk of the project and thus provides a higher IRR.
Thus if the decision to invest in the projects is to be taken as per IRR, both the projects
provide a higher IRR than the hurdle rate. However, project B provides a higher IRR than
project A and needs to be considered for investment (O'Brien 2017).
⊘ This is a preview!⊘
Do you want full access?
Subscribe today to unlock all pages.
Trusted by 1+ million students worldwide
9FINANCIALS ANALYSIS
However, since IRR of the project depends upon the timing of the cash flow and does
not highlight the true and fair value which is created for the company with the projects. A
better analysis is to use the NPV analysis to analyse the value which is created from the
projects for the company. The NPV highlights the value which is created for the company
today by investing in the project, which is calculated by discounting the expected cash flow
from the project (Minnis and Sutherland 2017).
The NPV from project A is $262.74, while the NPV from project B is $218.87, the
NPV is higher from Project A whose IRR is only 14%. Thus upon analysing the projects on
the basis of IRR project B seems to be a desirable investment, however the NPV from the
project is lower at $218.87. Project A has a lower IRR at 14% but the higher NPV at $262.74
makes it a favourable investment for the company (Vanauken, Ascigil and Carraher 2017).
Thus the project which should be selected by the company for the purpose of
investment is project A which should be selected using NPV.
Answer to Part C:
Introduction:
The analysis of the financial statements involves the analysis of the different parts of
the company financials using ratio. Thus the ratio which highlights the different segments of
the company and a trend of the companies past performance is highlighted when analysing
through ratio. Thus the financial analysis of the statements of the company is conducted by
the use of different ratio which seem to provide an overview of the financial health of the
company. Thus, the aim of this report is to provide a thorough financial analysis of the
company which measured through various ratio (Traina 2018).
Paraphrase This Document
Need a fresh take? Get an instant paraphrase of this document with our AI Paraphraser
10FINANCIALS ANALYSIS
Discussion:
Profitability Ratio:
The profitability ratio seeks to provide an analysis of the profitable health of a
company. Thus, profitability of a company is analysed with the use of these ratio and the ratio
which are calculated are the Gross Profit Ratio, Net Profit Ratio, Return on Assets and Return
on Equity.
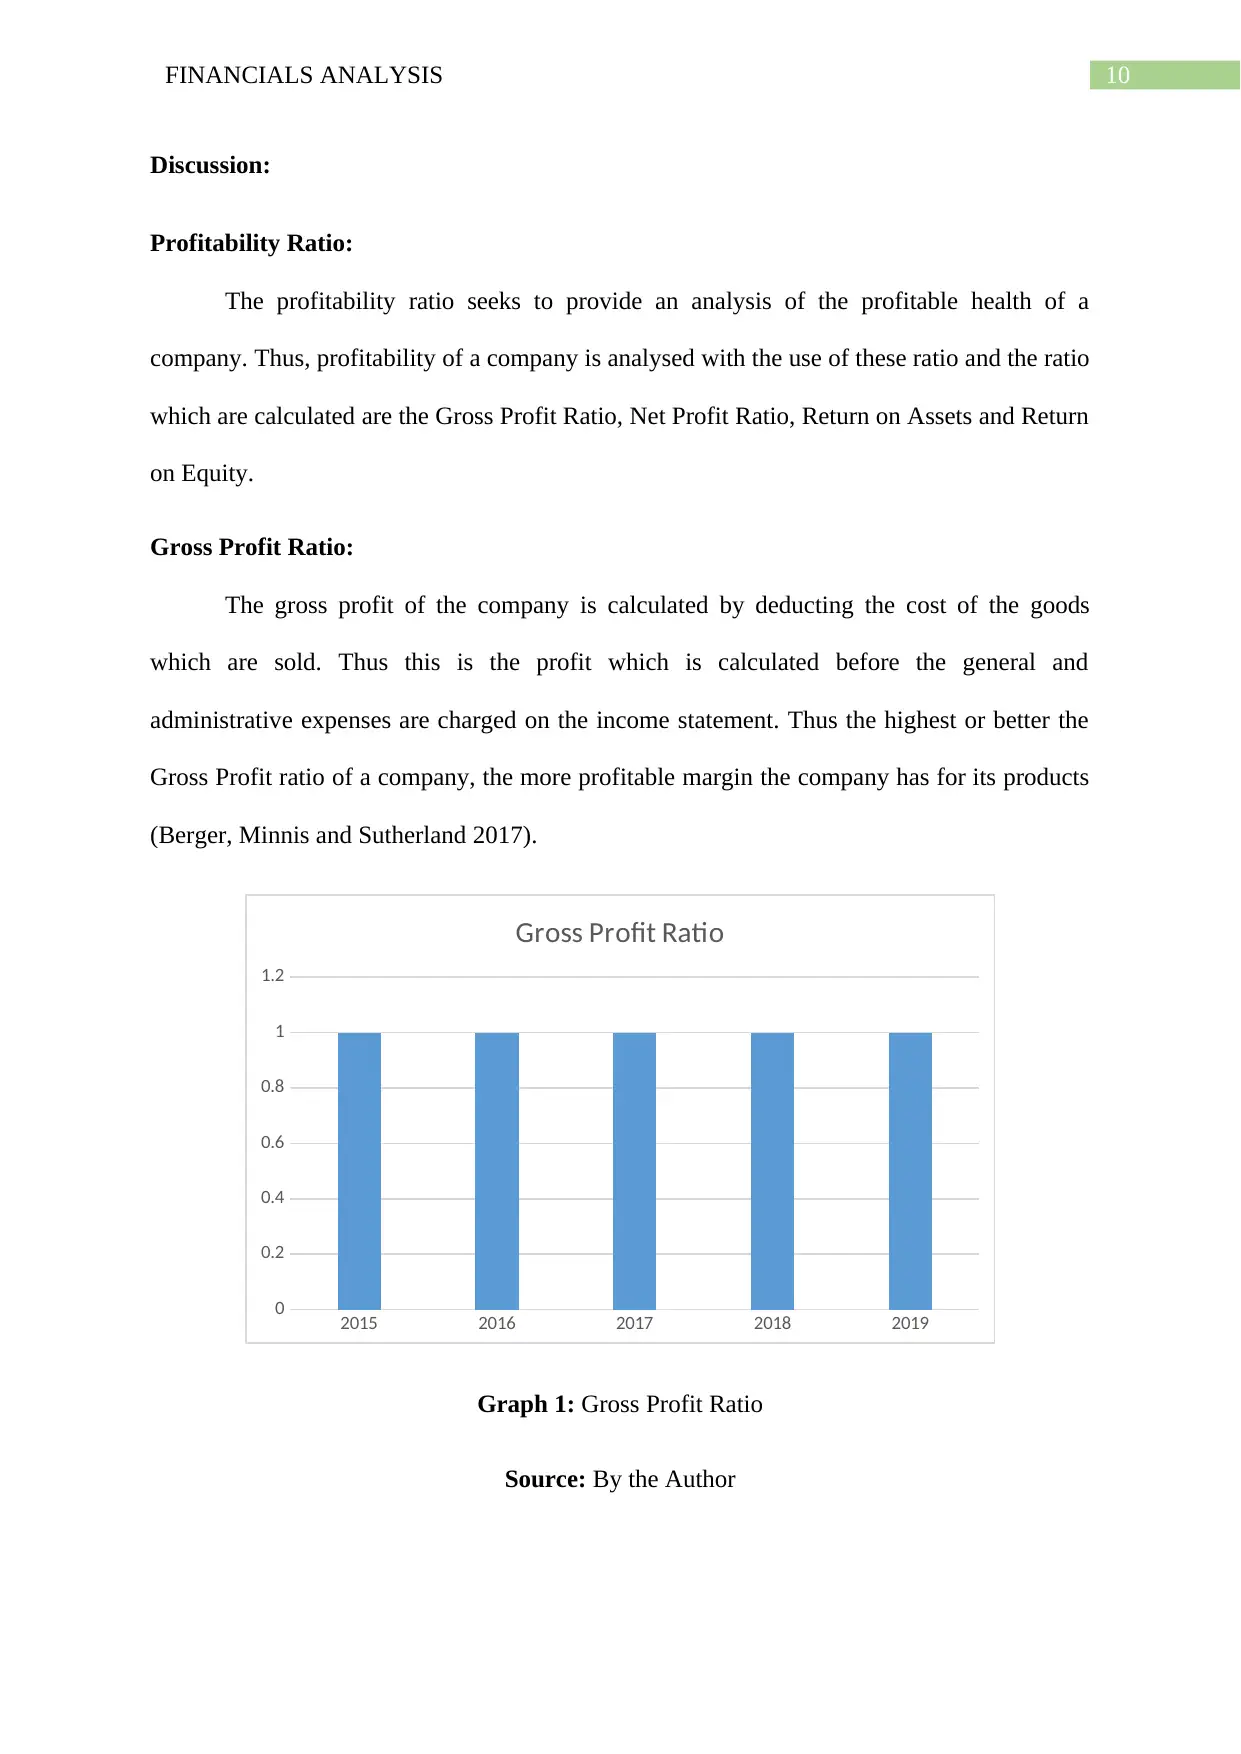
Gross Profit Ratio:
The gross profit of the company is calculated by deducting the cost of the goods
which are sold. Thus this is the profit which is calculated before the general and
administrative expenses are charged on the income statement. Thus the highest or better the
Gross Profit ratio of a company, the more profitable margin the company has for its products
(Berger, Minnis and Sutherland 2017).
2015 2016 2017 2018 2019
0
0.2
0.4
0.6
0.8
1
1.2
Gross Profit Ratio
Graph 1: Gross Profit Ratio
Source: By the Author
Discussion:
Profitability Ratio:
The profitability ratio seeks to provide an analysis of the profitable health of a
company. Thus, profitability of a company is analysed with the use of these ratio and the ratio
which are calculated are the Gross Profit Ratio, Net Profit Ratio, Return on Assets and Return
on Equity.
Gross Profit Ratio:
The gross profit of the company is calculated by deducting the cost of the goods
which are sold. Thus this is the profit which is calculated before the general and
administrative expenses are charged on the income statement. Thus the highest or better the
Gross Profit ratio of a company, the more profitable margin the company has for its products
(Berger, Minnis and Sutherland 2017).
2015 2016 2017 2018 2019
0
0.2
0.4
0.6
0.8
1
1.2
Gross Profit Ratio
Graph 1: Gross Profit Ratio
Source: By the Author
11FINANCIALS ANALYSIS
The Gross Profit ratio of the company is at 100% which is equal to the sales of the
company, because the cost of goods sold of the company is at $0. Thus the company has
100% margin with which it can conduct its business.
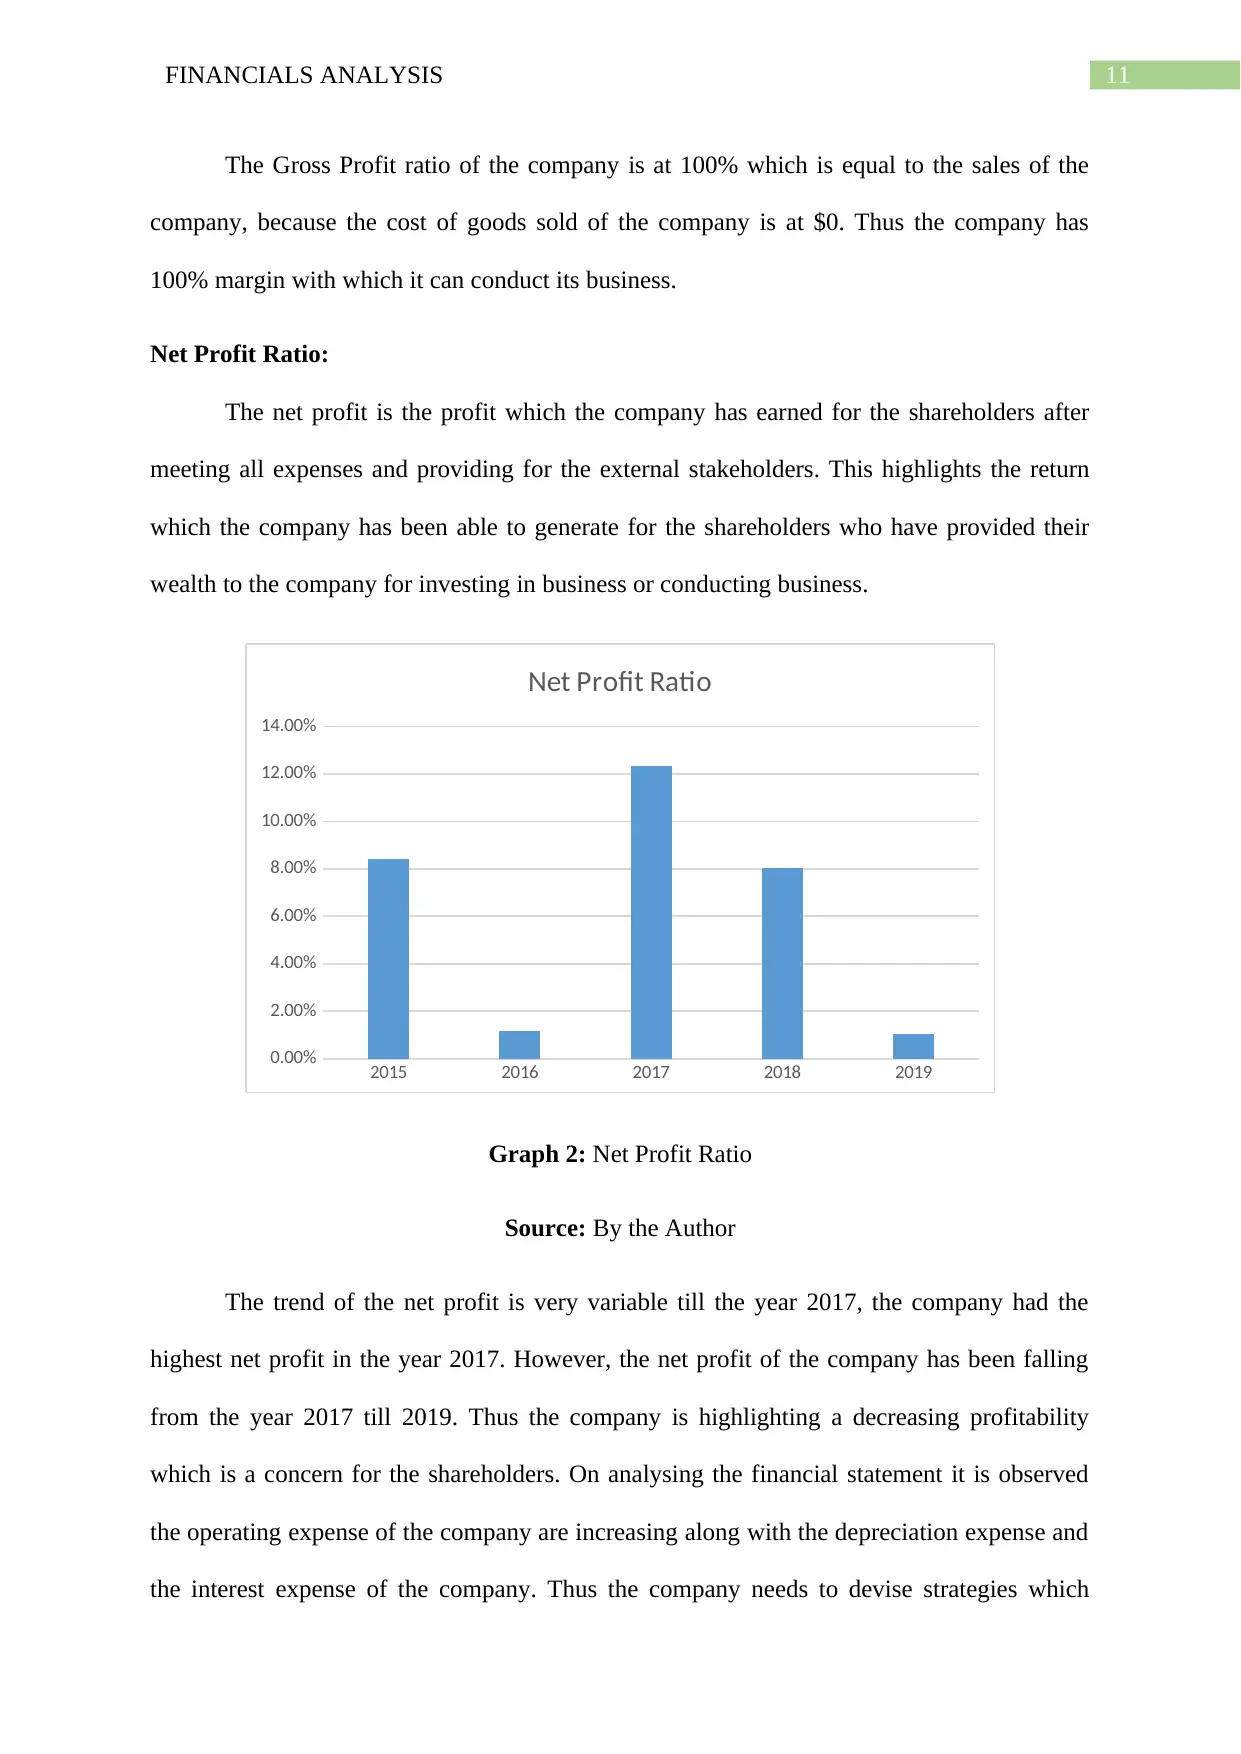
Net Profit Ratio:
The net profit is the profit which the company has earned for the shareholders after
meeting all expenses and providing for the external stakeholders. This highlights the return
which the company has been able to generate for the shareholders who have provided their
wealth to the company for investing in business or conducting business.
2015 2016 2017 2018 2019
0.00%
2.00%
4.00%
6.00%
8.00%
10.00%
12.00%
14.00%
Net Profit Ratio
Graph 2: Net Profit Ratio
Source: By the Author
The trend of the net profit is very variable till the year 2017, the company had the
highest net profit in the year 2017. However, the net profit of the company has been falling
from the year 2017 till 2019. Thus the company is highlighting a decreasing profitability
which is a concern for the shareholders. On analysing the financial statement it is observed
the operating expense of the company are increasing along with the depreciation expense and
the interest expense of the company. Thus the company needs to devise strategies which
The Gross Profit ratio of the company is at 100% which is equal to the sales of the
company, because the cost of goods sold of the company is at $0. Thus the company has
100% margin with which it can conduct its business.
Net Profit Ratio:
The net profit is the profit which the company has earned for the shareholders after
meeting all expenses and providing for the external stakeholders. This highlights the return
which the company has been able to generate for the shareholders who have provided their
wealth to the company for investing in business or conducting business.
2015 2016 2017 2018 2019
0.00%
2.00%
4.00%
6.00%
8.00%
10.00%
12.00%
14.00%
Net Profit Ratio
Graph 2: Net Profit Ratio
Source: By the Author
The trend of the net profit is very variable till the year 2017, the company had the
highest net profit in the year 2017. However, the net profit of the company has been falling
from the year 2017 till 2019. Thus the company is highlighting a decreasing profitability
which is a concern for the shareholders. On analysing the financial statement it is observed
the operating expense of the company are increasing along with the depreciation expense and
the interest expense of the company. Thus the company needs to devise strategies which
⊘ This is a preview!⊘
Do you want full access?
Subscribe today to unlock all pages.
Trusted by 1+ million students worldwide
1 out of 26
Related Documents


Your All-in-One AI-Powered Toolkit for Academic Success.
+13062052269
info@desklib.com
Available 24*7 on WhatsApp / Email
![[object Object]](/_next/static/media/star-bottom.7253800d.svg)
Unlock your academic potential
Copyright © 2020–2026 A2Z Services. All Rights Reserved. Developed and managed by ZUCOL.