Accounting for Business: Financial Statement and Ratio Analysis
VerifiedAdded on 2022/11/24
|10
|1625
|255
Homework Assignment
AI Summary
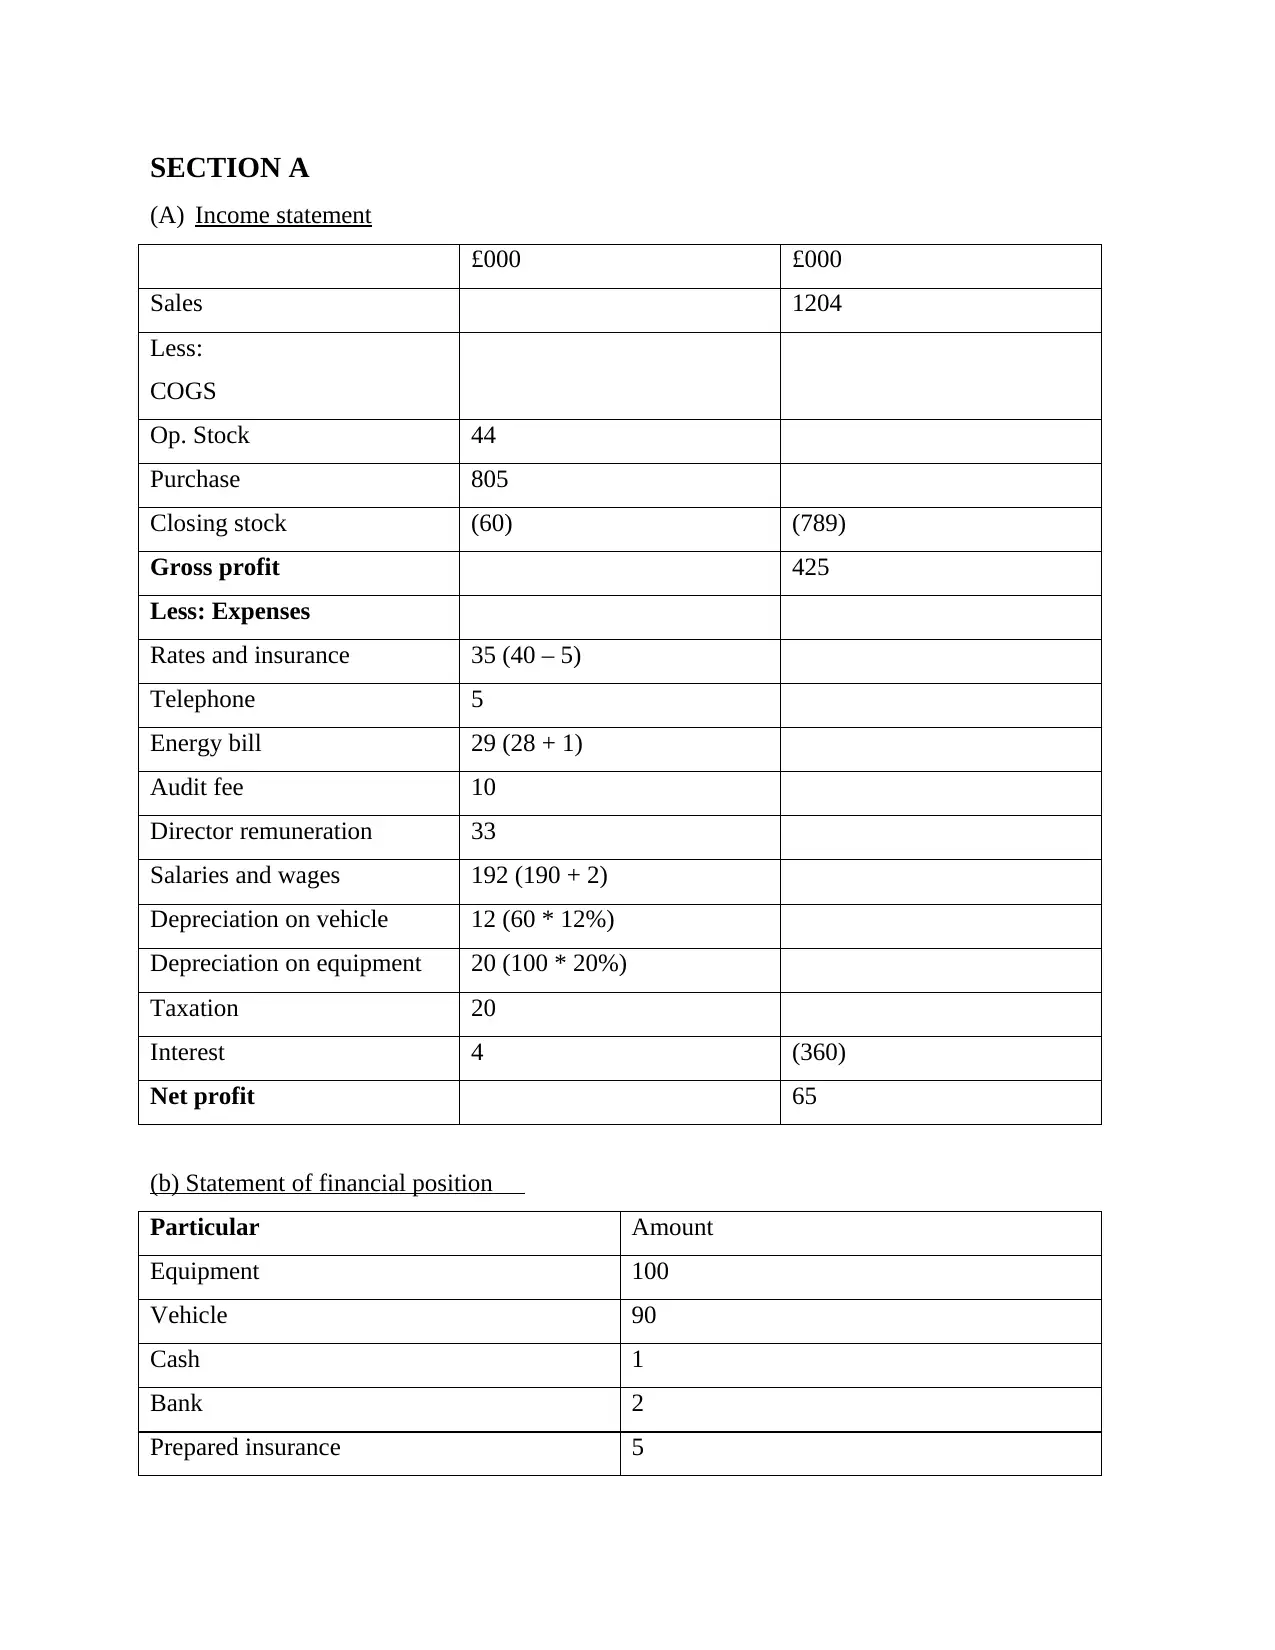
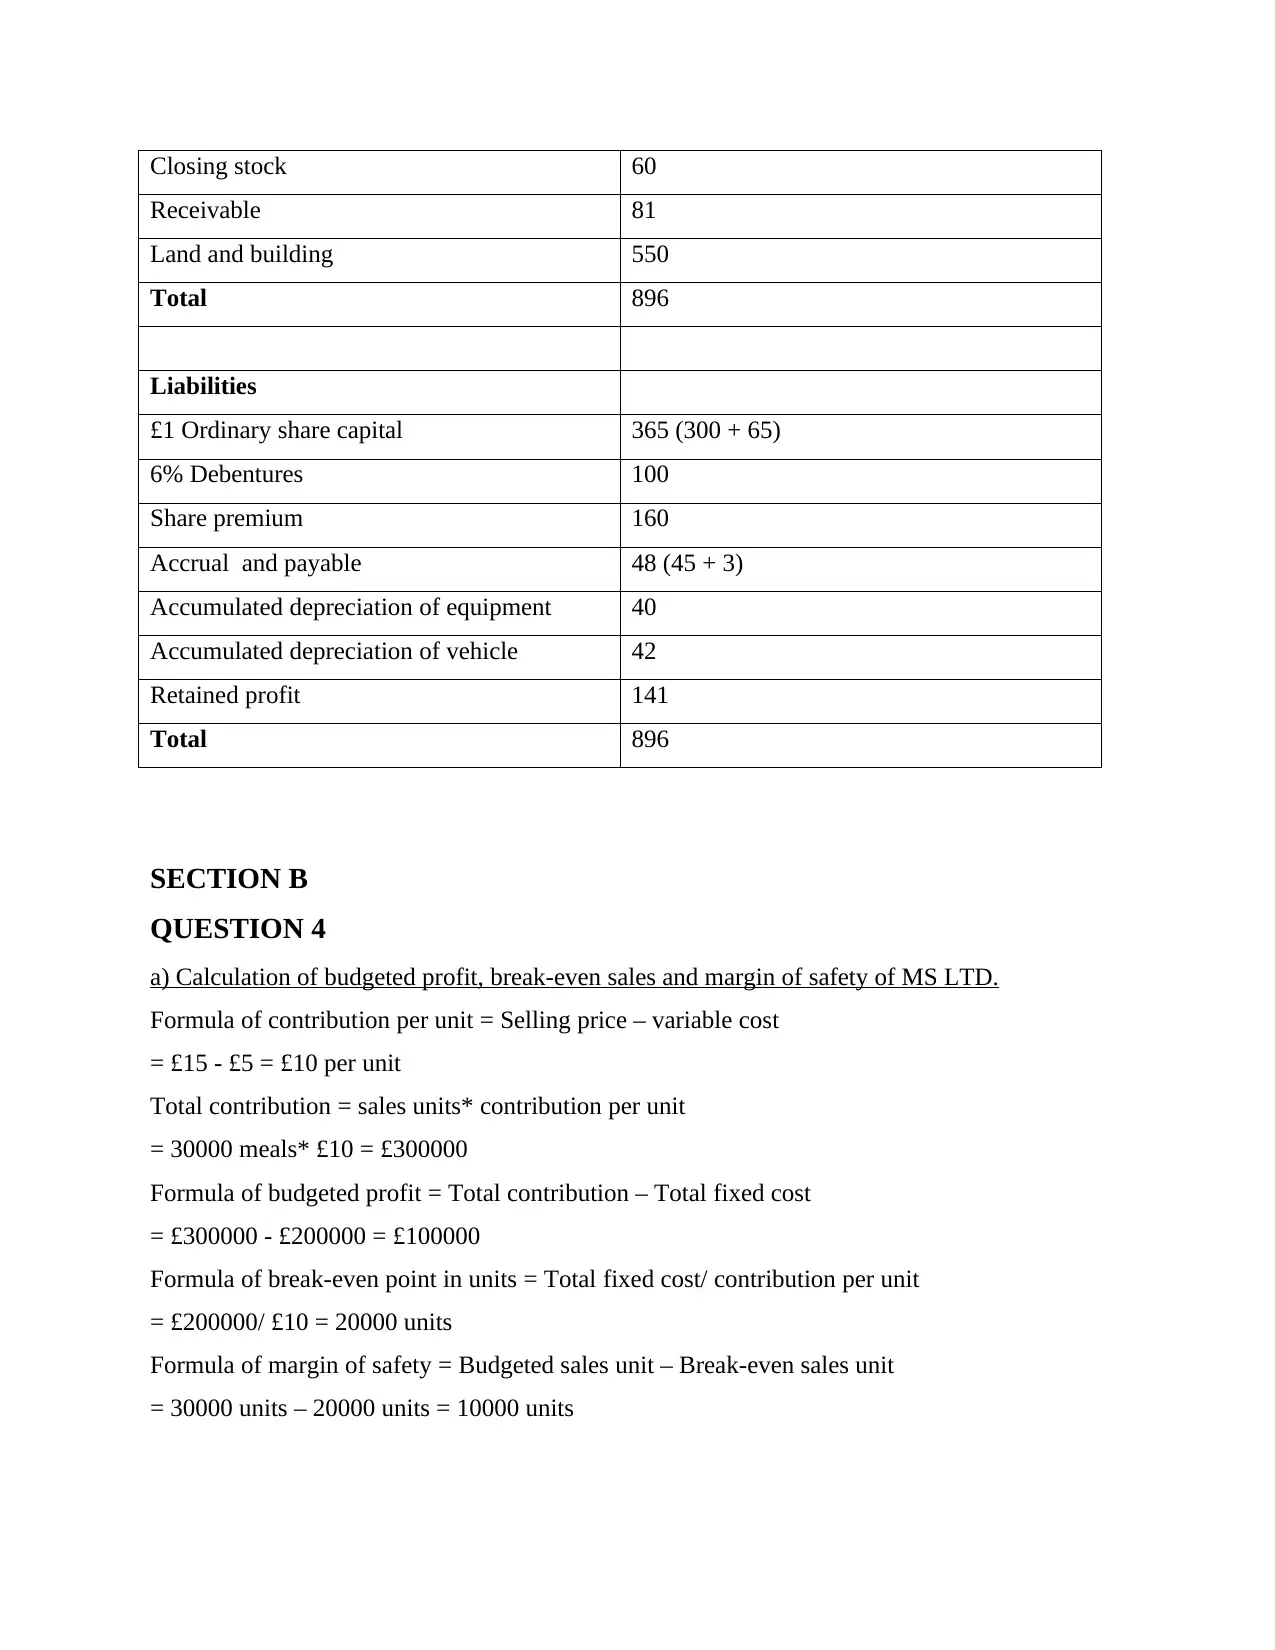
This accounting assignment delves into comprehensive financial analysis, encompassing the creation of income statements and statements of financial position. It presents detailed calculations of profitability ratios, including gross profit and net profit margins, and liquidity ratios like current and acid-test ratios, applied to the case of RAP LTD. Furthermore, the assignment explores break-even analysis, margin of safety calculations, and the impact of changes in selling prices on a company's financial performance, demonstrated through the analysis of MS LTD. Critical discussions on company performance based on calculated ratios are included, along with assumptions, limitations and recommendations for improvement. The assignment provides a practical application of accounting principles to assess financial health and make informed business decisions, supported by relevant references.
Contribute Materials
Your contribution can guide someone’s learning journey. Share your
documents today.

ACCOUNTING FOR
BUSINESS
BUSINESS
Secure Best Marks with AI Grader
Need help grading? Try our AI Grader for instant feedback on your assignments.

Table of Contents
SECTION A.....................................................................................................................................3
(A) Income statement...............................................................................................................3
(b) Statement of financial position..............................................................................................3
SECTION B.....................................................................................................................................4
QUESTION 4..................................................................................................................................4
a) Calculation of budgeted profit, break-even sales and margin of safety of MS LTD..............4
b) Calculation of sales unit required to make a profit of £..........................................................5
c) Calculation of new profit, break-even point and margin of safety..........................................5
d) Assumption and limitation apply in above calculations..........................................................5
QUESTION 5..................................................................................................................................6
a) Calculation of Ratios for RAP LTD........................................................................................6
b) Critical discussion on the performance of RAP LTD.............................................................7
REFERENCES................................................................................................................................1

SECTION A
(A) Income statement
£000 £000
Sales 1204
Less:
COGS
Op. Stock 44
Purchase 805
Closing stock (60) (789)
Gross profit 425
Less: Expenses
Rates and insurance 35 (40 – 5)
Telephone 5
Energy bill 29 (28 + 1)
Audit fee 10
Director remuneration 33
Salaries and wages 192 (190 + 2)
Depreciation on vehicle 12 (60 * 12%)
Depreciation on equipment 20 (100 * 20%)
Taxation 20
Interest 4 (360)
Net profit 65
(b) Statement of financial position
Particular Amount
Equipment 100
Vehicle 90
Cash 1
Bank 2
Prepared insurance 5

Closing stock 60
Receivable 81
Land and building 550
Total 896
Liabilities
£1 Ordinary share capital 365 (300 + 65)
6% Debentures 100
Share premium 160
Accrual and payable 48 (45 + 3)
Accumulated depreciation of equipment 40
Accumulated depreciation of vehicle 42
Retained profit 141
Total 896
SECTION B
QUESTION 4
a) Calculation of budgeted profit, break-even sales and margin of safety of MS LTD.
Formula of contribution per unit = Selling price – variable cost
= £15 - £5 = £10 per unit
Total contribution = sales units* contribution per unit
= 30000 meals* £10 = £300000
Formula of budgeted profit = Total contribution – Total fixed cost
= £300000 - £200000 = £100000
Formula of break-even point in units = Total fixed cost/ contribution per unit
= £200000/ £10 = 20000 units
Formula of margin of safety = Budgeted sales unit – Break-even sales unit
= 30000 units – 20000 units = 10000 units
Secure Best Marks with AI Grader
Need help grading? Try our AI Grader for instant feedback on your assignments.

b) Calculation of sales unit required to make a profit of £
Formula of contribution required = Profit required + Fixed cost
= £225000 + £200000 = £425000
Formula of sales unit required = Total contribution/ contribution per unit
= £425000/ 10 = 42500 units
c) Calculation of new profit, break-even point and margin of safety
The new selling price is reduced by £2 which means the new selling price is £13
Formula of contribution per unit = Selling price – variable cost
= £13 - £5 = £8 per unit
Total contribution = sales units* contribution per unit
= 30000 meals* £8 = £240000
Formula of budgeted profit = Total contribution – Total fixed cost
= £240000 - £200000 = £40000
Formula of break-even point in units = Total fixed cost/ contribution per unit
= £200000/ £8 = 25000 units
Formula of margin of safety = Budgeted sales unit – Break-even sales unit
= 30000 units – 25000 units = 5000 units
Comment on this new strategy of company
Because of the reduction in the selling price of the units, the new breakeven sales units will
get increase to 25000 units and on the other hand the margin of safety in new strategy get reduce
to 5000 units. That’s why it is advisable to the company that they do not reduce their selling
price without maintaining their variable and fixed cost. The company have to adopt the proper
and appropriate strategy for increasing their sales value and decreasing their cost. This is
happened because the fixed cost and the variable cost per unit remain constant in the new
strategy which is not possible in reality (Sintha, 2020).
d) Assumption and limitation apply in above calculations
In the above calculation, the following assumption is being taken and this include:
All costs can be analysed into fixed and variable costs

The sales volume, variable costs/unit, the contribution/unit and the total fixed costs are
expected to remain constant within the relevant range.
All production is expected to be sold (i.e., inventory levels remain constant)
All other factors e.g., advertising and marketing methods, production method,
distribution method is expected to remain constant.
Production and sales mix remain constant – the variable costs, the total fixed costs and
C/S ratio for production and sales mix will be held constant (Jones and et.al., 2019).
QUESTION 5
a) Calculation of Ratios for RAP LTD.
Particular/ Ratios Formula Industry ratio
as on
30/06/2019
Company
ratio as on
30//2020
(£000)
Gross profit Net sales – cost of sales 1800
Net profit Gross profit - expenses 1000
Net sales 4000
Current assets Inventory + receivable + cash at bank 520
Current liabilities payables 280
Trade receivable 220
Inventory 270
Trade payables 280
Cost of sales 2200
Quick assets Current assets - inventory 250
Gross Profit Ratio Gross Profit/Net sales* 100 40% 45%
Net Profit Ratio Net Profit/ Net sales* 100 26% 25%
Current Ratio Current Assets/ current liabilities 1.9:1 1.9:1
Acid test ratio/
Quick ratio
Quick asset/ current liabilities 0.9:1 0.9:1
Receivable Trade receivable/ net sales* 365 16 days 20 days

collection period
(days)
Inventory holding
period (days)
Inventory/ cost of sales* 365 46 days 45 days
Payable payment
period (days)
Trade payables/ cost of sales* 365 30 days 46 days
b) Critical discussion on the performance of RAP LTD.
Interpretation of ratio
Profitability ratio: From the above calculation, it is identified that the company gross
profit and net profit ratio is 45% and 25% respectively. While on the other hand, the
industry gross profit and net profit ratio is 40% and 26% respectively. This clearly
interpretate that the company is able to manage their cost of productions in order to earn
high gross profit. But though the net profit of the company is low as compared to
industrial trend this means that the marketing and selling & distribution expense is high
and that need special attention of the marketing experts of the company. This will require
that the company need to put their focus on fixed marketing expense (Mostafa,
Montemagno and Qureshi, 2018).
Liquidity ratio: The current ratio and acid test ratio of the RAP company is 1.9:1 and
0.9:1 respectively and on the other hand the current ratio and acid-test ration of the
industry for the same period is also 1.9:1 and 0.9:1 respectively. This means that the
company is able to maintain its liquidity position and also able to pay it short-term
obligation without using the long-term assets. This quick ratio indicate that the company
is able to pay it trade payables by using only cash and trade receivable and they need not
to collect funds from the market to pay its short-term obligations (Zavadskas and et.al.,
2018).
Efficiency ratio: The efficiency ratio includes the collection period, payable period and
holding period. The receivable collection period of the company is 20 days which is high
and the payable payment period of the company is 46 days is also high and on the other
hand the inventory holding days is 45 days which is low. So, this indicate that the
Paraphrase This Document
Need a fresh take? Get an instant paraphrase of this document with our AI Paraphraser

company’s collection period is poor but on the other side it inventory holding period and
payables payment period is better (Liu and et.al., 2020).
Recommendation to
From the above calculation and interpretation, it is recommendable to the company that they
must need to adopt the strategies with the help of which they can improve their sales volume and
also decrease their marketing and distribution cost in order to improve their profitability (Liu and
et.al., 2020). Along with that it is also recommendable to the company that they must provide
discount facility to their customers that make earlier payment in order to reduce their trade
receivable collection period.

REFERENCES
Books and journals
Zavadskas, E. K. and et.al., 2018. A novel multicriteria approach–rough step-wise weight
assessment ratio analysis method (R-SWARA) and its application in logistics. Studies in
Informatics and Control. 27(1). pp.97-106.
Liu, H. and et.al., 2020. CNHO and mineral element stable isotope ratio analysis for
authentication in tea. Journal of Food Composition and Analysis. 91. p.103513.
Mostafa, K. G., Montemagno, C. and Qureshi, A. J., 2018. Strength to cost ratio analysis of
FDM Nylon 12 3D Printed Parts. Procedia Manufacturing. 26. pp.753-762.
Sintha, L., 2020. Importance of Break-Even Analysis for the Micro, Small and Medium
Enterprises. International Journal of Research-Granthaalayah. 8(6).
Jones, C. A. and et.al., 2019. Cost breakeven analysis of cis-lunar ISRU for propellant. In AIAA
Scitech 2019 Forum (p. 1372).
1

2
1 out of 10
Related Documents

Your All-in-One AI-Powered Toolkit for Academic Success.
+13062052269
info@desklib.com
Available 24*7 on WhatsApp / Email
Unlock your academic potential
© 2024 | Zucol Services PVT LTD | All rights reserved.