Financial Statement and Cash Flow Analysis - System 0032 Assignment
VerifiedAdded on 2022/10/02
|13
|1978
|28
Homework Assignment
AI Summary
This document provides a comprehensive solution to a finance assignment focusing on financial statement and cash flow analysis. The assignment includes multiple-choice questions covering a wide range of topics, such as the income statement, balance sheet, and cash flow statement. It delves into key financial ratios like the quick ratio, debt-to-equity ratio, return on assets, and return on equity. The solution includes detailed workings and explanations for each question, ensuring a thorough understanding of financial concepts and calculations. Furthermore, the assignment touches upon topics like operating cash flow, free cash flow, and the impact of financial leverage. The provided answers are designed to help students master financial statement analysis and excel in their financial management coursework.
RUNNING HEAD: FINANCIAL STATEMENT AND CASH FLOW ANALYSIS
0
Financial Statement and Cash flow analysis
[Type the document subtitle]
System 0032
[Pick the date]
0
Financial Statement and Cash flow analysis
[Type the document subtitle]
System 0032
[Pick the date]
Paraphrase This Document
Need a fresh take? Get an instant paraphrase of this document with our AI Paraphraser
Financial Statement and cash flow analysis
1
Multiple Choices
1. c. sales
It is shown in the income statement as revenue, revenue is the amount generated from
sales. This value is associated with the costs of providing services or creating goods and
services.
2. c. Total Equity
From the company’s total assets and total debts, total equity can be calculated as the
formula for calculating total equity is:
Here liabilities of the company are total debt of the company. Further, all these items are
the part of balance sheet.
Total Equity = Assets - Liabilities
3. a. EBIT- taxes + depreciation
Operating cash flow is the cash that business generates from its operations and core
activities by deducting operating expenses from the revenue generated by the company.
This shows the total cash generated from the operations not including any other source of
revenue.
Operating cash flows= Net Income +/- changes in liabilities and assets + non-cash
expenses or EBIT – taxes + depreciation
4. b. The company acquires inventory
Cash outflow is a situation when cash goes outside the business because of some
transactions related to business expenses or investment. When company sells machine
cash comes in and machine goes out. When company acquire inventory cash need to be
paid to supplier and inventory comes in so in this case cash outflows. When company
receive bank loan, debt of company increases and cash comes in.
Financial Statement and cash flow analysis
2
5. a. Quick ratio
Liquidity ratio shows the ability of business to pay of its short term debt without raising
cash from external sources. Liquidity ratio includes current ratio, quick ratio and day
sales outstanding.
6. c. $226,000
Operating cash flows= EBIT-taxes + depreciation
$245,000- $84,000+ $65,000
$226,000
7. a. 0.5645
Quick ratio = Cash + cash equivalents + short term investments + current
receivables/current liabilities
$50,000 + $125,000/ $185,000+$125,000
$175,000/310,000
=0.5645161
8. d. 86.90 days
The average collection period is the time that business takes in order to collect the
payment from the debtors.
Average collection period: account receivables /net sales*365
$125,000/$525,000*365
86.90 days
9. c. 11.90
P/E ratio is the price to earnings ratio that is calculated by the company in order to know
the value of current share price in comparison to earning per share.
P/E ratio = Market value per share/ earnings per share
Earnings per share = net income / outstanding common share
$126,000/100,000= $1.26
⊘ This is a preview!⊘
Do you want full access?
Subscribe today to unlock all pages.
Trusted by 1+ million students worldwide
Financial Statement and cash flow analysis
3
P/E ratio= $15/$1.26
11.90
10. d. 24%
Net profit margin is considered as the percentage of revenue remaining after all expenses
subtracted from sales during the year.
Net profit margin= Net income/ revenue * 100
$126,000/$525,000*100
24%
11. a. 0.23
Debt to equity ratio is the percentage of debt or portion of debt in the total liabilities of
the company. The ideal debt to equity ratio is 2:1.
Debt/equity ratio= Total liabilities/ total shareholders’ equity
Here, Total liabilities= long term debt
Total shareholders’ equity= common stock + retained earnings
$115,000/$500,000
0.23
12. c. 13.62
Return on assets is the indicator of how profitable the company is as per the assets. This
indicates the company efficiency of using assets in order to maximize earnings.
Return on assets= net income/ total assets
$126,000/$925,000*100
13.62%
Paraphrase This Document
Need a fresh take? Get an instant paraphrase of this document with our AI Paraphraser
Financial Statement and cash flow analysis
4
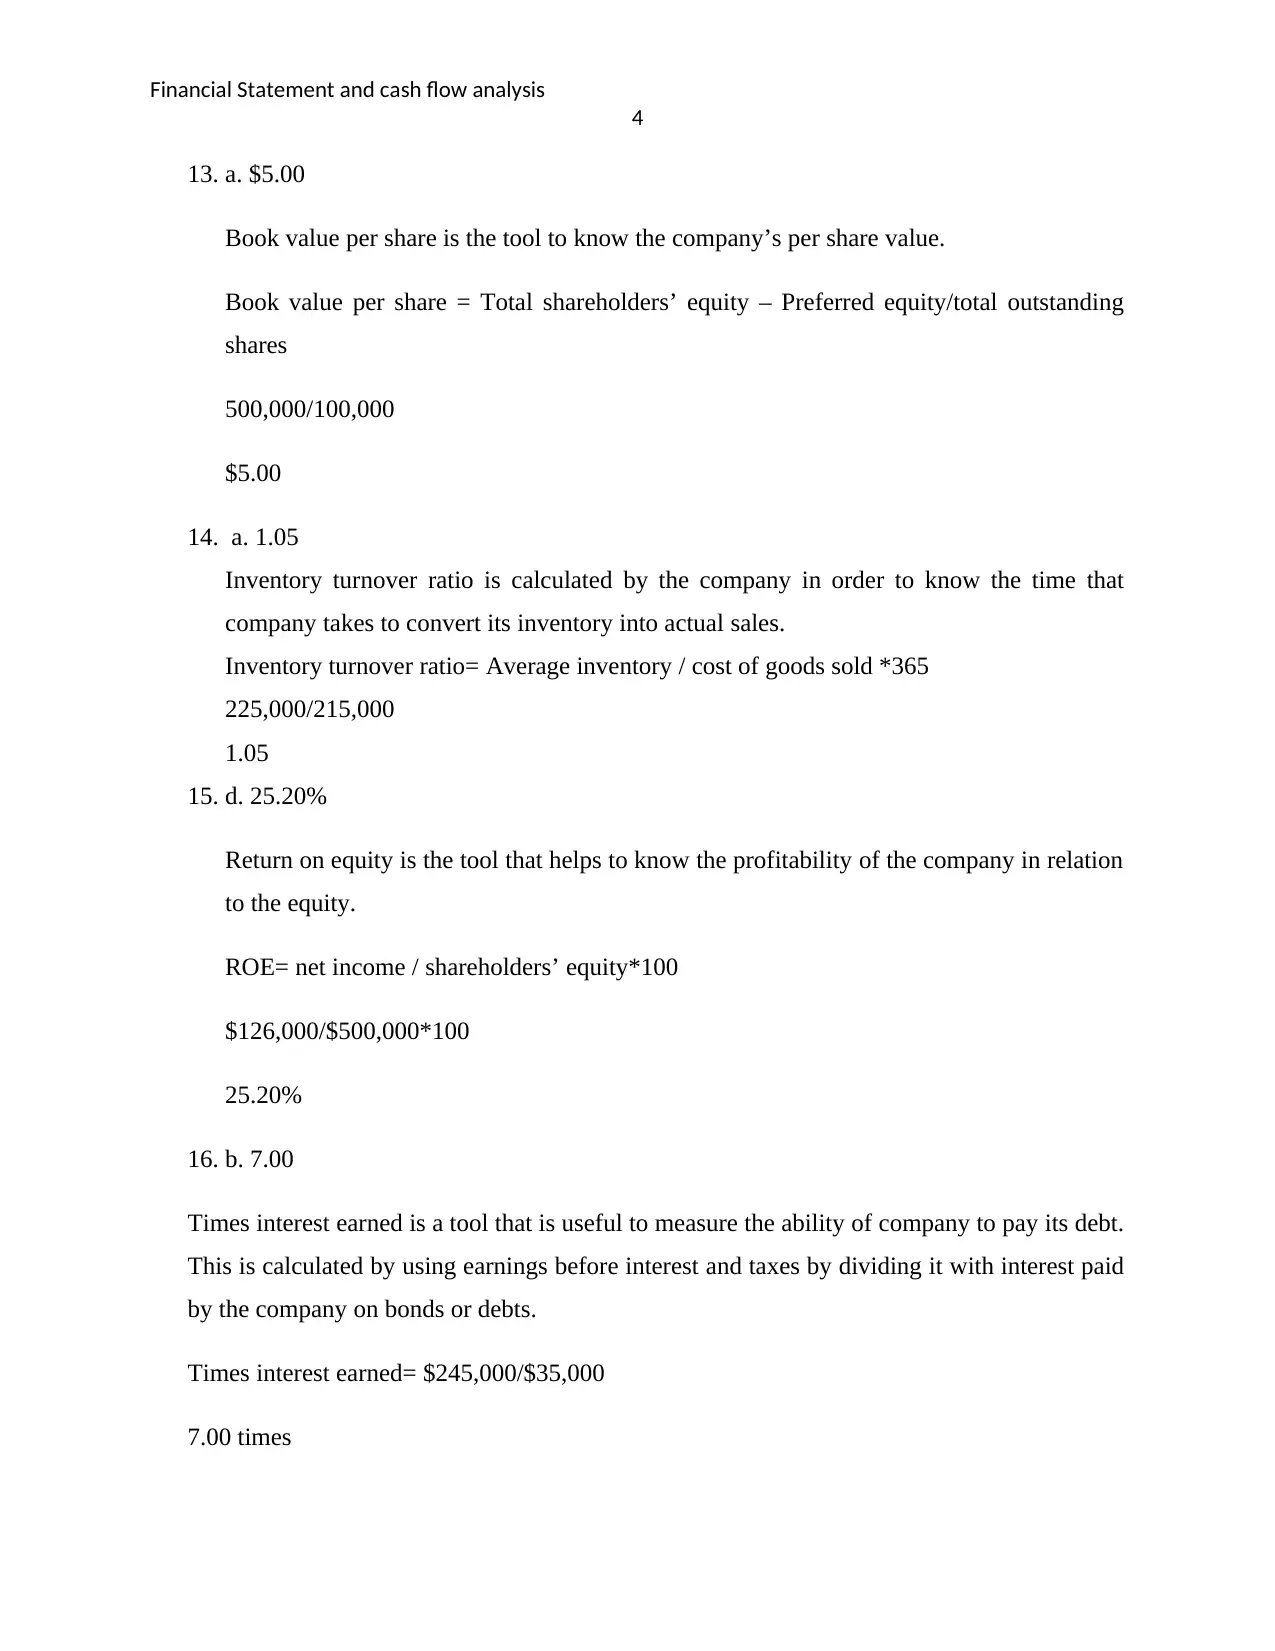
13. a. $5.00
Book value per share is the tool to know the company’s per share value.
Book value per share = Total shareholders’ equity – Preferred equity/total outstanding
shares
500,000/100,000
$5.00
14. a. 1.05
Inventory turnover ratio is calculated by the company in order to know the time that
company takes to convert its inventory into actual sales.
Inventory turnover ratio= Average inventory / cost of goods sold *365
225,000/215,000
1.05
15. d. 25.20%
Return on equity is the tool that helps to know the profitability of the company in relation
to the equity.
ROE= net income / shareholders’ equity*100
$126,000/$500,000*100
25.20%
16. b. 7.00
Times interest earned is a tool that is useful to measure the ability of company to pay its debt.
This is calculated by using earnings before interest and taxes by dividing it with interest paid
by the company on bonds or debts.
Times interest earned= $245,000/$35,000
7.00 times
4
13. a. $5.00
Book value per share is the tool to know the company’s per share value.
Book value per share = Total shareholders’ equity – Preferred equity/total outstanding
shares
500,000/100,000
$5.00
14. a. 1.05
Inventory turnover ratio is calculated by the company in order to know the time that
company takes to convert its inventory into actual sales.
Inventory turnover ratio= Average inventory / cost of goods sold *365
225,000/215,000
1.05
15. d. 25.20%
Return on equity is the tool that helps to know the profitability of the company in relation
to the equity.
ROE= net income / shareholders’ equity*100
$126,000/$500,000*100
25.20%
16. b. 7.00
Times interest earned is a tool that is useful to measure the ability of company to pay its debt.
This is calculated by using earnings before interest and taxes by dividing it with interest paid
by the company on bonds or debts.
Times interest earned= $245,000/$35,000
7.00 times
Financial Statement and cash flow analysis
5
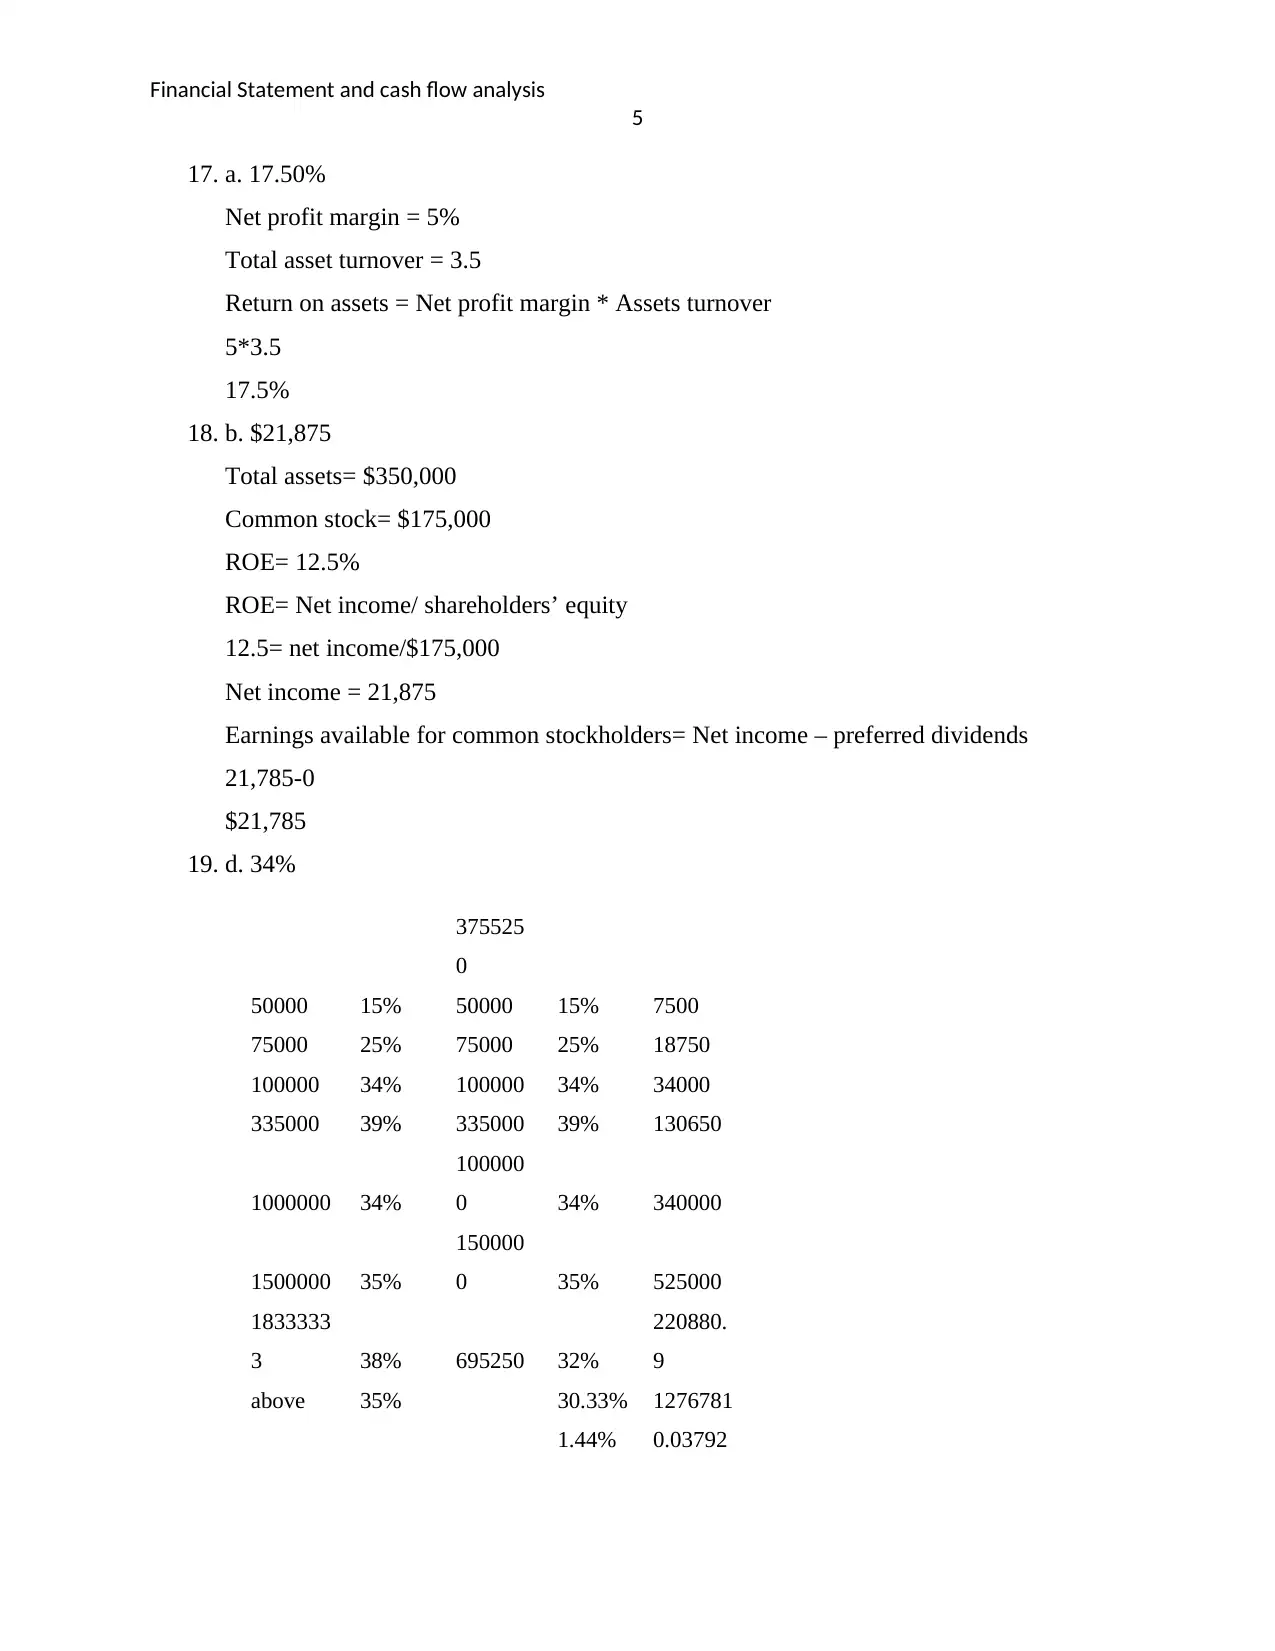
17. a. 17.50%
Net profit margin = 5%
Total asset turnover = 3.5
Return on assets = Net profit margin * Assets turnover
5*3.5
17.5%
18. b. $21,875
Total assets= $350,000
Common stock= $175,000
ROE= 12.5%
ROE= Net income/ shareholders’ equity
12.5= net income/$175,000
Net income = 21,875
Earnings available for common stockholders= Net income – preferred dividends
21,785-0
$21,785
19. d. 34%
375525
0
50000 15% 50000 15% 7500
75000 25% 75000 25% 18750
100000 34% 100000 34% 34000
335000 39% 335000 39% 130650
1000000 34%
100000
0 34% 340000
1500000 35%
150000
0 35% 525000
1833333
3 38% 695250 32%
220880.
9
above 35% 30.33% 1276781
1.44% 0.03792
5
17. a. 17.50%
Net profit margin = 5%
Total asset turnover = 3.5
Return on assets = Net profit margin * Assets turnover
5*3.5
17.5%
18. b. $21,875
Total assets= $350,000
Common stock= $175,000
ROE= 12.5%
ROE= Net income/ shareholders’ equity
12.5= net income/$175,000
Net income = 21,875
Earnings available for common stockholders= Net income – preferred dividends
21,785-0
$21,785
19. d. 34%
375525
0
50000 15% 50000 15% 7500
75000 25% 75000 25% 18750
100000 34% 100000 34% 34000
335000 39% 335000 39% 130650
1000000 34%
100000
0 34% 340000
1500000 35%
150000
0 35% 525000
1833333
3 38% 695250 32%
220880.
9
above 35% 30.33% 1276781
1.44% 0.03792
⊘ This is a preview!⊘
Do you want full access?
Subscribe today to unlock all pages.
Trusted by 1+ million students worldwide
Financial Statement and cash flow analysis
6
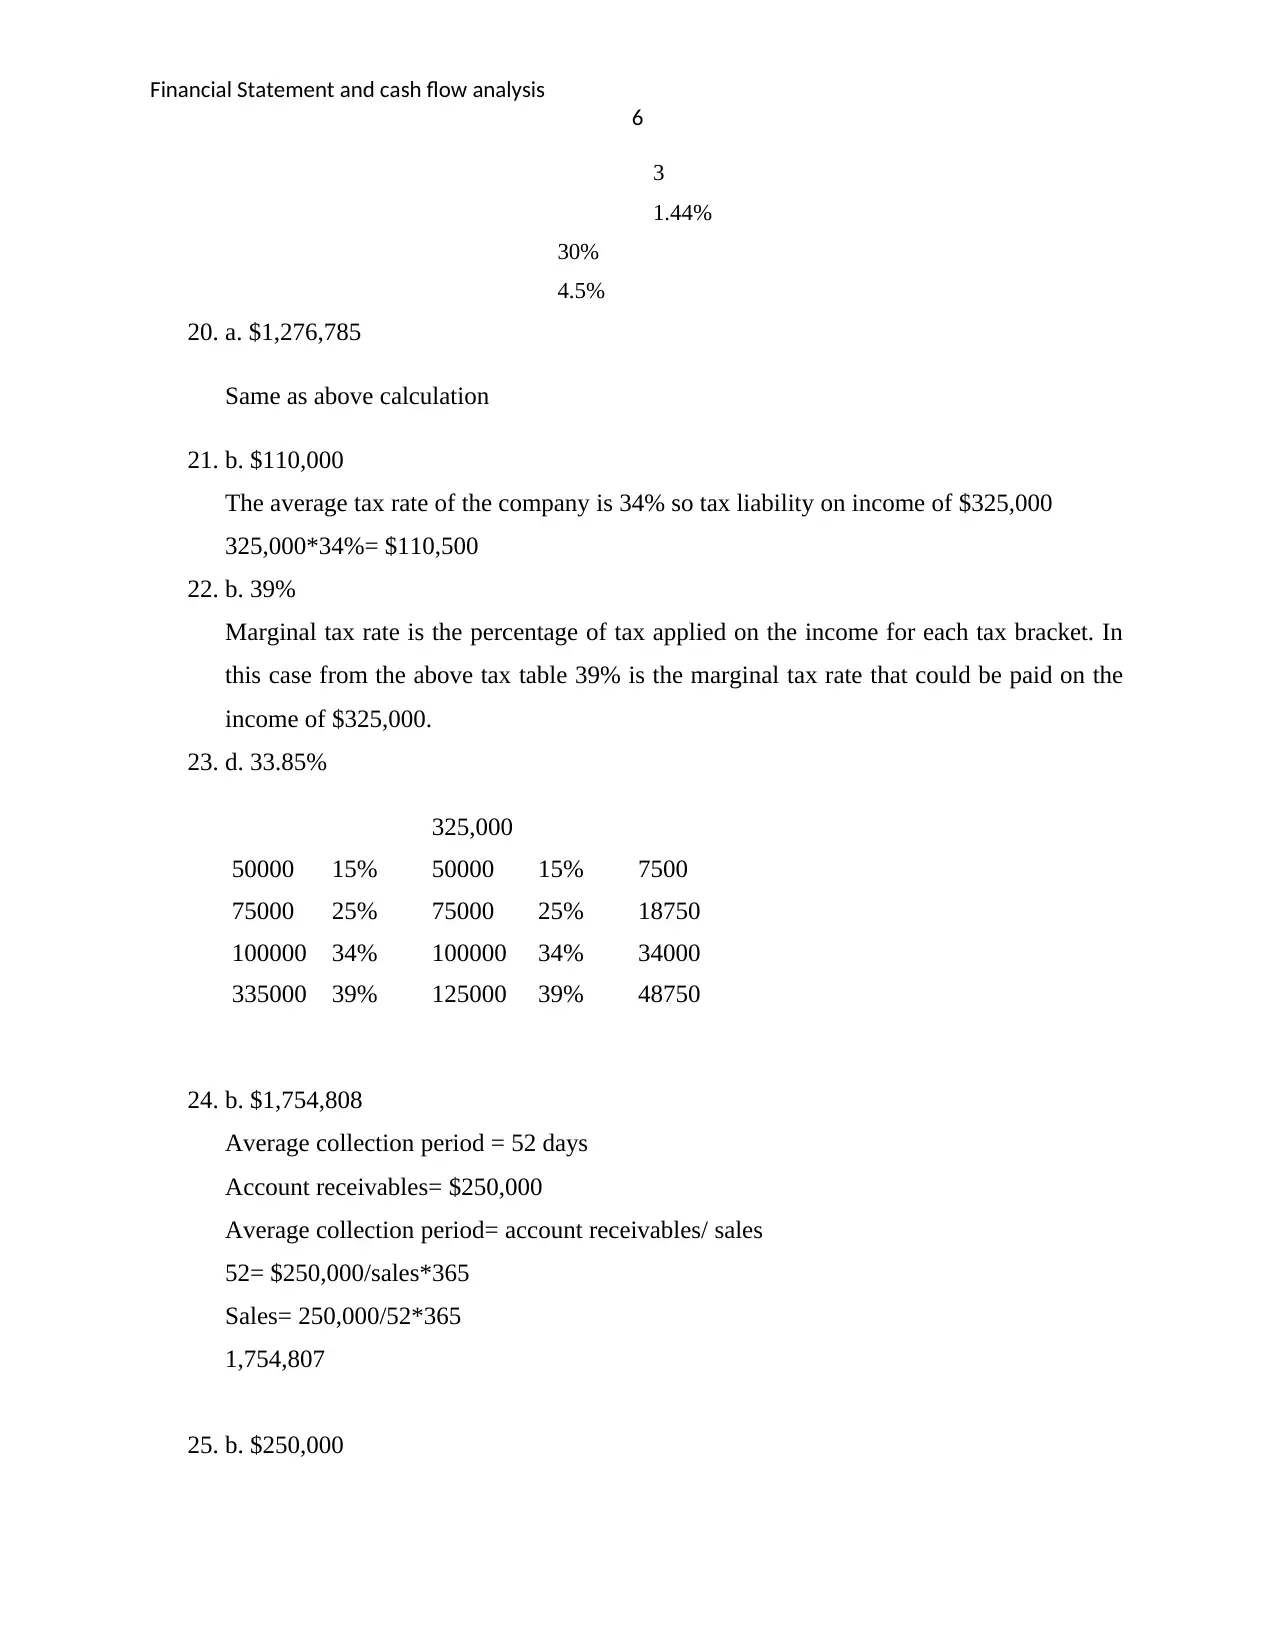
3
1.44%
30%
4.5%
20. a. $1,276,785
Same as above calculation
21. b. $110,000
The average tax rate of the company is 34% so tax liability on income of $325,000
325,000*34%= $110,500
22. b. 39%
Marginal tax rate is the percentage of tax applied on the income for each tax bracket. In
this case from the above tax table 39% is the marginal tax rate that could be paid on the
income of $325,000.
23. d. 33.85%
325,000
50000 15% 50000 15% 7500
75000 25% 75000 25% 18750
100000 34% 100000 34% 34000
335000 39% 125000 39% 48750
24. b. $1,754,808
Average collection period = 52 days
Account receivables= $250,000
Average collection period= account receivables/ sales
52= $250,000/sales*365
Sales= 250,000/52*365
1,754,807
25. b. $250,000
6
3
1.44%
30%
4.5%
20. a. $1,276,785
Same as above calculation
21. b. $110,000
The average tax rate of the company is 34% so tax liability on income of $325,000
325,000*34%= $110,500
22. b. 39%
Marginal tax rate is the percentage of tax applied on the income for each tax bracket. In
this case from the above tax table 39% is the marginal tax rate that could be paid on the
income of $325,000.
23. d. 33.85%
325,000
50000 15% 50000 15% 7500
75000 25% 75000 25% 18750
100000 34% 100000 34% 34000
335000 39% 125000 39% 48750
24. b. $1,754,808
Average collection period = 52 days
Account receivables= $250,000
Average collection period= account receivables/ sales
52= $250,000/sales*365
Sales= 250,000/52*365
1,754,807
25. b. $250,000
Paraphrase This Document
Need a fresh take? Get an instant paraphrase of this document with our AI Paraphraser
Financial Statement and cash flow analysis
7
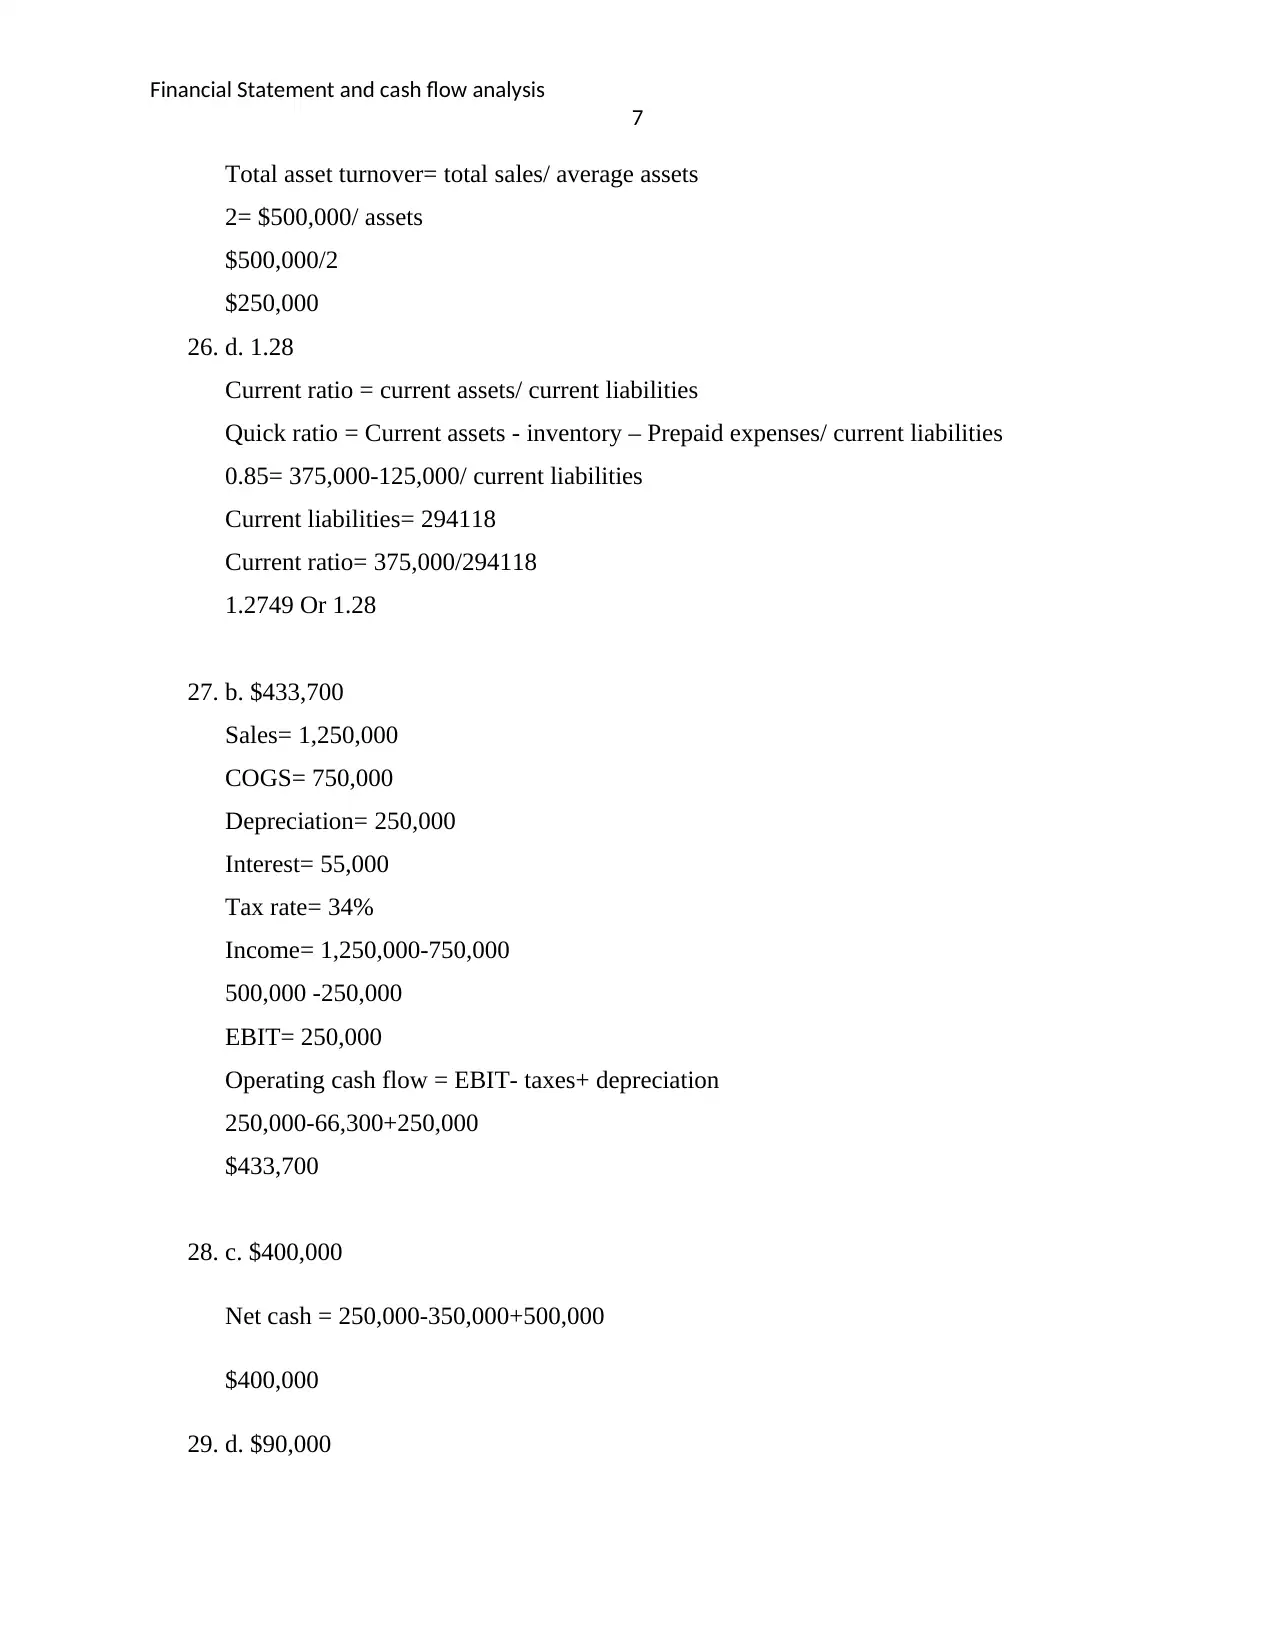
Total asset turnover= total sales/ average assets
2= $500,000/ assets
$500,000/2
$250,000
26. d. 1.28
Current ratio = current assets/ current liabilities
Quick ratio = Current assets - inventory – Prepaid expenses/ current liabilities
0.85= 375,000-125,000/ current liabilities
Current liabilities= 294118
Current ratio= 375,000/294118
1.2749 Or 1.28
27. b. $433,700
Sales= 1,250,000
COGS= 750,000
Depreciation= 250,000
Interest= 55,000
Tax rate= 34%
Income= 1,250,000-750,000
500,000 -250,000
EBIT= 250,000
Operating cash flow = EBIT- taxes+ depreciation
250,000-66,300+250,000
$433,700
28. c. $400,000
Net cash = 250,000-350,000+500,000
$400,000
29. d. $90,000
7
Total asset turnover= total sales/ average assets
2= $500,000/ assets
$500,000/2
$250,000
26. d. 1.28
Current ratio = current assets/ current liabilities
Quick ratio = Current assets - inventory – Prepaid expenses/ current liabilities
0.85= 375,000-125,000/ current liabilities
Current liabilities= 294118
Current ratio= 375,000/294118
1.2749 Or 1.28
27. b. $433,700
Sales= 1,250,000
COGS= 750,000
Depreciation= 250,000
Interest= 55,000
Tax rate= 34%
Income= 1,250,000-750,000
500,000 -250,000
EBIT= 250,000
Operating cash flow = EBIT- taxes+ depreciation
250,000-66,300+250,000
$433,700
28. c. $400,000
Net cash = 250,000-350,000+500,000
$400,000
29. d. $90,000
Financial Statement and cash flow analysis
8
Total assets= 250,000+125,000 = 375,000
Total liabilities= 200,000+85,000= 285,000
Long term debt = 375,000-285,000= 90,000
30. b. 0.6042
ROE= 14.5%
Equity multiplier= 2
Sales= $575,000
Net profit margin= 12%
Net income = 575,000*12%= 69,000
Assets= 69,000/14.5*100= 475,862*2= 951,724
Total asset turnover= total sales/ assets
575,000/951,724
0.60416
31. b. current and prospective cash flows
Financial professionals prefer to focus on that accounting approach in which current and
prospective cash flows of the company can be known or calculated appropriately.
32. b. the financial accounting standard boards
GAAP are developed by FASB (financial accounting standard boards). FASB sets the
standard of accounting that is followed in the companies.
33. a. the statement of cost of goods sold
The balance sheet, cash flow statement and retained earnings are important part of the
companies accounting statement. The cost of goods sold is the statement that is not
required by the securities industry regulations.
34. d. retained earnings
Retained earnings are the part of profits that kept aside in a financial year to meet the
future requirements. This is also the cumulative earnings of the company.
35. c. $12
Gross income= sales- cogs- operating expenses
COGS= 120*25%= 30
⊘ This is a preview!⊘
Do you want full access?
Subscribe today to unlock all pages.
Trusted by 1+ million students worldwide
Financial Statement and cash flow analysis
9
120-30-50= 40
Pretax income= 40-20=20
Tax paid = 20*40%= 8
Net income = 20-8=12
36. c. the statement of cash flows
Cash flow statement shows the net cash flow from operating, investing and financing
activities of the firm so with this statement all the cash transactions of the firm during the
year can be analyses and review.
37. c. financing flows
In the statement of cash flows, the amounts that firm borrowed or paid of its long term
debts are showed in the financing activities. Whereas in operating activities all the cash
that generated through business activities is included.
38. b. operating cash flows
Operating cash flows= EBIT- taxes+ depreciation
39. d. $550,000
EBIT= 500,000
Depreciation= 200,000
Tax rate = 30%
Interest = 0
Taxes= 500,000*30%= 150,000
Operating cash flows= 500,000-150,000+200,000
$550,000
40. a. $150
Operating cash flows= EBIT- taxes + depreciation
850=1000 – 300+ depreciation
850-1000+300= depreciation
Depreciation= 1150-1000
$150
41. a. they are non-cash expenditures
Paraphrase This Document
Need a fresh take? Get an instant paraphrase of this document with our AI Paraphraser
Financial Statement and cash flow analysis
10
Depreciation, amortization, and depletion expenses and allowances are that expenses of
the company in which there is no cash transactions happen. These items are treated as the
non cash expenditures to know the fair value or amount of the profits generated by the
company.
42. d. either a or c will suffice
Fixed assets amount can be calculated by current year gross fixed assets and last year
gross fixed assets further it can be calculated through net fixed assets of current and last
year plus depreciation.
43. c. $4,000
Operating cash flows = EBIT- taxes+ depreciation
EBIT= sales – expenses
10,000-6,000= $4,000
Taxes= 4000*30%= 1,200
4,000-1,200+1,200= 4000
44. c. $1,800
Net Long term assets at the end of 2002= 5,000
Net long term assets at the end of 2003= 5,600
It is given that no asset was disposed off
So purchased during the year = closing balance – opening balance + depreciation
5600-5000+1200= 1800
45. c. $2,300
Free cash flows= cash from operations – capital expenditures
OR
Free cash flows= Net income + non cash expenses- increase in working capital- capital
expenditures
Change in current assets= 200
Change in account payable= 200
Change in accrued expenses= 100
Operating cash flows= EBIT- taxes+ depreciation
Financial Statement and cash flow analysis
11
10,000-6,000-1,200+1,200= 4,000
Change in fixed assets= 1800
Free cash flows= 4,000-1,800- (200-200-100)
$2,300
46. b. an inflow of cash
Account payable are the amount that firm has to pay to its creditors or it is short term
borrowing of the firm so increases in account payable means that cash comes in or
company borrowed more amount during the year.
47. a. 2.0
Current ratio = 2.5
Inventory = $1,000
Current liabilities= $2,000
Current ratio = current assets/ current liabilities
Current assets= 2.5*2000= 5,000
Quick ratio= Current assets- inventory/ current liabilities
5000-1000/2000
2.0
48. c. $12,000
121.67= (365/inventory turnover) = 2.9992
COGS= 4000*2.9992= 11,996.8 or 12,000
49. a. 3 days
Average collection period= 3,500,000/365= 9,589 sales per day
33,000/9,589= 3.44 days
50. c. the greater the financial leverage it uses
The ideal ratio of debt and equity is 2:1 and when the firm has more debts than its assets
that mean the company is using more debt and the higher the financial leverage.
51. c. 3.33
Total liabilities= $3,500
Total assets= $5,000
⊘ This is a preview!⊘
Do you want full access?
Subscribe today to unlock all pages.
Trusted by 1+ million students worldwide
1 out of 13
Related Documents


Your All-in-One AI-Powered Toolkit for Academic Success.
+13062052269
info@desklib.com
Available 24*7 on WhatsApp / Email
![[object Object]](/_next/static/media/star-bottom.7253800d.svg)
Unlock your academic potential
Copyright © 2020–2026 A2Z Services. All Rights Reserved. Developed and managed by ZUCOL.