Financial Statement Analysis: Holmes Institute HC1010 Assignment

Verified

Added on  2022/11/11

|5
|1177
|69
Homework Assignment
AI Summary
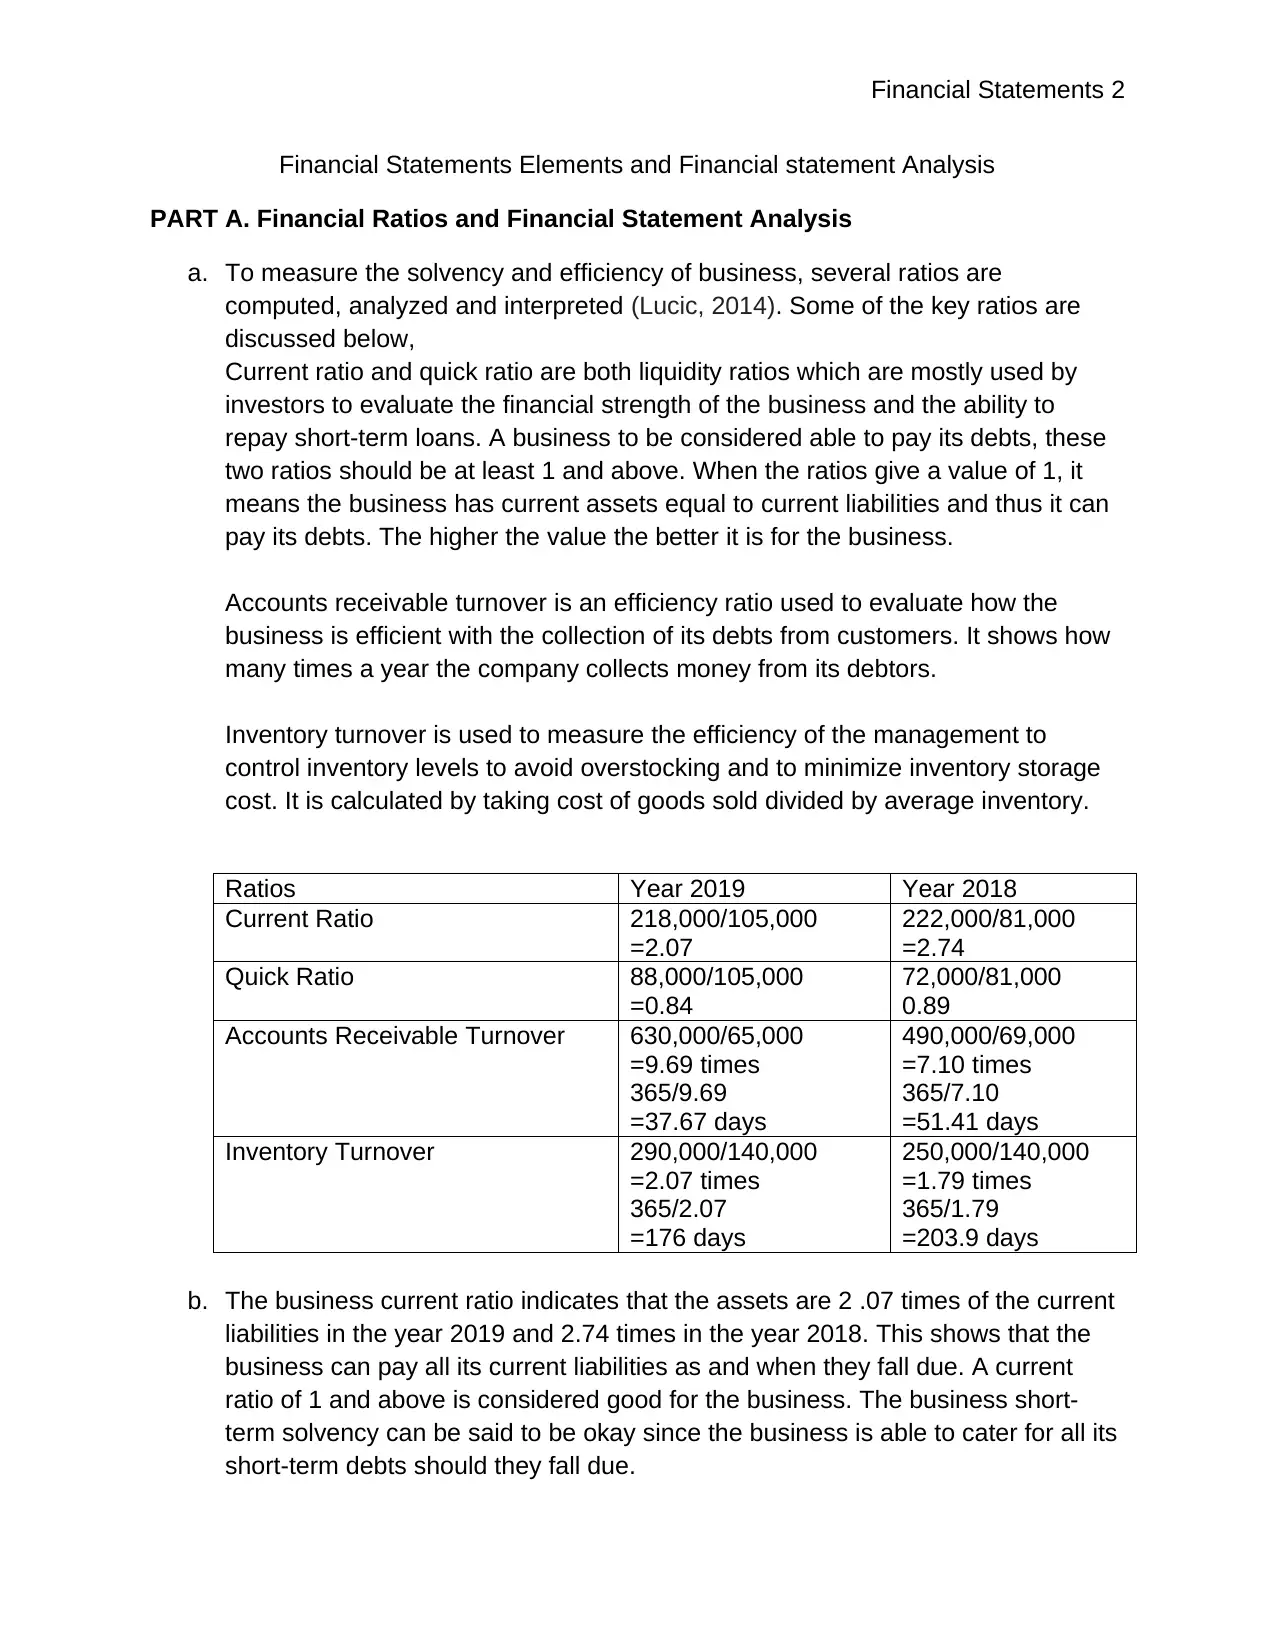
This assignment analyzes financial statements, focusing on key financial ratios such as current ratio, quick ratio, accounts receivable turnover, and inventory turnover to assess a business's solvency and efficiency. The document compares these ratios for two different years, providing insights into the business's financial health and identifying areas for improvement. Furthermore, the assignment distinguishes between income and revenue, clarifying their definitions and applications within a business context. It also compares the balance sheets of two companies, using the data to determine which business is more suitable for a short-term loan and investment based on their financial positions. The assignment utilizes the provided financial data to make informed decisions, demonstrating an understanding of financial statement analysis and its practical implications.
tabler-icon-diamond-filled.svg

Contribute Materials

Your contribution can guide someone’s learning journey. Share your documents today.
Document Page
Financial Statements 1
FINANCIAL STATEMENTS ELEMENTS AND FINANCIAL STATEMENT ANALYSIS
By (Name)
The Name of the Class
Professor
The Name of the School
The City and State
Date
tabler-icon-diamond-filled.svg

Secure Best Marks with AI Grader

Need help grading? Try our AI Grader for instant feedback on your assignments.
Document Page
Financial Statements 2
Financial Statements Elements and Financial statement Analysis
PART A. Financial Ratios and Financial Statement Analysis
a. To measure the solvency and efficiency of business, several ratios are
computed, analyzed and interpreted (Lucic, 2014). Some of the key ratios are
discussed below,
Current ratio and quick ratio are both liquidity ratios which are mostly used by
investors to evaluate the financial strength of the business and the ability to
repay short-term loans. A business to be considered able to pay its debts, these
two ratios should be at least 1 and above. When the ratios give a value of 1, it
means the business has current assets equal to current liabilities and thus it can
pay its debts. The higher the value the better it is for the business.
Accounts receivable turnover is an efficiency ratio used to evaluate how the
business is efficient with the collection of its debts from customers. It shows how
many times a year the company collects money from its debtors.
Inventory turnover is used to measure the efficiency of the management to
control inventory levels to avoid overstocking and to minimize inventory storage
cost. It is calculated by taking cost of goods sold divided by average inventory.
Ratios Year 2019 Year 2018
Current Ratio 218,000/105,000
=2.07
222,000/81,000
=2.74
Quick Ratio 88,000/105,000
=0.84
72,000/81,000
0.89
Accounts Receivable Turnover 630,000/65,000
=9.69 times
365/9.69
=37.67 days
490,000/69,000
=7.10 times
365/7.10
=51.41 days
Inventory Turnover 290,000/140,000
=2.07 times
365/2.07
=176 days
250,000/140,000
=1.79 times
365/1.79
=203.9 days
b. The business current ratio indicates that the assets are 2 .07 times of the current
liabilities in the year 2019 and 2.74 times in the year 2018. This shows that the
business can pay all its current liabilities as and when they fall due. A current
ratio of 1 and above is considered good for the business. The business short-
term solvency can be said to be okay since the business is able to cater for all its
short-term debts should they fall due.
Document Page
Financial Statements 3
According to accounts receivable turnover, the business collects its receivables
after 37 days in 2019 and 51 days in 2018. This is not in line with the credit policy
of the business which is 30 days. Inventory turnover indicates that the business
is able to sell and replace inventories twice a year as shown by the inventory
turnover ratio, 2.07 in 2019 and 1.79 in the year 2018. The inventory turnover
and accounts receivable turnover are efficiency ratios and for this business it
needs to improve on them and ensure they are consistent to the set policies
(Vasiu, et al, 2015).
PART B. Income and Revenue
a. Income is a wide term which means all the proceeds that a business receives in
the course of its day to day operations. It could mean proceeds from the sale of
its goods and services, interest from investments, discounts received and
proceeds from sale of shares. The foregoing financial transactions for the
business are all qualifying for a definition as income. This is because all of them
involve receipts of money on a regular basis for work done or through
investment.
b. Revenue is a much more narrow term compared to income. Revenue is taken to
mean the company’s proceeds from the sale of its goods and services or from
use of capital or asset. Unlike income, revenue must be generated by business in
the course of its main operations in which it is set for. In this case, only $25 000
000 from sale of software and $3 000 000 from update downloads, will meet the
definition of revenue. The main operation of the business is to sale anti-virus
software and therefore the other transactions don’t fall within its core activities
(Sedki, et al, 2014).
PART C. Comparing balance sheet
a. The short-term loan of $6 000 repayable in six months is a current liability and is
supposed to be settled using current assets. In my assessment to determine
which business to advance the loan, I will consider current ratios of both
businesses. This will simply be comparing the current assets and current
liabilities of each business. ABC company has a total current assets of $7 200
and total current liabilities of $52 800. XYZ Company has a total current assets of
$26 000 and a total current liabilities of $12 000. I will select application from XYZ
Company because it is able to repay its current liabilities using its current assets
(Trönnberg and Hemlin, 2014).
Document Page
Financial Statements 4
b. I will pay higher price for XYZ Company. The net worth of XYZ Company is $34
200 which is the net of total assets less total liabilities compared to ABC
Company whose net worth is $8 400. The balance sheet indicates the financial
position of a business. Comparing the two companies, XYZ Company has a high
financial base compared to ABC Company and it is therefore worthy investing
more to XYZ Company.
c. If the owners of the two companies were to take over the liabilities, then my
decision in (b) above will be reversed. ABC has a total assets of $61 200 and
XYZ has a total assets of $46 200. If owners take over the liabilities, then the
decision on which company to pay a higher price will be based on the value of
the total assets. In that case ABC will be the company of my choice.
tabler-icon-diamond-filled.svg

Secure Best Marks with AI Grader

Need help grading? Try our AI Grader for instant feedback on your assignments.
Document Page
Financial Statements 5
References
Lucic, L., 2014. Financial ratios in the function of business risk
assessment. Online Journal of Applied Knowledge Management, 2(3), pp.21-34.
Vasiu, D.E., BALTEŞ, N. and Gheorghe, I.N., 2015. Liquidity ratios. A structural
and dynamic analysis, during 2006-2012, of the companies having the business
line in industry and construction, listed and traded on the Bucharest Stock
Exchange. Theoretical & Applied Economics, 22(3).
Sedki, S.S., Smith, A. and Strickland, A., 2014. Differences and similarities
between IFRS and GAAP on inventory, revenue recognition and consolidated
financial statements. Journal of Accounting and Finance, 14(2), p.120.
Trönnberg, C.C. and Hemlin, S., 2014. Lending decision making in banks: A
critical incident study of loan officers. European Management Journal, 32(2),
pp.362-372.
chevron_up_icon
1 out of 5
circle_padding
hide_on_mobile
zoom_out_icon
logo.png

Your All-in-One AI-Powered Toolkit for Academic Success.

Available 24*7 on WhatsApp / Email

[object Object]