Fortescue Metals Group: Financial Analysis for Business Decisions
VerifiedAdded on 2023/06/03
|17
|3700
|204
Report
AI Summary
This report provides a comprehensive financial analysis of Fortescue Metals Group Ltd over a two-year period, utilizing comparative and common size statements for both the income statement and balance sheet. Key financial ratios are computed and analyzed to assess the company's financial performance, with a comparative study against major competitors like Rio Tinto Ltd and BHP Billiton Ltd. Furthermore, the report evaluates Fortescue Metals Group Ltd's corporate governance practices, highlighting potential areas for improvement. This student-contributed assignment is available on Desklib, a platform offering a range of study tools and resources for students.
Running head: ACCOUNTING FOR BUSINESS DECISIONS
Accounting for Business Decisions
Name of the Student:
Name of the University:
Author’s Note:
Accounting for Business Decisions
Name of the Student:
Name of the University:
Author’s Note:
Paraphrase This Document
Need a fresh take? Get an instant paraphrase of this document with our AI Paraphraser
1
ACCOUNTING FOR BUSINESS DECISIONS
Executive Summary
The report shows analysis of the financial statements of Fortescue Metals Group Ltd for a period
of two years. The report include computation for comparative and common size statement of
both the income statement and balance sheet of the business. The report also includes ratio
computation and analysis on the basis of which financial performance of the business is being
considered, A comparative study of the business financial results are also undertaken with the
close competitors of the business which are Rio Tinto ltd and BHP Billiton ltd. The report in the
final parts shows the corporate governance practices which are employed by the management of
Fortescue Metals Group Ltd and also identifies the issues which if corrected can bring about
more praise to corporate governance practices of the business.
2
ACCOUNTING FOR BUSINESS DECISIONS
Table of Contents
Introduction......................................................................................................................................3
Financial Statement Analysis..........................................................................................................3
Comparison with a Competitor......................................................................................................10
Ratio Analysis................................................................................................................................11
Corporate Governance Report.......................................................................................................13
Conclusion.................................................................................................................................14
Reference.......................................................................................................................................16
⊘ This is a preview!⊘
Do you want full access?
Subscribe today to unlock all pages.
Trusted by 1+ million students worldwide
3
ACCOUNTING FOR BUSINESS DECISIONS
Introduction
The main purpose of the assessment is to critically analyze the financial statements of
Fortescue Metals Group LTD in order to understand the financial performance of the business in
last year years. In order to obtain relevant financial information, the annual reports of the
company are considered for the period of two years which is 2018 and 2017.
Fortescue Metals Group Ltd is an Australian based iron ore company which is engaged in
the business of mining and extraction of minerals from the surface of the earth. The company at
one point of time was regarded as one of the largest producers of iron ore in the world
(Fmgl.com.au. 2018). The company has its major operations and also its headquarters in western
Australia.
The assessment shows analysis of key financial ratios which are related to liquidity and
profitability aspect of the business. The assessment shows computation of these ratios and
analysis for the same in order to identify the growth or decline of the business. The assessment
also aims to identify one competitor of the business and analyze how the business is performing
in terms of the competitor. In addition to this, an analysis of the corporate governance of the
business is also included in the assessment.
Financial Statement Analysis
The annual reports of the business which is presented for the year 2018 shows that the
business has presented the financial statement of the company as per the conceptual framework
which is usually followed by most of the companies. In order to effectively demonstrate the
changes which have taken place in the financial statement over the two years period,
comparative and common size statements are prepared showing changes in various items which
Paraphrase This Document
Need a fresh take? Get an instant paraphrase of this document with our AI Paraphraser
4
ACCOUNTING FOR BUSINESS DECISIONS
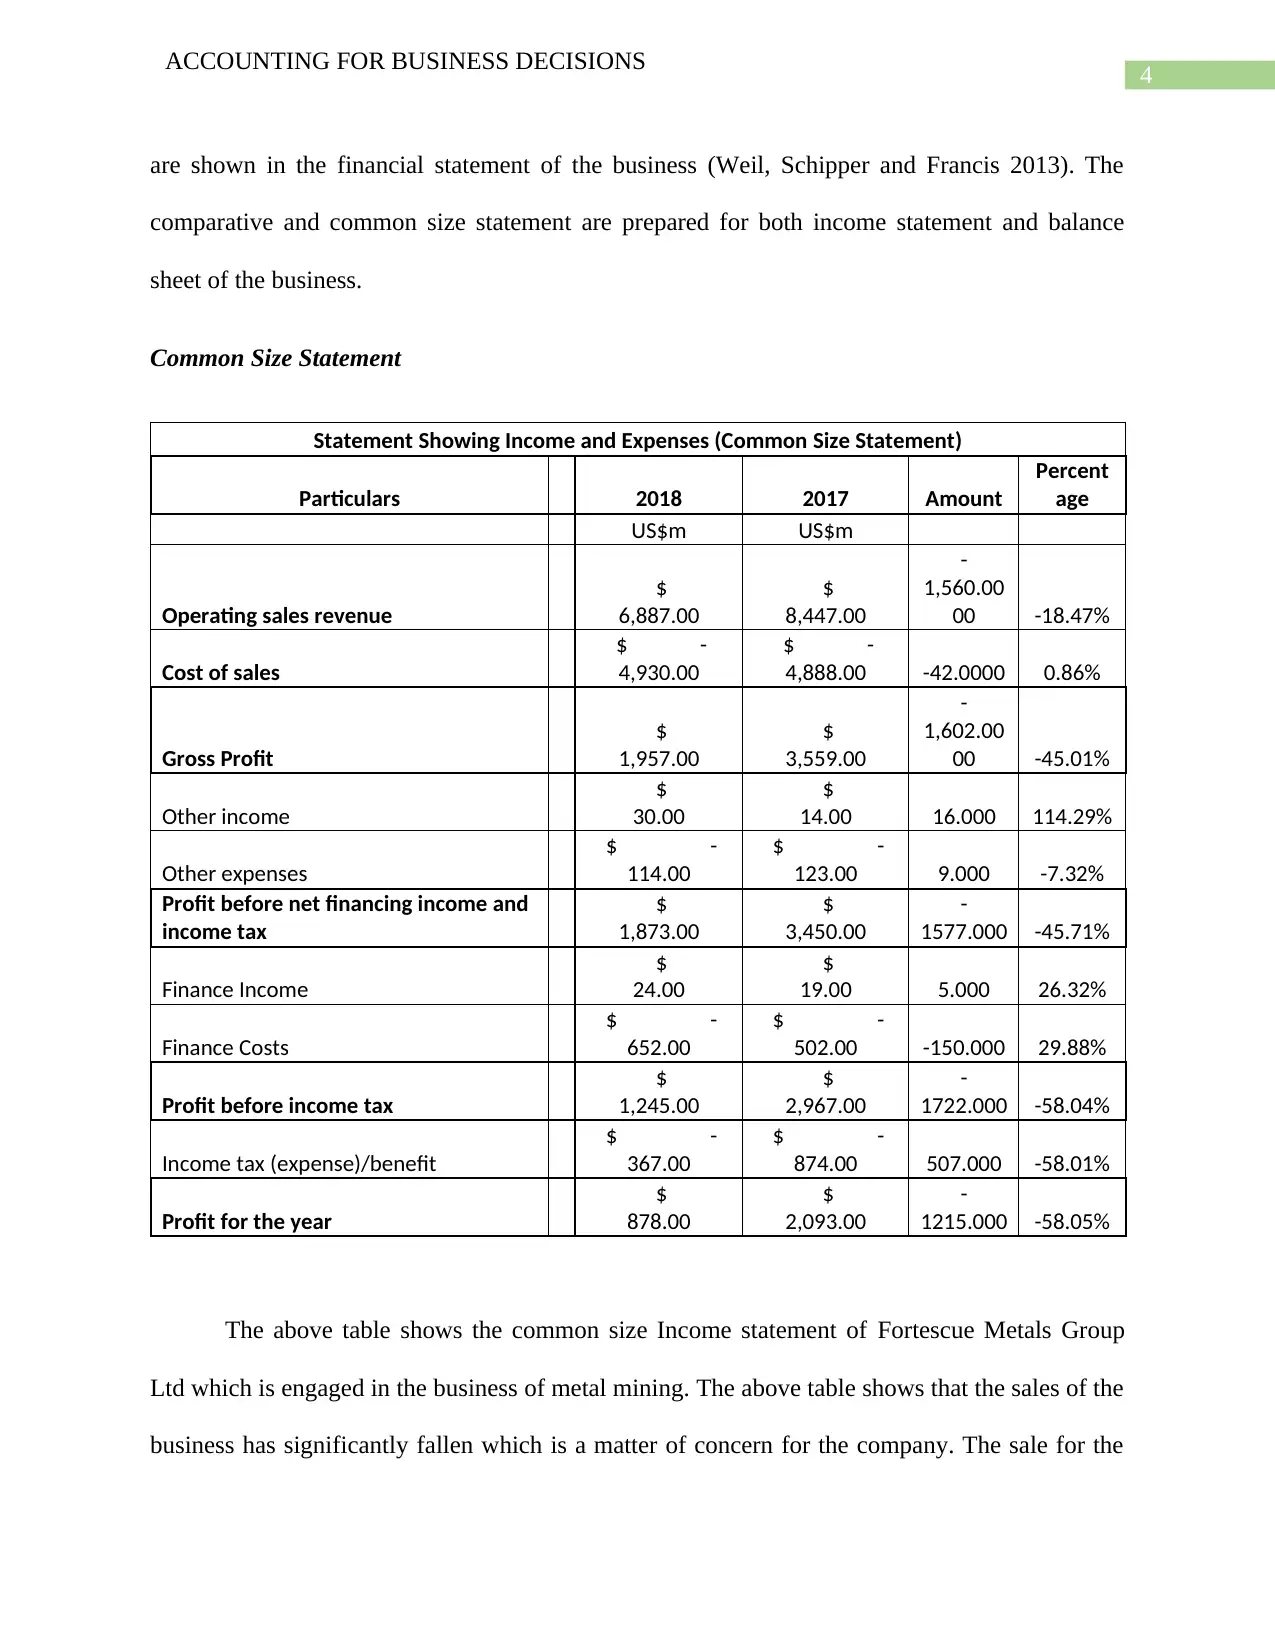
are shown in the financial statement of the business (Weil, Schipper and Francis 2013). The
comparative and common size statement are prepared for both income statement and balance
sheet of the business.
Common Size Statement
Statement Showing Income and Expenses (Common Size Statement)
Particulars 2018 2017 Amount
Percent
age
US$m US$m
Operating sales revenue
$
6,887.00
$
8,447.00
-
1,560.00
00 -18.47%
Cost of sales
$ -
4,930.00
$ -
4,888.00 -42.0000 0.86%
Gross Profit
$
1,957.00
$
3,559.00
-
1,602.00
00 -45.01%
Other income
$
30.00
$
14.00 16.000 114.29%
Other expenses
$ -
114.00
$ -
123.00 9.000 -7.32%
Profit before net financing income and
income tax
$
1,873.00
$
3,450.00
-
1577.000 -45.71%
Finance Income
$
24.00
$
19.00 5.000 26.32%
Finance Costs
$ -
652.00
$ -
502.00 -150.000 29.88%
Profit before income tax
$
1,245.00
$
2,967.00
-
1722.000 -58.04%
Income tax (expense)/benefit
$ -
367.00
$ -
874.00 507.000 -58.01%
Profit for the year
$
878.00
$
2,093.00
-
1215.000 -58.05%
The above table shows the common size Income statement of Fortescue Metals Group
Ltd which is engaged in the business of metal mining. The above table shows that the sales of the
business has significantly fallen which is a matter of concern for the company. The sale for the
ACCOUNTING FOR BUSINESS DECISIONS
are shown in the financial statement of the business (Weil, Schipper and Francis 2013). The
comparative and common size statement are prepared for both income statement and balance
sheet of the business.
Common Size Statement
Statement Showing Income and Expenses (Common Size Statement)
Particulars 2018 2017 Amount
Percent
age
US$m US$m
Operating sales revenue
$
6,887.00
$
8,447.00
-
1,560.00
00 -18.47%
Cost of sales
$ -
4,930.00
$ -
4,888.00 -42.0000 0.86%
Gross Profit
$
1,957.00
$
3,559.00
-
1,602.00
00 -45.01%
Other income
$
30.00
$
14.00 16.000 114.29%
Other expenses
$ -
114.00
$ -
123.00 9.000 -7.32%
Profit before net financing income and
income tax
$
1,873.00
$
3,450.00
-
1577.000 -45.71%
Finance Income
$
24.00
$
19.00 5.000 26.32%
Finance Costs
$ -
652.00
$ -
502.00 -150.000 29.88%
Profit before income tax
$
1,245.00
$
2,967.00
-
1722.000 -58.04%
Income tax (expense)/benefit
$ -
367.00
$ -
874.00 507.000 -58.01%
Profit for the year
$
878.00
$
2,093.00
-
1215.000 -58.05%
The above table shows the common size Income statement of Fortescue Metals Group
Ltd which is engaged in the business of metal mining. The above table shows that the sales of the
business has significantly fallen which is a matter of concern for the company. The sale for the
5
ACCOUNTING FOR BUSINESS DECISIONS
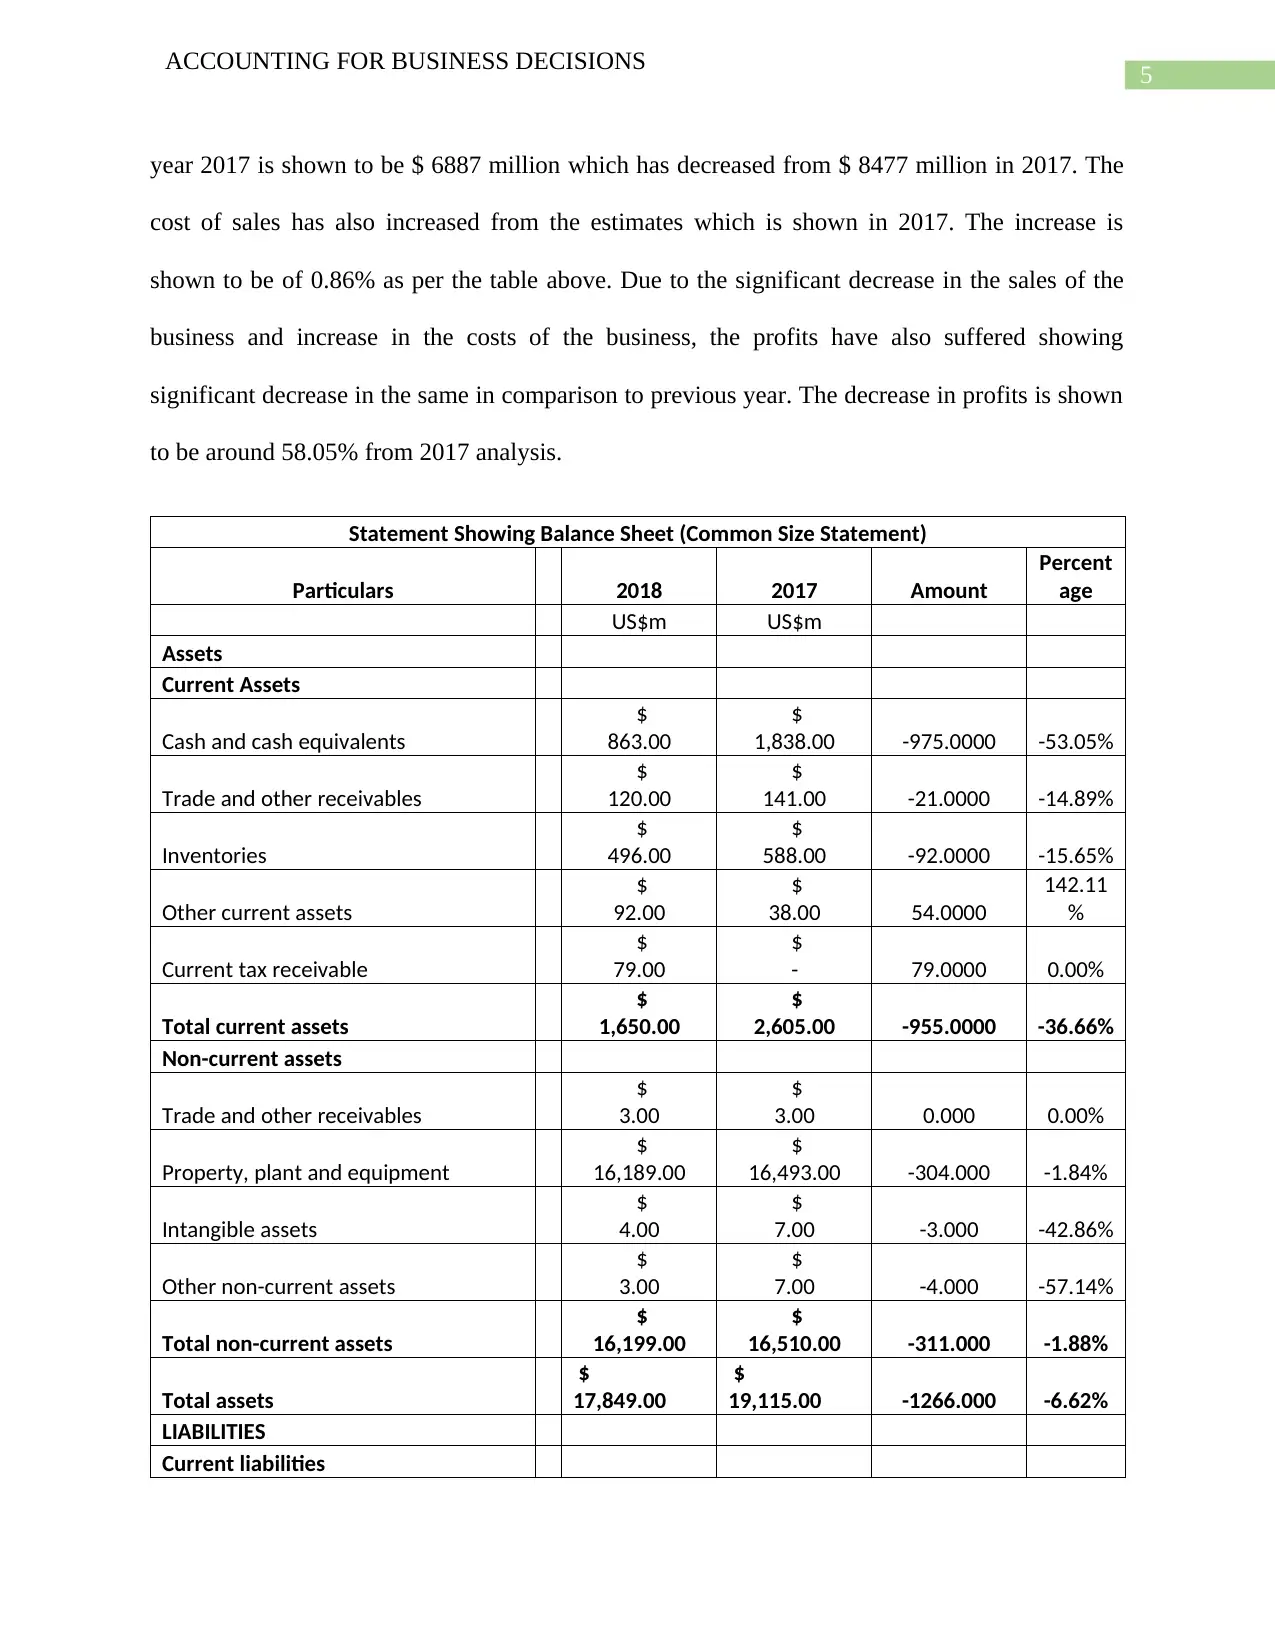
year 2017 is shown to be $ 6887 million which has decreased from $ 8477 million in 2017. The
cost of sales has also increased from the estimates which is shown in 2017. The increase is
shown to be of 0.86% as per the table above. Due to the significant decrease in the sales of the
business and increase in the costs of the business, the profits have also suffered showing
significant decrease in the same in comparison to previous year. The decrease in profits is shown
to be around 58.05% from 2017 analysis.
Statement Showing Balance Sheet (Common Size Statement)
Particulars 2018 2017 Amount
Percent
age
US$m US$m
Assets
Current Assets
Cash and cash equivalents
$
863.00
$
1,838.00 -975.0000 -53.05%
Trade and other receivables
$
120.00
$
141.00 -21.0000 -14.89%
Inventories
$
496.00
$
588.00 -92.0000 -15.65%
Other current assets
$
92.00
$
38.00 54.0000
142.11
%
Current tax receivable
$
79.00
$
- 79.0000 0.00%
Total current assets
$
1,650.00
$
2,605.00 -955.0000 -36.66%
Non-current assets
Trade and other receivables
$
3.00
$
3.00 0.000 0.00%
Property, plant and equipment
$
16,189.00
$
16,493.00 -304.000 -1.84%
Intangible assets
$
4.00
$
7.00 -3.000 -42.86%
Other non-current assets
$
3.00
$
7.00 -4.000 -57.14%
Total non-current assets
$
16,199.00
$
16,510.00 -311.000 -1.88%
Total assets
$
17,849.00
$
19,115.00 -1266.000 -6.62%
LIABILITIES
Current liabilities
ACCOUNTING FOR BUSINESS DECISIONS
year 2017 is shown to be $ 6887 million which has decreased from $ 8477 million in 2017. The
cost of sales has also increased from the estimates which is shown in 2017. The increase is
shown to be of 0.86% as per the table above. Due to the significant decrease in the sales of the
business and increase in the costs of the business, the profits have also suffered showing
significant decrease in the same in comparison to previous year. The decrease in profits is shown
to be around 58.05% from 2017 analysis.
Statement Showing Balance Sheet (Common Size Statement)
Particulars 2018 2017 Amount
Percent
age
US$m US$m
Assets
Current Assets
Cash and cash equivalents
$
863.00
$
1,838.00 -975.0000 -53.05%
Trade and other receivables
$
120.00
$
141.00 -21.0000 -14.89%
Inventories
$
496.00
$
588.00 -92.0000 -15.65%
Other current assets
$
92.00
$
38.00 54.0000
142.11
%
Current tax receivable
$
79.00
$
- 79.0000 0.00%
Total current assets
$
1,650.00
$
2,605.00 -955.0000 -36.66%
Non-current assets
Trade and other receivables
$
3.00
$
3.00 0.000 0.00%
Property, plant and equipment
$
16,189.00
$
16,493.00 -304.000 -1.84%
Intangible assets
$
4.00
$
7.00 -3.000 -42.86%
Other non-current assets
$
3.00
$
7.00 -4.000 -57.14%
Total non-current assets
$
16,199.00
$
16,510.00 -311.000 -1.88%
Total assets
$
17,849.00
$
19,115.00 -1266.000 -6.62%
LIABILITIES
Current liabilities
⊘ This is a preview!⊘
Do you want full access?
Subscribe today to unlock all pages.
Trusted by 1+ million students worldwide
6
ACCOUNTING FOR BUSINESS DECISIONS
Trade and other payables
$
678.00
$
708.00
$ -
30.00 -4.24%
Deferred income
$
267.00
$
461.00
$ -
194.00 -42.08%
Borrowings and finance lease liabilities
$
97.00
$
121.00
$ -
24.00 -19.83%
Provisions
$
197.00
$
227.00
$ -
30.00 -13.22%
Current tax payable
$
-
$
685.00
$ -
685.00
-
100.00
%
Total current liabilities
$
1,239.00
$
2,202.00
$ -
963.00 -43.73%
Non-current liabilities
Trade and other payables
$
50.00
$
50.00
$
- 0.00%
Deferred income
$
528.00
$
427.00
$
101.00 23.65%
Borrowings and finance lease liabilities
$
3,878.00
$
4,350.00
$ -
472.00 -10.85%
Provisions
$
546.00
$
509.00
$
37.00 7.27%
Deferred joint venture contributions
$
270.00
$
266.00
$
4.00 1.50%
Deferred tax liabilities
$
1,606.00
$
1,557.00
$
49.00 3.15%
Total non-current liabilities
$
6,878.00
$
7,159.00
$ -
281.00 -3.93%
Total liabilities
$
8,117.00
$
9,361.00
$ -
1,244.00 -13.29%
Net assets
$
9,732.00
$
9,754.00
$ -
22.00 -0.23%
EQUITY
Contributed equity
$
1,287.00
$
1,289.00
$
-2.00 -0.16%
Reserves
$
46.00
$
39.00
$
7.00 17.95%
Retained earnings
$
8,386.00
$
8,392.00
$
-6.00 -0.07%
Equity attributable to equity holders
of the Company
$
9,719.00
$
9,720.00
$
-1.00 -0.01%
Non-controlling interest
$
13.00
$
14.00
$
-1.00 -7.14%
Total equity
$
9,732.00
$
9,734.00
$
-2.00 -0.02%
Paraphrase This Document
Need a fresh take? Get an instant paraphrase of this document with our AI Paraphraser
7
ACCOUNTING FOR BUSINESS DECISIONS
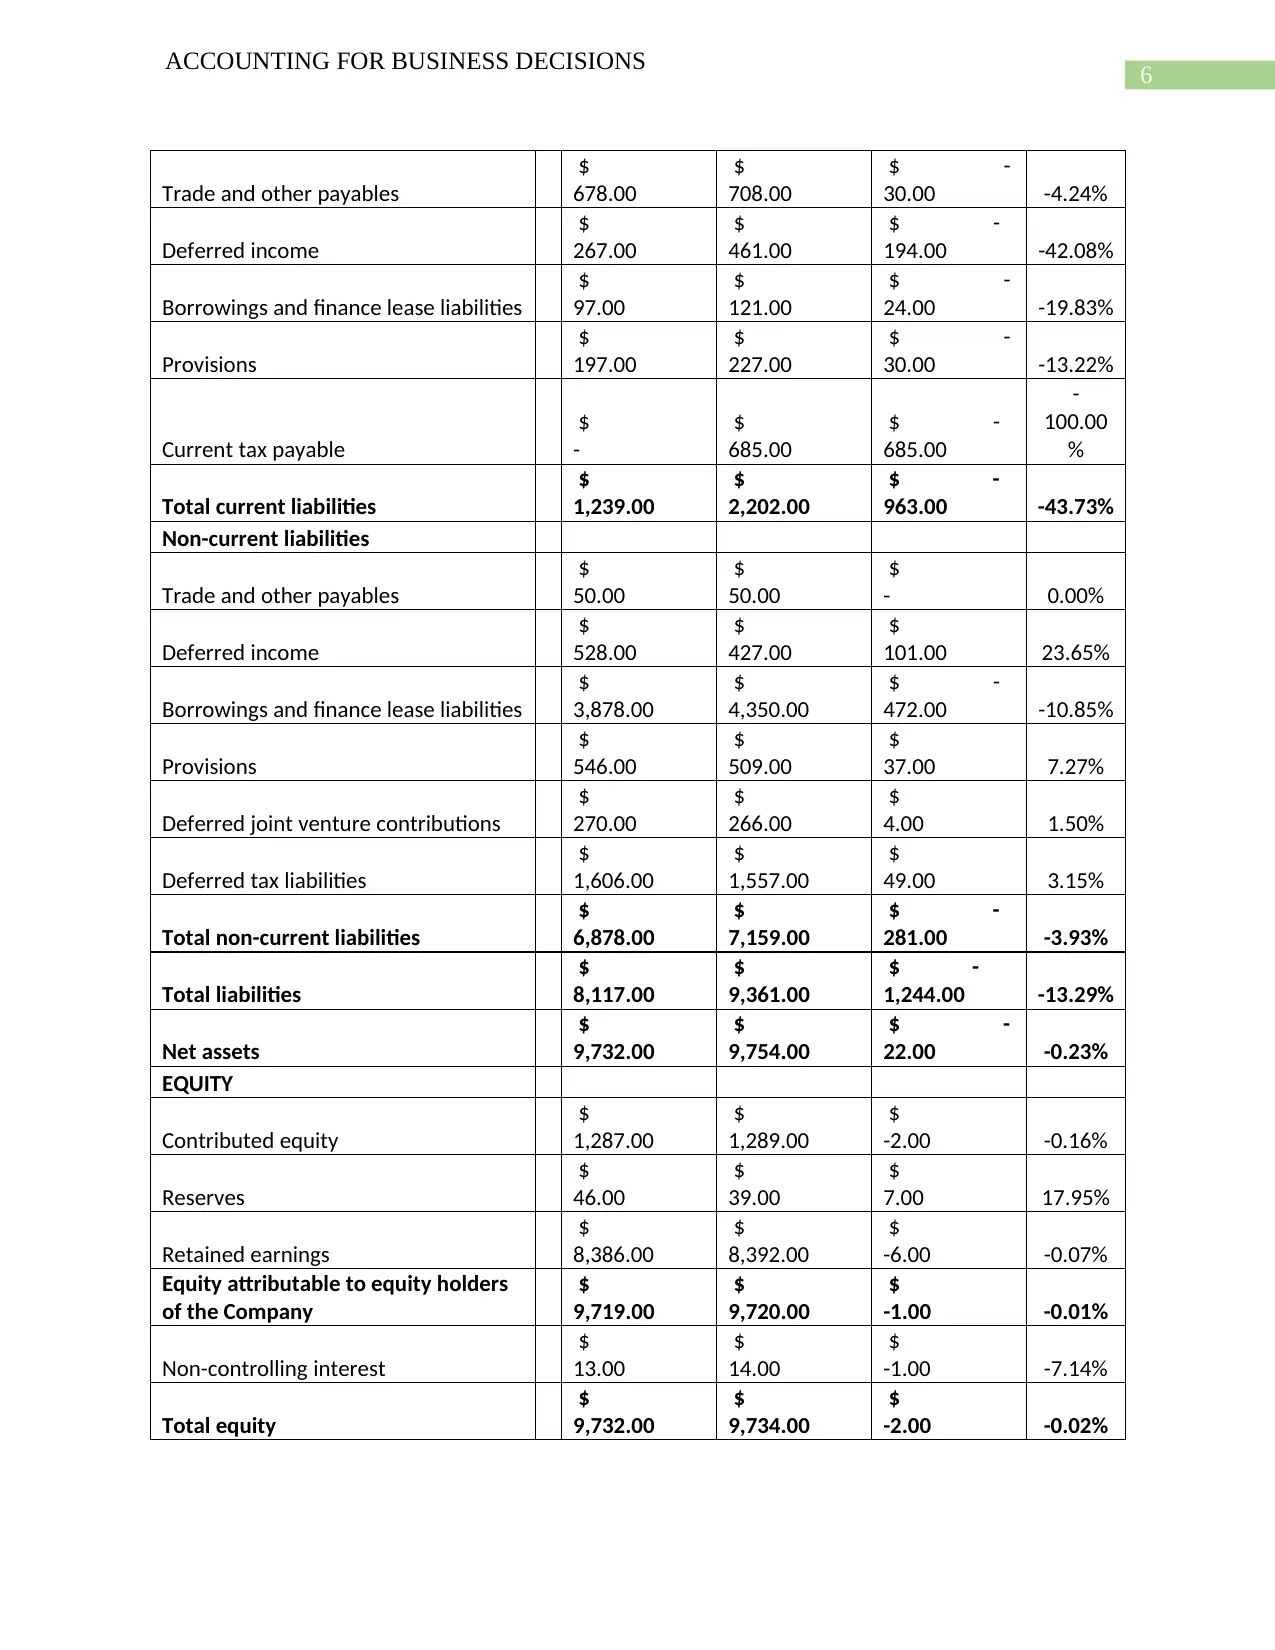
The above table shows the analysis of common size statement for the balance sheet of the
business. The current assets of the business have significantly fallen in comparison to previous
year analysis whereas there is slight change in the current liabilities of the business. This shows
that the liquidity position of the company is at stake here (Fifka 2013). There has been
significant decrease in fixed assets of the business. The debt which is held by the business has
reduced slightly however, the burden of debt is still on the business and affect the profits of the
business which is clear from the income statement where interest expenses are shown.
Comparative Statement
Statement Showing Income and Expenses (Comparative Statement)
Particulars 2018
Percent
age 2017
Percent
age
$ $
Revenue
$
6,887.00 100.00%
$
8,447.00 100.00%
Cost of sales
$ -
4,930.00 71.58%
$ -
4,888.00 57.87%
Gross Profit
$
1,957.00 28.42%
$
3,559.00 42.13%
Other income
$
30.00 1.53%
$
14.00 0.17%
Other expenses
$ -
114.00 1.66%
$ -
123.00 1.46%
Profit before net financing income and
income tax
$
1,873.00 27.20%
$
3,450.00 40.84%
Finance Income
$
24.00 0.35%
$
19.00 0.22%
Finance Costs
$ -
652.00 9.47%
$ -
502.00 5.94%
Profit before income tax
$
1,245.00 18.08%
$
2,967.00 35.12%
Income tax (expense)/benefit
$ -
367.00 -5.33%
$ -
874.00 10.35%
Profit for the year
$
878.00 12.75%
$
2,093.00 24.78%
ACCOUNTING FOR BUSINESS DECISIONS
The above table shows the analysis of common size statement for the balance sheet of the
business. The current assets of the business have significantly fallen in comparison to previous
year analysis whereas there is slight change in the current liabilities of the business. This shows
that the liquidity position of the company is at stake here (Fifka 2013). There has been
significant decrease in fixed assets of the business. The debt which is held by the business has
reduced slightly however, the burden of debt is still on the business and affect the profits of the
business which is clear from the income statement where interest expenses are shown.
Comparative Statement
Statement Showing Income and Expenses (Comparative Statement)
Particulars 2018
Percent
age 2017
Percent
age
$ $
Revenue
$
6,887.00 100.00%
$
8,447.00 100.00%
Cost of sales
$ -
4,930.00 71.58%
$ -
4,888.00 57.87%
Gross Profit
$
1,957.00 28.42%
$
3,559.00 42.13%
Other income
$
30.00 1.53%
$
14.00 0.17%
Other expenses
$ -
114.00 1.66%
$ -
123.00 1.46%
Profit before net financing income and
income tax
$
1,873.00 27.20%
$
3,450.00 40.84%
Finance Income
$
24.00 0.35%
$
19.00 0.22%
Finance Costs
$ -
652.00 9.47%
$ -
502.00 5.94%
Profit before income tax
$
1,245.00 18.08%
$
2,967.00 35.12%
Income tax (expense)/benefit
$ -
367.00 -5.33%
$ -
874.00 10.35%
Profit for the year
$
878.00 12.75%
$
2,093.00 24.78%
8
ACCOUNTING FOR BUSINESS DECISIONS
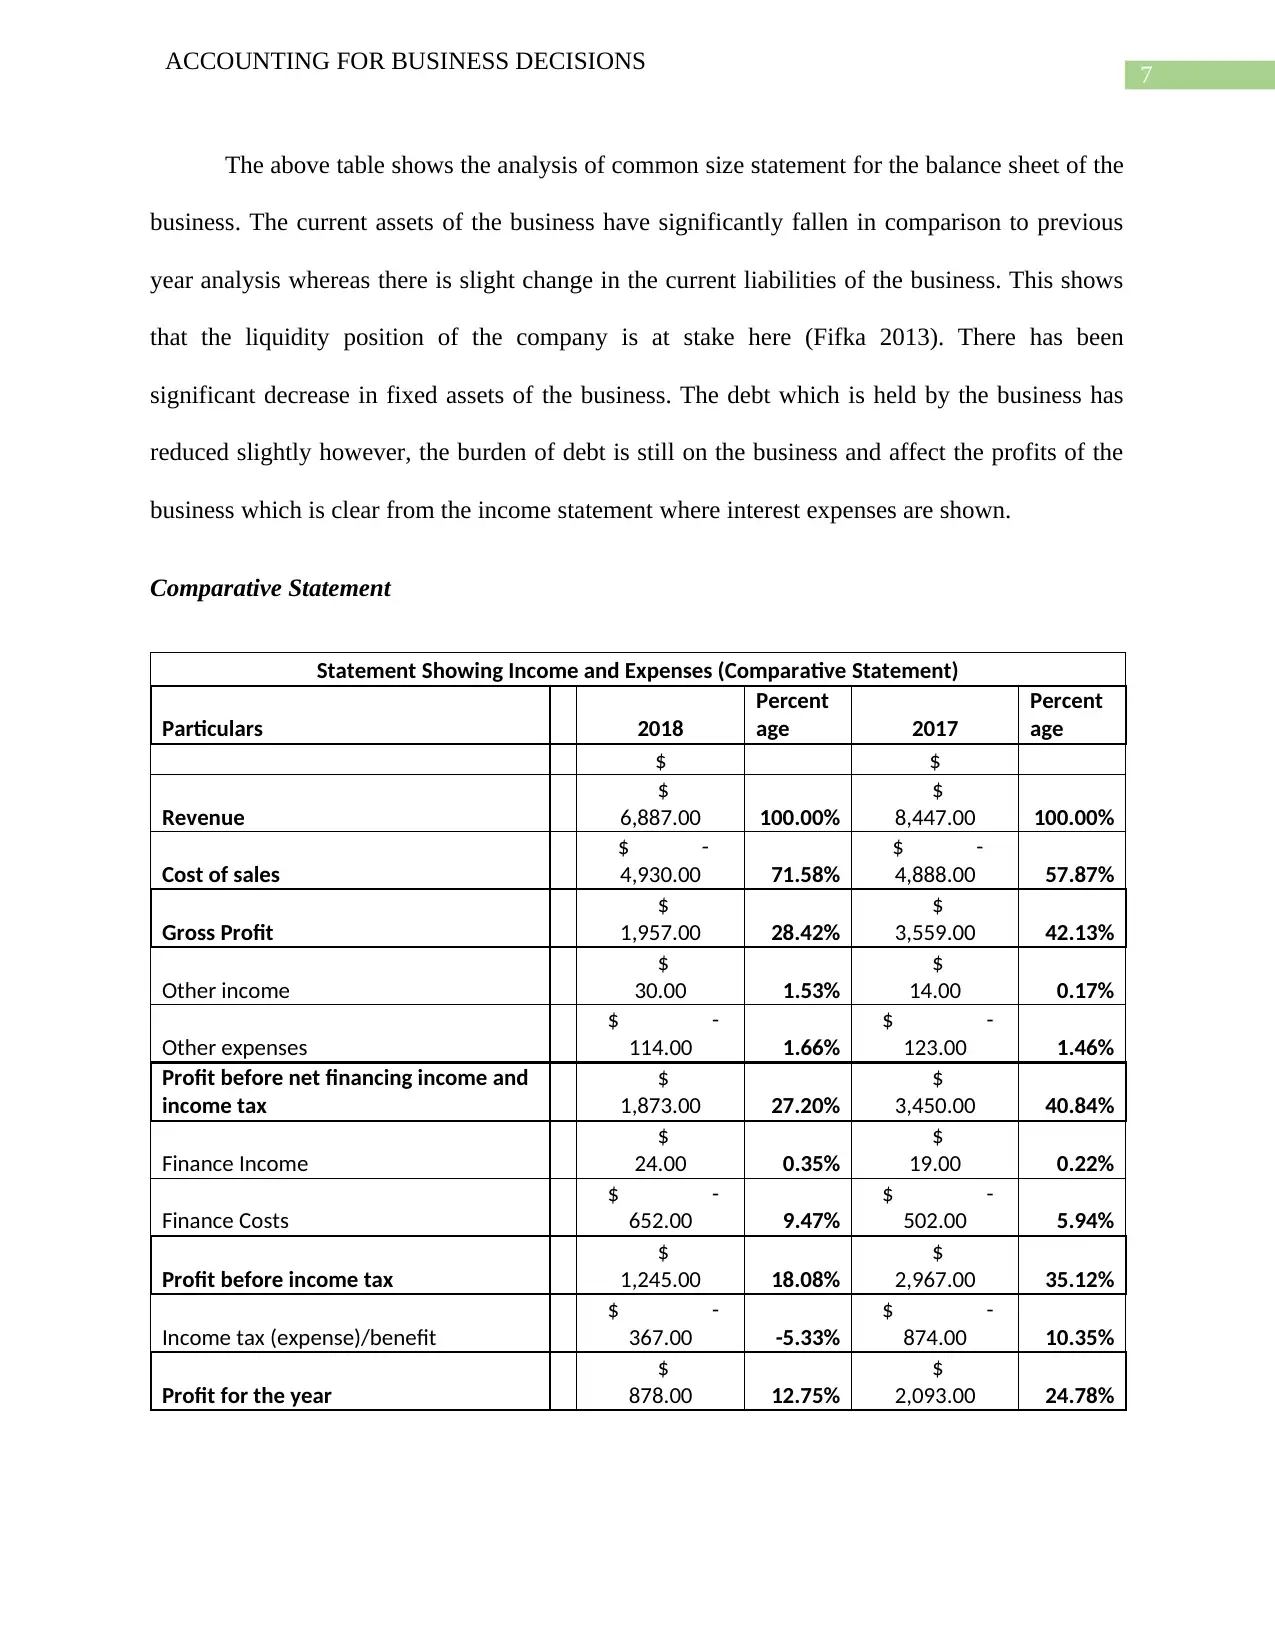
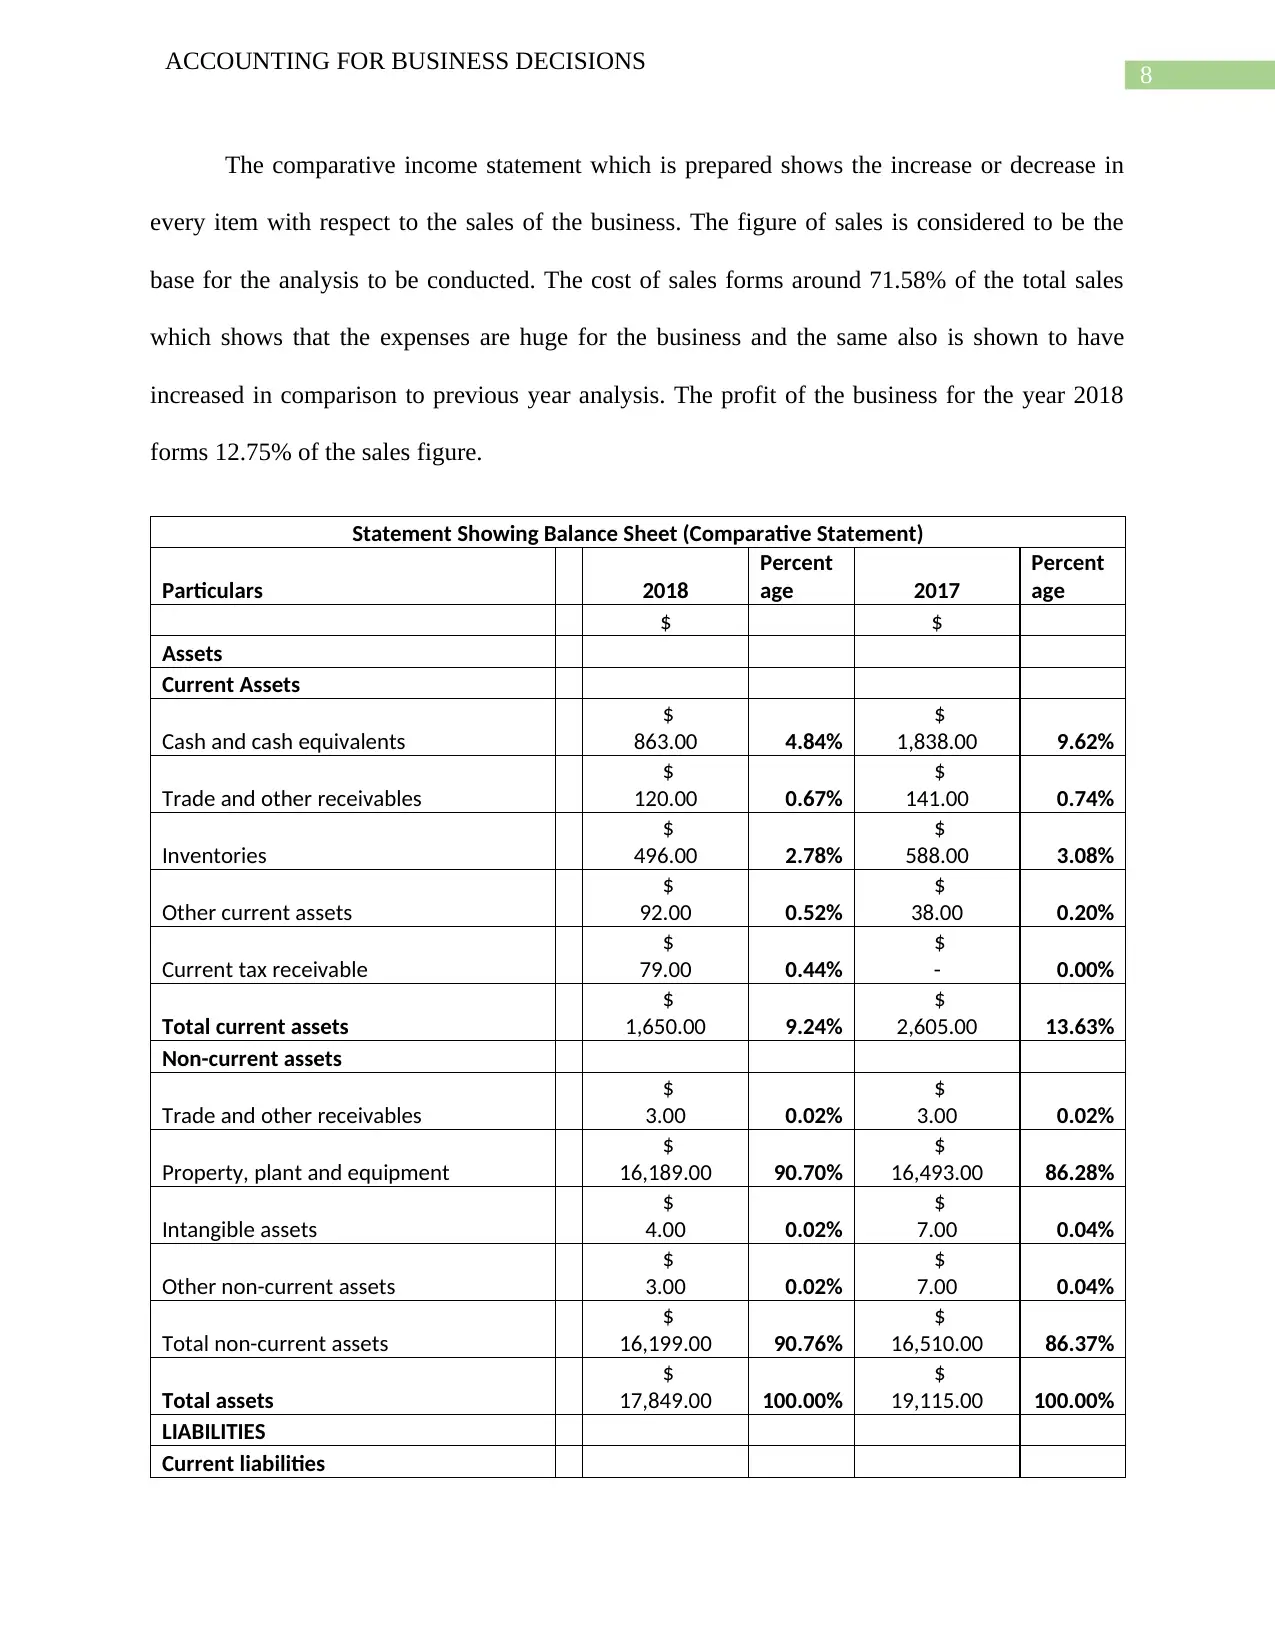
The comparative income statement which is prepared shows the increase or decrease in
every item with respect to the sales of the business. The figure of sales is considered to be the
base for the analysis to be conducted. The cost of sales forms around 71.58% of the total sales
which shows that the expenses are huge for the business and the same also is shown to have
increased in comparison to previous year analysis. The profit of the business for the year 2018
forms 12.75% of the sales figure.
Statement Showing Balance Sheet (Comparative Statement)
Particulars 2018
Percent
age 2017
Percent
age
$ $
Assets
Current Assets
Cash and cash equivalents
$
863.00 4.84%
$
1,838.00 9.62%
Trade and other receivables
$
120.00 0.67%
$
141.00 0.74%
Inventories
$
496.00 2.78%
$
588.00 3.08%
Other current assets
$
92.00 0.52%
$
38.00 0.20%
Current tax receivable
$
79.00 0.44%
$
- 0.00%
Total current assets
$
1,650.00 9.24%
$
2,605.00 13.63%
Non-current assets
Trade and other receivables
$
3.00 0.02%
$
3.00 0.02%
Property, plant and equipment
$
16,189.00 90.70%
$
16,493.00 86.28%
Intangible assets
$
4.00 0.02%
$
7.00 0.04%
Other non-current assets
$
3.00 0.02%
$
7.00 0.04%
Total non-current assets
$
16,199.00 90.76%
$
16,510.00 86.37%
Total assets
$
17,849.00 100.00%
$
19,115.00 100.00%
LIABILITIES
Current liabilities
ACCOUNTING FOR BUSINESS DECISIONS
The comparative income statement which is prepared shows the increase or decrease in
every item with respect to the sales of the business. The figure of sales is considered to be the
base for the analysis to be conducted. The cost of sales forms around 71.58% of the total sales
which shows that the expenses are huge for the business and the same also is shown to have
increased in comparison to previous year analysis. The profit of the business for the year 2018
forms 12.75% of the sales figure.
Statement Showing Balance Sheet (Comparative Statement)
Particulars 2018
Percent
age 2017
Percent
age
$ $
Assets
Current Assets
Cash and cash equivalents
$
863.00 4.84%
$
1,838.00 9.62%
Trade and other receivables
$
120.00 0.67%
$
141.00 0.74%
Inventories
$
496.00 2.78%
$
588.00 3.08%
Other current assets
$
92.00 0.52%
$
38.00 0.20%
Current tax receivable
$
79.00 0.44%
$
- 0.00%
Total current assets
$
1,650.00 9.24%
$
2,605.00 13.63%
Non-current assets
Trade and other receivables
$
3.00 0.02%
$
3.00 0.02%
Property, plant and equipment
$
16,189.00 90.70%
$
16,493.00 86.28%
Intangible assets
$
4.00 0.02%
$
7.00 0.04%
Other non-current assets
$
3.00 0.02%
$
7.00 0.04%
Total non-current assets
$
16,199.00 90.76%
$
16,510.00 86.37%
Total assets
$
17,849.00 100.00%
$
19,115.00 100.00%
LIABILITIES
Current liabilities
⊘ This is a preview!⊘
Do you want full access?
Subscribe today to unlock all pages.
Trusted by 1+ million students worldwide
9
ACCOUNTING FOR BUSINESS DECISIONS
Trade and other payables
$
678.00 8.35%
$
708.00 7.56%
Deferred income
$
267.00 3.29%
$
461.00 4.92%
Borrowings and finance lease liabilities
$
97.00 1.20%
$
121.00 1.29%
Provisions
$
197.00 2.43%
$
227.00 2.42%
Current tax payable
$
- 0.00%
$
685.00 7.32%
Total current liabilities
$
1,239.00 15.26%
$
2,202.00 23.52%
Non-current liabilities
Trade and other payables
$
50.00 0.62%
$
50.00 0.53%
Deferred income
$
528.00 6.50%
$
427.00 4.56%
Borrowings and finance lease liabilities
$
3,878.00 47.78%
$
4,350.00 46.47%
Provisions
$
546.00 6.73%
$
509.00 5.44%
Deferred joint venture contributions
$
270.00 3.33%
$
266.00 2.84%
Deferred tax liabilities
$
1,606.00 19.79%
$
1,557.00 16.63%
Total non-current liabilities
$
6,878.00 84.74%
$
7,159.00 76.48%
Total liabilities
$
8,117.00 100.00%
$
9,361.00 100.00%
Net assets
$
9,732.00
$
9,754.00
EQUITY
Contributed equity
$
1,287.00 13.22%
$
1,289.00 13.24%
Reserves
$
46.00 0.47%
$
39.00 0.40%
Retained earnings
$
8,386.00 86.17%
$
8,392.00 86.21%
Equity attributable to equity holders of
the Company
$
9,719.00 99.87%
$
9,720.00 99.86%
Non-controlling interest
$
13.00 0.13%
$
14.00 0.14%
Total equity
$
9,732.00 100.00%
$
9,734.00 100.00%
Paraphrase This Document
Need a fresh take? Get an instant paraphrase of this document with our AI Paraphraser
10
ACCOUNTING FOR BUSINESS DECISIONS
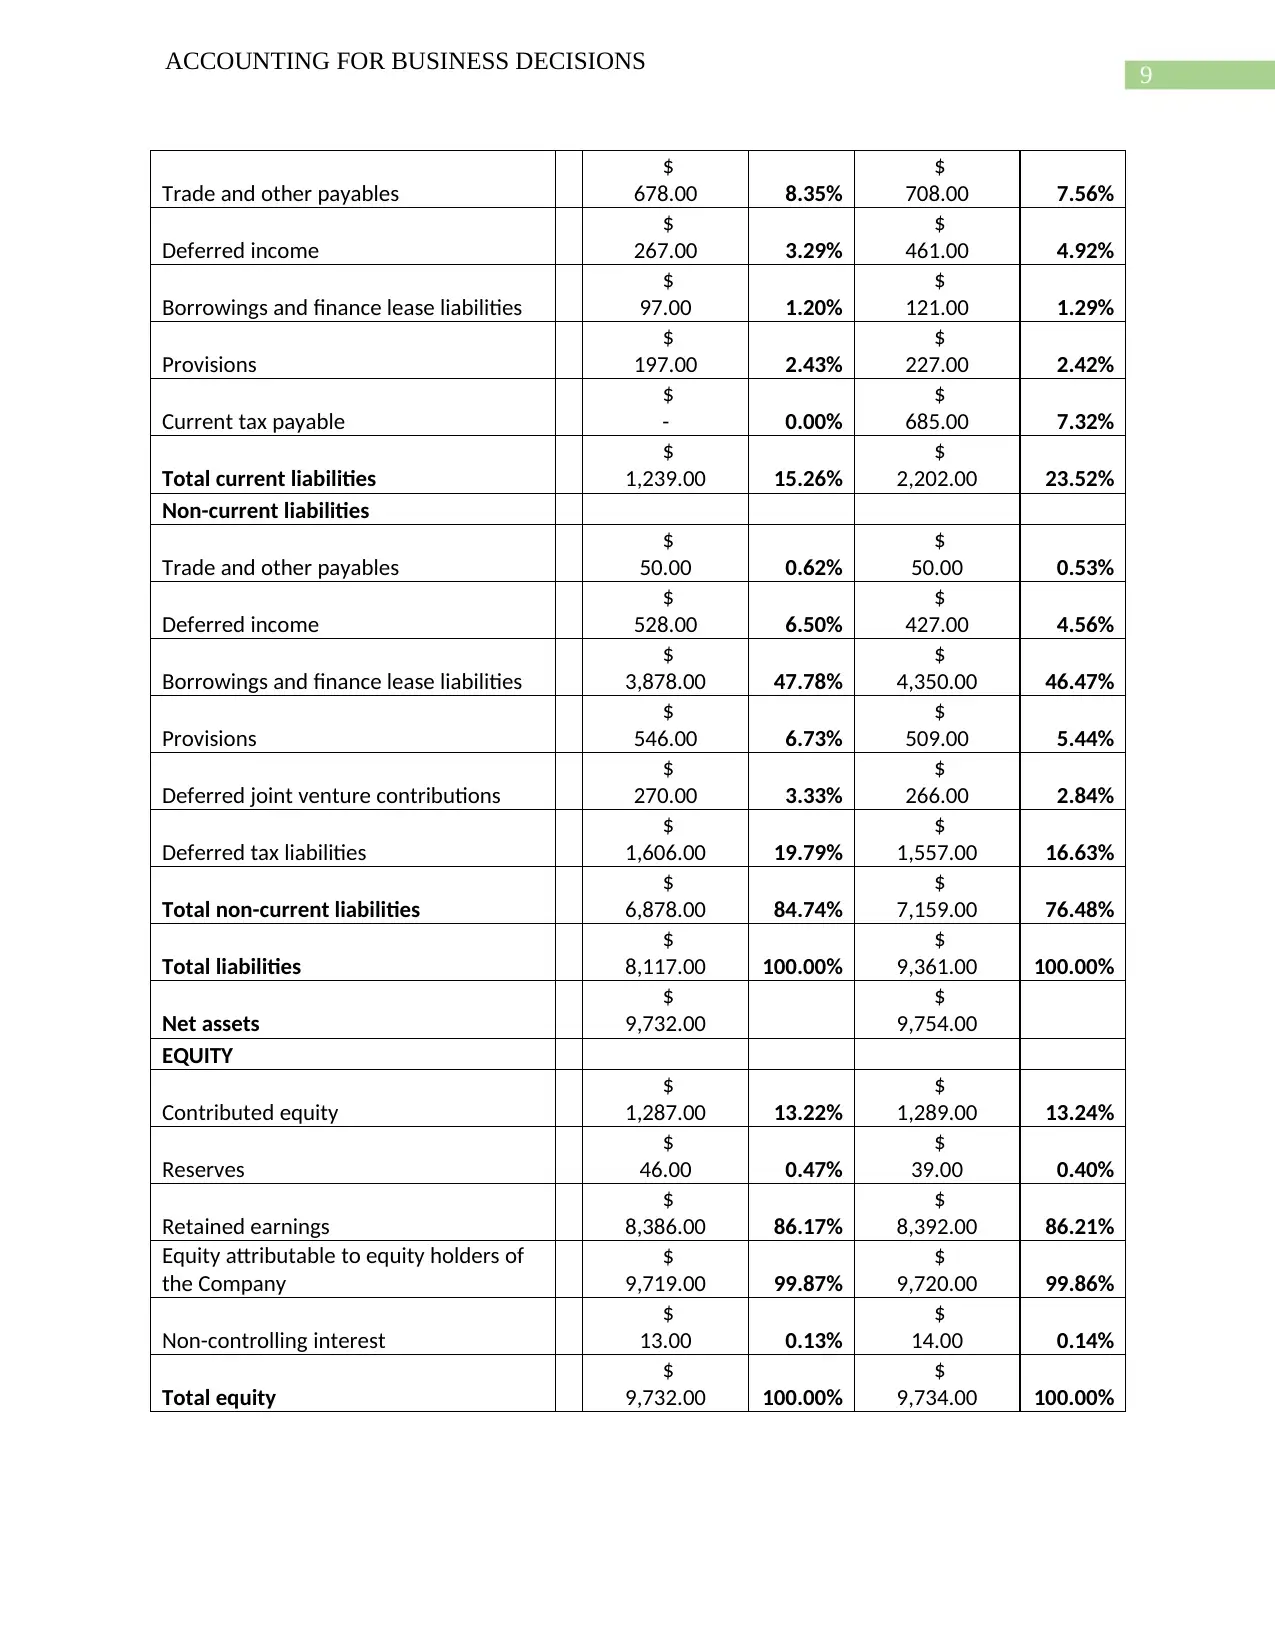
The comparative balance sheet which is shown in the above table shows that the base
which is taken by the business is of total assets in case of assets of the business, total liabilities in
case of liabilities of the business and total equity in case of equity items which are shown in the
annual reports of the business (Nobes 2014). The decrease in the current assets of the business is
clearly shown which is a matter of concern for the business. The borrowings of the business
which is shown in the liabilities side form the maximum portion of the liabilities of the business
during the period. In case of the equity-based funds the retained earnings of the business form
the maximum part of the estimate.
Comparison with a Competitor
The closest competitor of Fortescue Metals Group Ltd is Rio Tinto ltd which also has
operations in Australia and is regarded to one of the largest mining companies operating in
Australia. Another close competitor of the company is BHP Billiton ltd which is also regardd to
be one of the largest in the mining industry. The annual reports of Rio Tinto ltd shows that there
has been an increase in the profits of the business in comparison to last year and the business is
able reduce the overall costs of the business during the current year. In the case of Fortescue
Metals Group Ltd, the profitability of the business has been severely been affected due to the fall
in the sales of the business. The costs of Fortescue Metals Group Ltd during the year has also
risen which is a serious matter of concern for the business and needs to be handled by the
management of the company. The annual reports of the Fortescue Metals Group Ltd also shown
significant fall in the current assets of the business as well as total assets of the business which is
matter and can affect the going concern principle of the business as the liquidity of the business
is also in appropriate.
ACCOUNTING FOR BUSINESS DECISIONS
The comparative balance sheet which is shown in the above table shows that the base
which is taken by the business is of total assets in case of assets of the business, total liabilities in
case of liabilities of the business and total equity in case of equity items which are shown in the
annual reports of the business (Nobes 2014). The decrease in the current assets of the business is
clearly shown which is a matter of concern for the business. The borrowings of the business
which is shown in the liabilities side form the maximum portion of the liabilities of the business
during the period. In case of the equity-based funds the retained earnings of the business form
the maximum part of the estimate.
Comparison with a Competitor
The closest competitor of Fortescue Metals Group Ltd is Rio Tinto ltd which also has
operations in Australia and is regarded to one of the largest mining companies operating in
Australia. Another close competitor of the company is BHP Billiton ltd which is also regardd to
be one of the largest in the mining industry. The annual reports of Rio Tinto ltd shows that there
has been an increase in the profits of the business in comparison to last year and the business is
able reduce the overall costs of the business during the current year. In the case of Fortescue
Metals Group Ltd, the profitability of the business has been severely been affected due to the fall
in the sales of the business. The costs of Fortescue Metals Group Ltd during the year has also
risen which is a serious matter of concern for the business and needs to be handled by the
management of the company. The annual reports of the Fortescue Metals Group Ltd also shown
significant fall in the current assets of the business as well as total assets of the business which is
matter and can affect the going concern principle of the business as the liquidity of the business
is also in appropriate.
11
ACCOUNTING FOR BUSINESS DECISIONS
Ratio Analysis
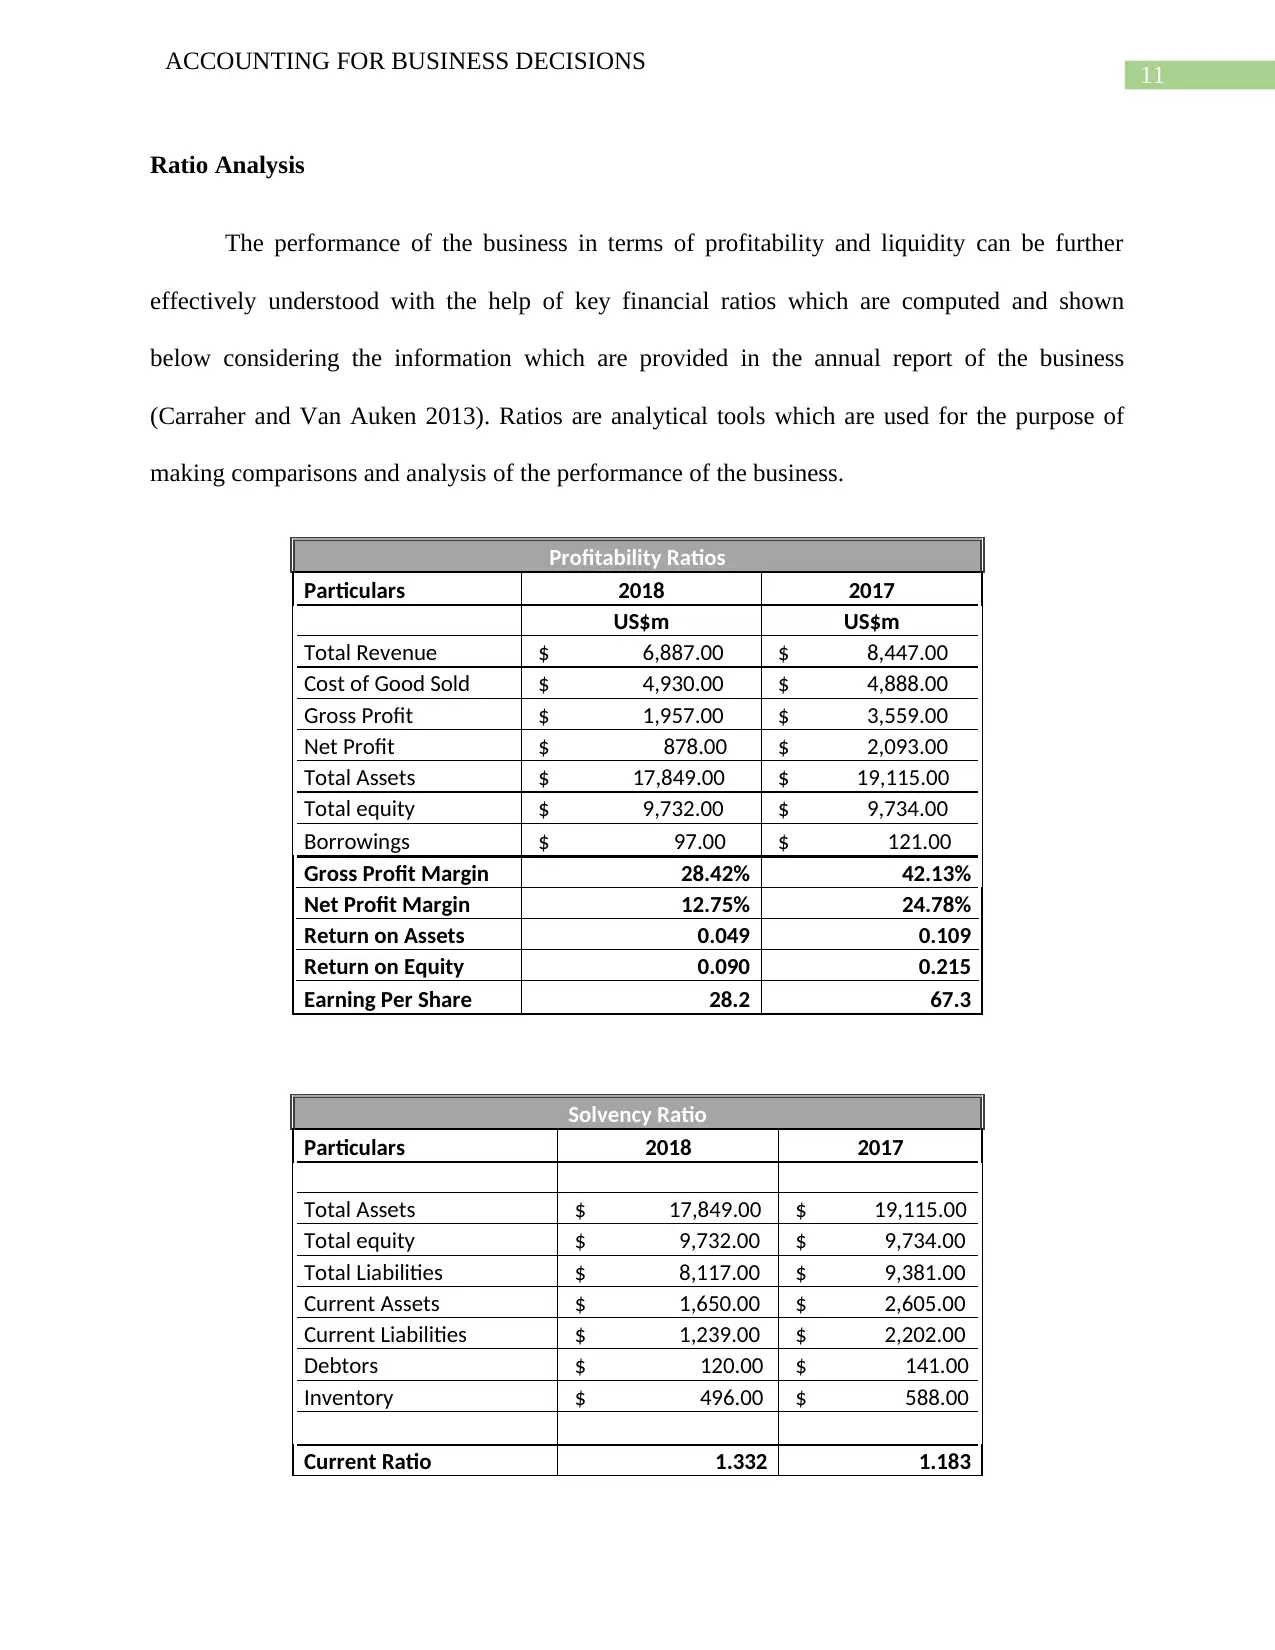
The performance of the business in terms of profitability and liquidity can be further
effectively understood with the help of key financial ratios which are computed and shown
below considering the information which are provided in the annual report of the business
(Carraher and Van Auken 2013). Ratios are analytical tools which are used for the purpose of
making comparisons and analysis of the performance of the business.
Profitability Ratios
Particulars 2018 2017
US$m US$m
Total Revenue $ 6,887.00 $ 8,447.00
Cost of Good Sold $ 4,930.00 $ 4,888.00
Gross Profit $ 1,957.00 $ 3,559.00
Net Profit $ 878.00 $ 2,093.00
Total Assets $ 17,849.00 $ 19,115.00
Total equity $ 9,732.00 $ 9,734.00
Borrowings $ 97.00 $ 121.00
Gross Profit Margin 28.42% 42.13%
Net Profit Margin 12.75% 24.78%
Return on Assets 0.049 0.109
Return on Equity 0.090 0.215
Earning Per Share 28.2 67.3
Solvency Ratio
Particulars 2018 2017
Total Assets $ 17,849.00 $ 19,115.00
Total equity $ 9,732.00 $ 9,734.00
Total Liabilities $ 8,117.00 $ 9,381.00
Current Assets $ 1,650.00 $ 2,605.00
Current Liabilities $ 1,239.00 $ 2,202.00
Debtors $ 120.00 $ 141.00
Inventory $ 496.00 $ 588.00
Current Ratio 1.332 1.183
ACCOUNTING FOR BUSINESS DECISIONS
Ratio Analysis
The performance of the business in terms of profitability and liquidity can be further
effectively understood with the help of key financial ratios which are computed and shown
below considering the information which are provided in the annual report of the business
(Carraher and Van Auken 2013). Ratios are analytical tools which are used for the purpose of
making comparisons and analysis of the performance of the business.
Profitability Ratios
Particulars 2018 2017
US$m US$m
Total Revenue $ 6,887.00 $ 8,447.00
Cost of Good Sold $ 4,930.00 $ 4,888.00
Gross Profit $ 1,957.00 $ 3,559.00
Net Profit $ 878.00 $ 2,093.00
Total Assets $ 17,849.00 $ 19,115.00
Total equity $ 9,732.00 $ 9,734.00
Borrowings $ 97.00 $ 121.00
Gross Profit Margin 28.42% 42.13%
Net Profit Margin 12.75% 24.78%
Return on Assets 0.049 0.109
Return on Equity 0.090 0.215
Earning Per Share 28.2 67.3
Solvency Ratio
Particulars 2018 2017
Total Assets $ 17,849.00 $ 19,115.00
Total equity $ 9,732.00 $ 9,734.00
Total Liabilities $ 8,117.00 $ 9,381.00
Current Assets $ 1,650.00 $ 2,605.00
Current Liabilities $ 1,239.00 $ 2,202.00
Debtors $ 120.00 $ 141.00
Inventory $ 496.00 $ 588.00
Current Ratio 1.332 1.183
⊘ This is a preview!⊘
Do you want full access?
Subscribe today to unlock all pages.
Trusted by 1+ million students worldwide
1 out of 17
Related Documents


Your All-in-One AI-Powered Toolkit for Academic Success.
+13062052269
info@desklib.com
Available 24*7 on WhatsApp / Email
![[object Object]](/_next/static/media/star-bottom.7253800d.svg)
Unlock your academic potential
Copyright © 2020–2026 A2Z Services. All Rights Reserved. Developed and managed by ZUCOL.