Financial Statement Analysis for General Mills and Kimberly-Clark

Verified

Added on  2020/05/28

|6
|632
|80
Homework Assignment
AI Summary
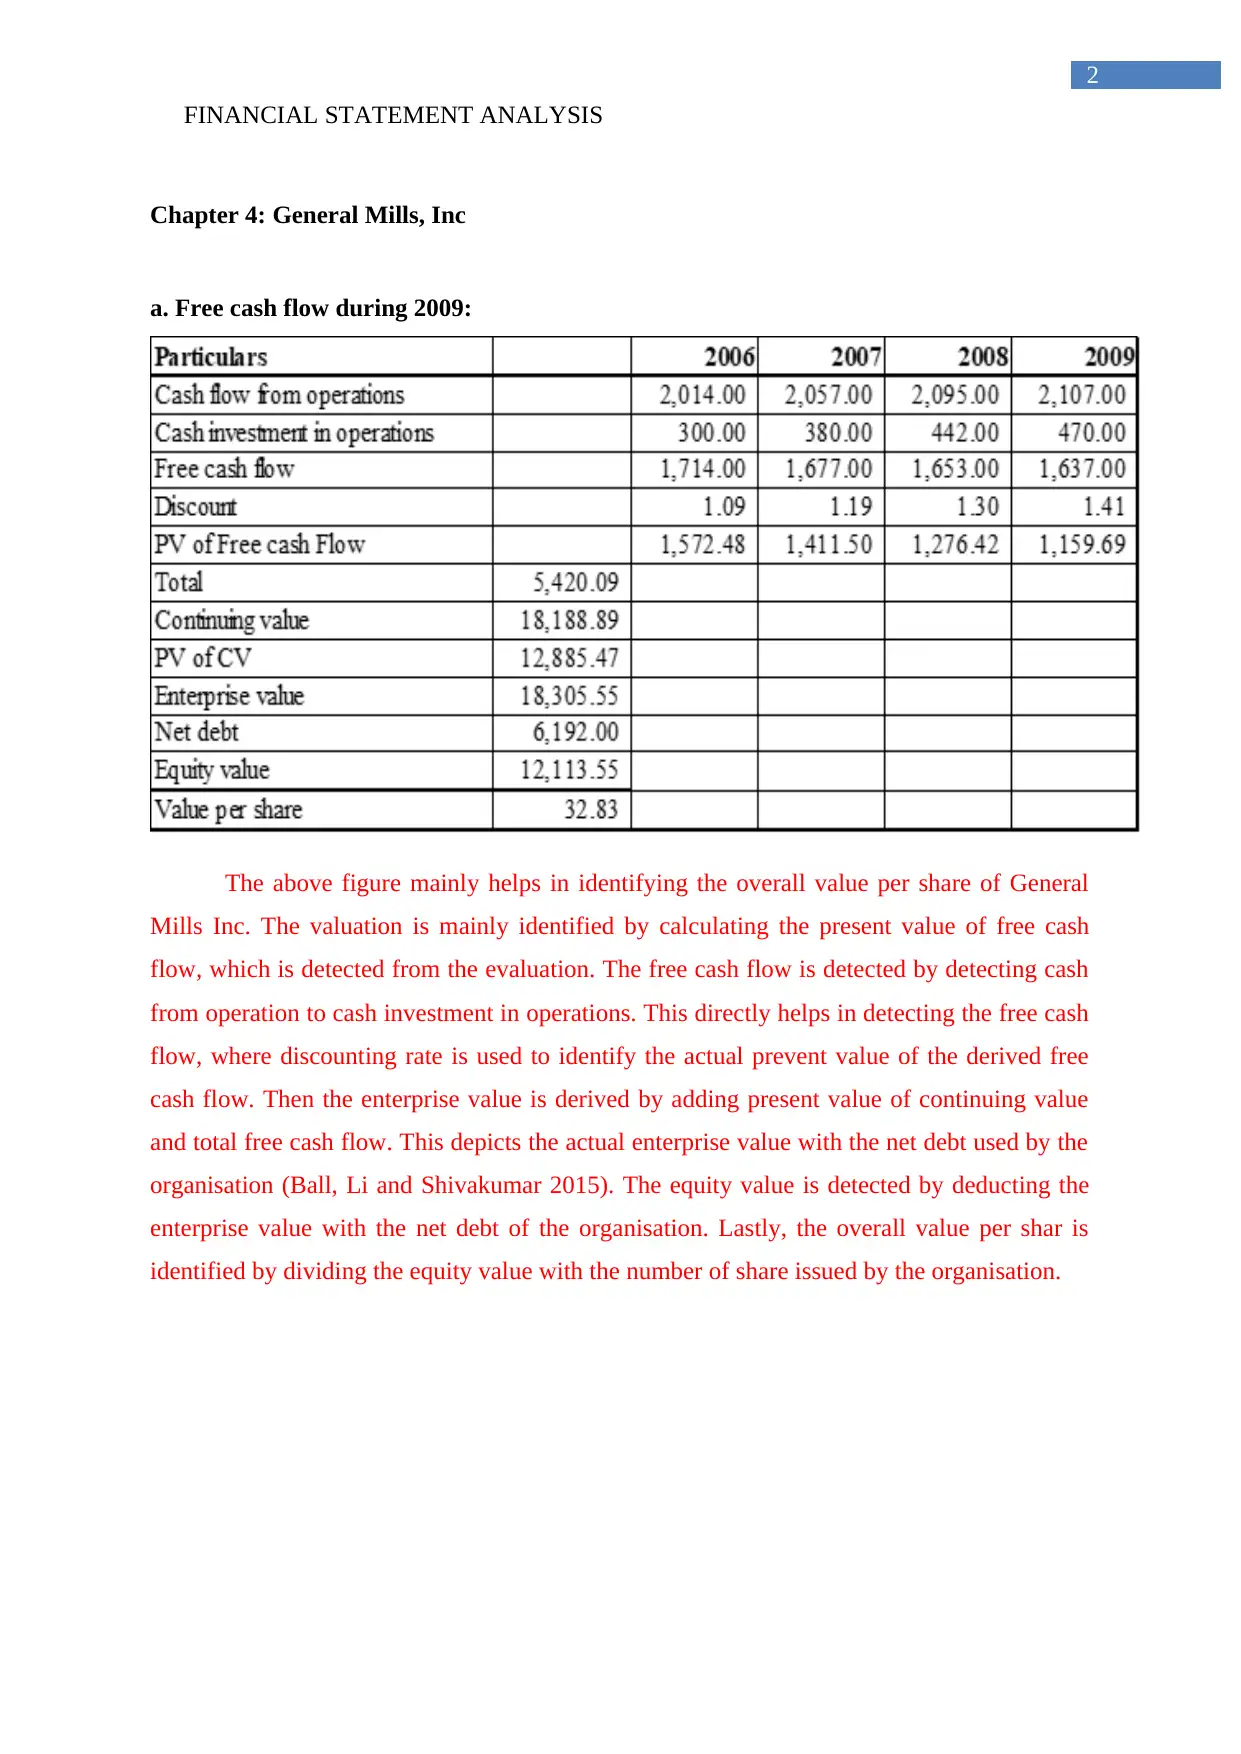
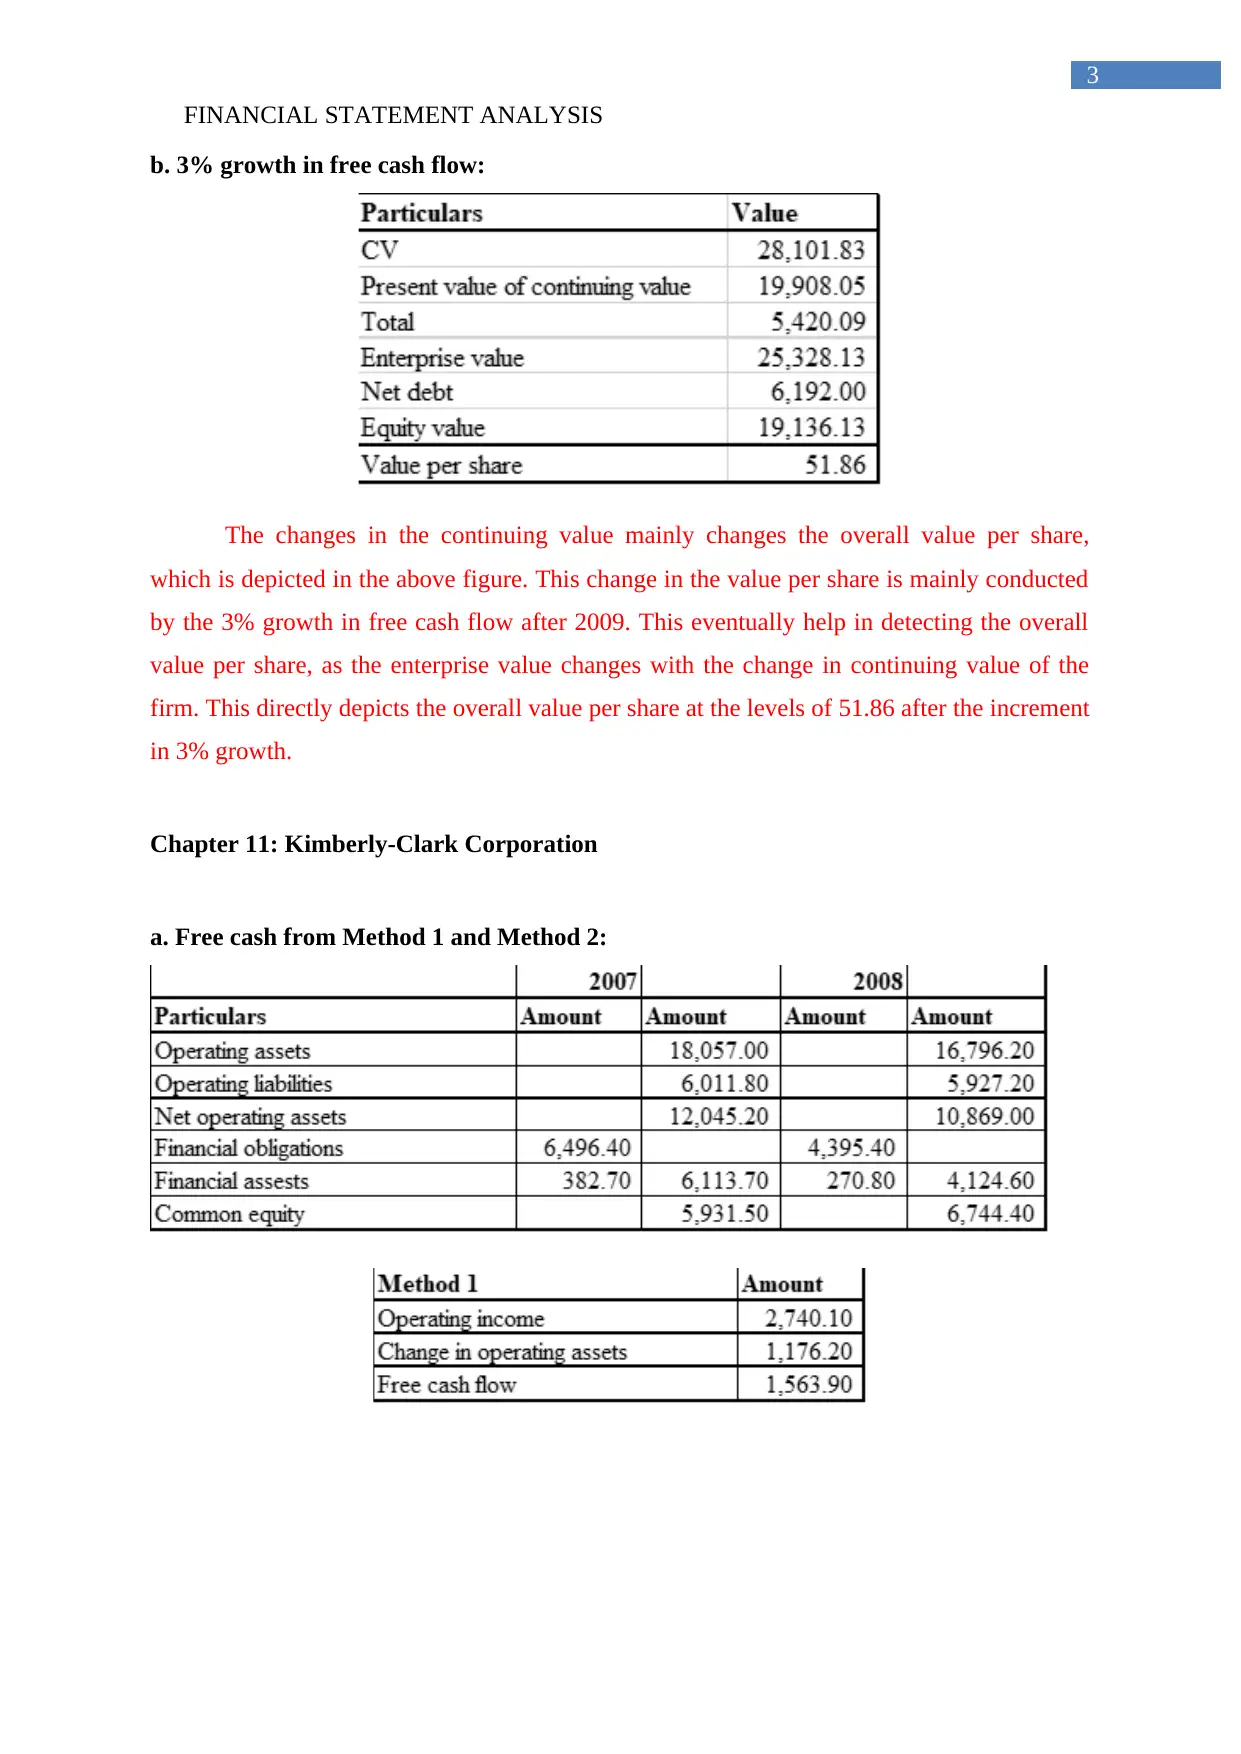
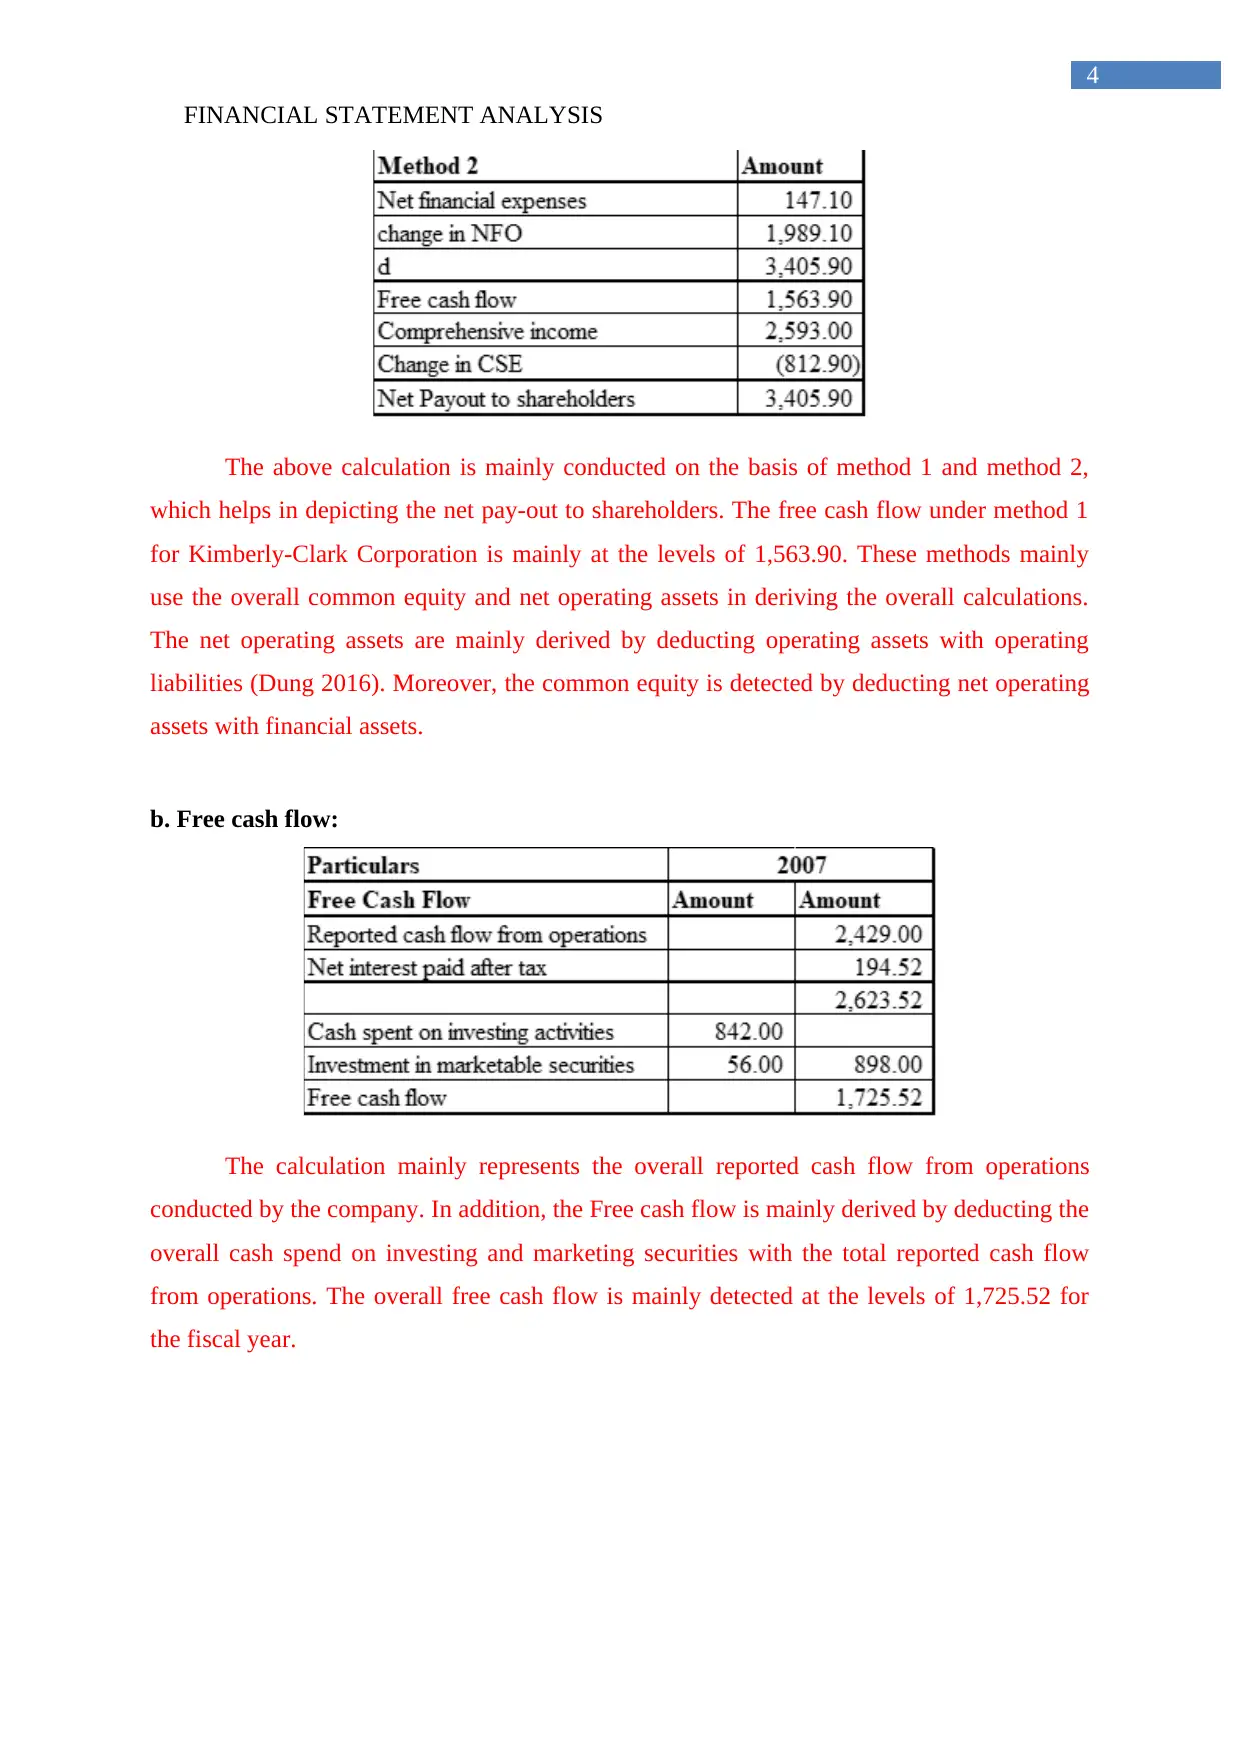
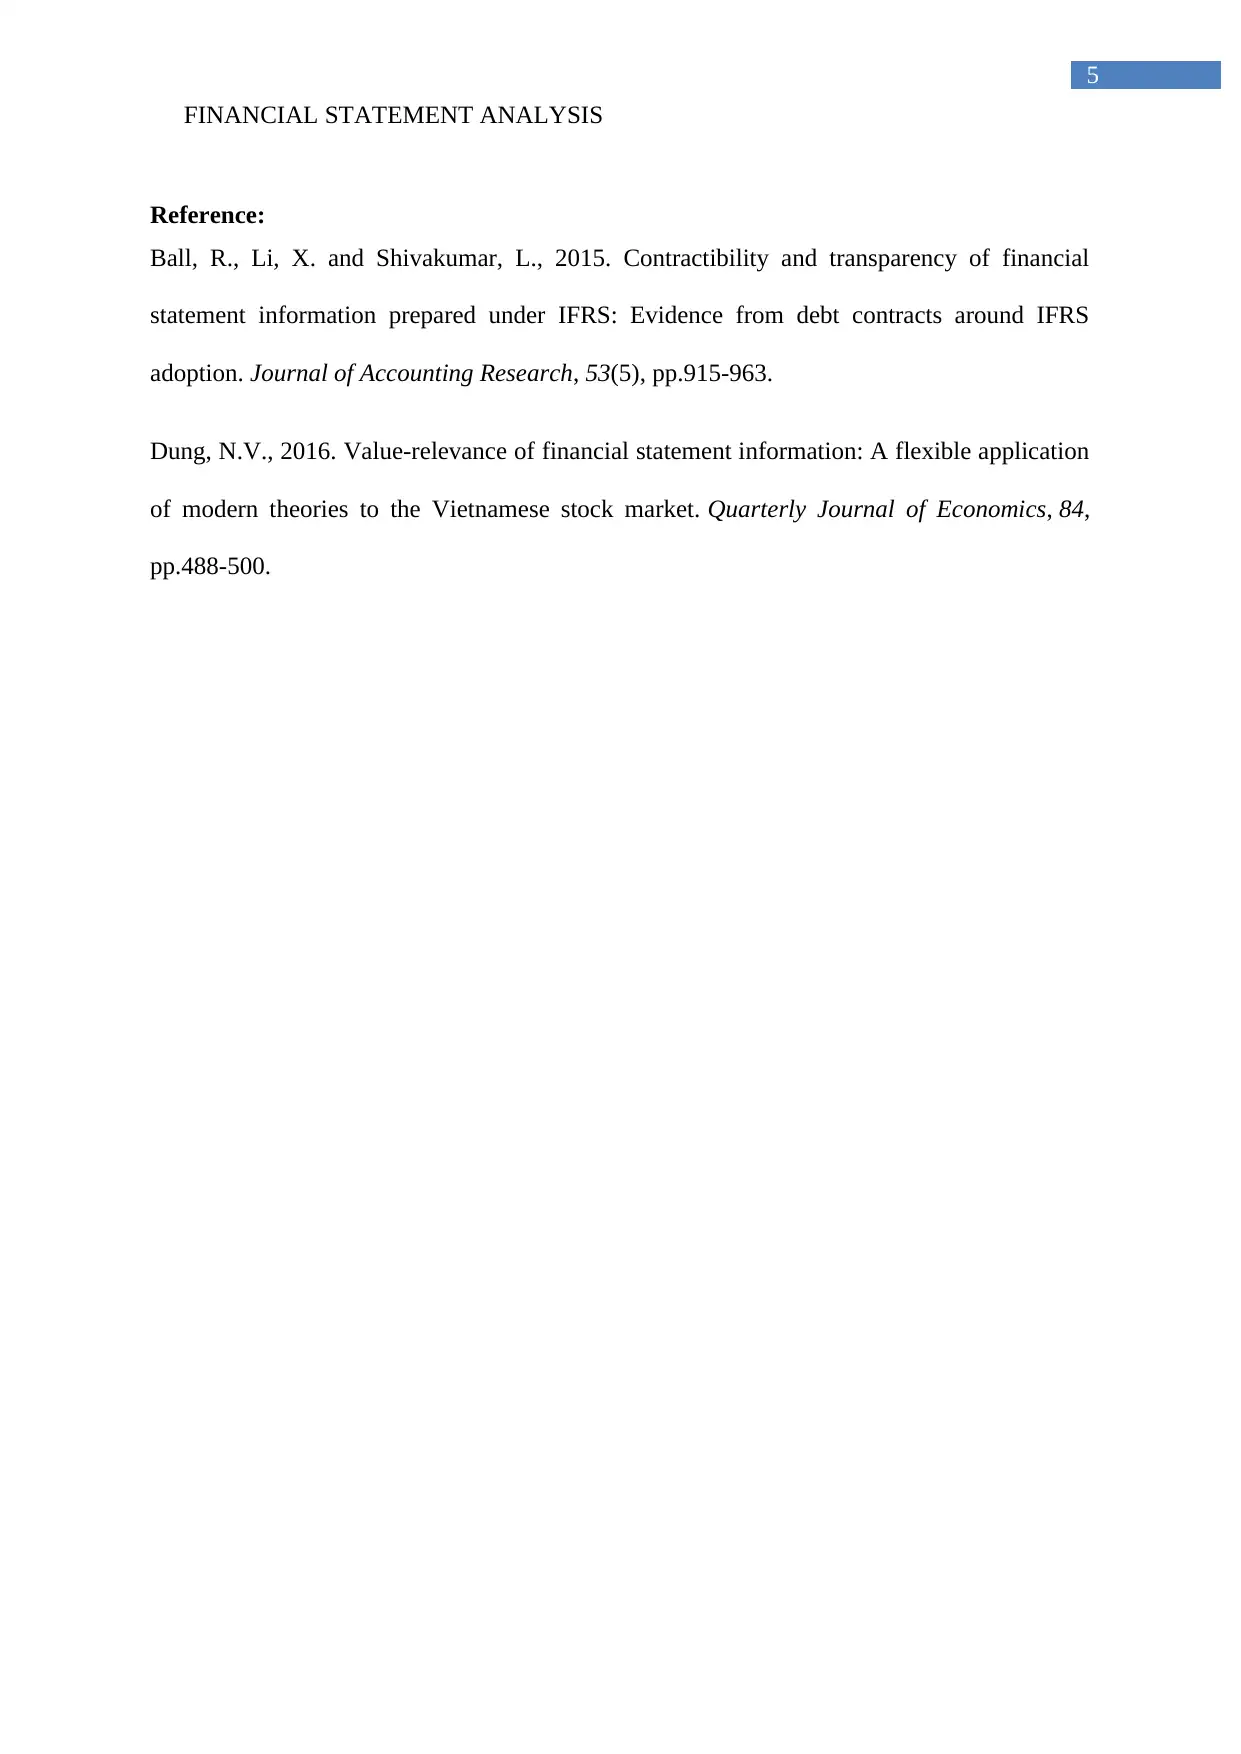
The assignment involves a detailed analysis of financial statements from two corporations, General Mills, Inc. and Kimberly-Clark Corporation. It emphasizes calculating free cash flow during 2009 for General Mills using the present value method to determine enterprise value and subsequently identify the overall value per share. A subsequent section examines how a projected 3% growth in free cash flow influences the company's valuation metrics. For Kimberly-Clark, the assignment includes calculations of free cash flow using two different methods—Method 1 and Method 2—and evaluating the net payout to shareholders. The report concludes with an analysis of reported operating cash flows and the deduction of investing and financing activities to determine overall free cash flow for the fiscal year.
Document Page
Running head: FINANCIAL STATEMENT ANALYSIS
Financial Statement Analysis
Name of the Student:
Name of the University:
Authors Note:
tabler-icon-diamond-filled.svg

Paraphrase This Document

Need a fresh take? Get an instant paraphrase of this document with our AI Paraphraser
Document Page
FINANCIAL STATEMENT ANALYSIS
1
Table of Contents
Chapter 4: General Mills, Inc.....................................................................................................2
a. Free cash flow during 2009:...................................................................................................2
b. 3% growth in free cash flow:.................................................................................................3
Chapter 11: Kimberly-Clark Corporation..................................................................................3
a. Free cash from Method 1 and Method 2:...............................................................................3
b. Free cash flow:.......................................................................................................................4
Reference:..................................................................................................................................5
Document Page
FINANCIAL STATEMENT ANALYSIS
2
Chapter 4: General Mills, Inc
a. Free cash flow during 2009:
The above figure mainly helps in identifying the overall value per share of General
Mills Inc. The valuation is mainly identified by calculating the present value of free cash
flow, which is detected from the evaluation. The free cash flow is detected by detecting cash
from operation to cash investment in operations. This directly helps in detecting the free cash
flow, where discounting rate is used to identify the actual prevent value of the derived free
cash flow. Then the enterprise value is derived by adding present value of continuing value
and total free cash flow. This depicts the actual enterprise value with the net debt used by the
organisation (Ball, Li and Shivakumar 2015). The equity value is detected by deducting the
enterprise value with the net debt of the organisation. Lastly, the overall value per shar is
identified by dividing the equity value with the number of share issued by the organisation.
Document Page
FINANCIAL STATEMENT ANALYSIS
3
b. 3% growth in free cash flow:
The changes in the continuing value mainly changes the overall value per share,
which is depicted in the above figure. This change in the value per share is mainly conducted
by the 3% growth in free cash flow after 2009. This eventually help in detecting the overall
value per share, as the enterprise value changes with the change in continuing value of the
firm. This directly depicts the overall value per share at the levels of 51.86 after the increment
in 3% growth.
Chapter 11: Kimberly-Clark Corporation
a. Free cash from Method 1 and Method 2:
tabler-icon-diamond-filled.svg

Paraphrase This Document

Need a fresh take? Get an instant paraphrase of this document with our AI Paraphraser
Document Page
FINANCIAL STATEMENT ANALYSIS
4
The above calculation is mainly conducted on the basis of method 1 and method 2,
which helps in depicting the net pay-out to shareholders. The free cash flow under method 1
for Kimberly-Clark Corporation is mainly at the levels of 1,563.90. These methods mainly
use the overall common equity and net operating assets in deriving the overall calculations.
The net operating assets are mainly derived by deducting operating assets with operating
liabilities (Dung 2016). Moreover, the common equity is detected by deducting net operating
assets with financial assets.
b. Free cash flow:
The calculation mainly represents the overall reported cash flow from operations
conducted by the company. In addition, the Free cash flow is mainly derived by deducting the
overall cash spend on investing and marketing securities with the total reported cash flow
from operations. The overall free cash flow is mainly detected at the levels of 1,725.52 for
the fiscal year.
Document Page
FINANCIAL STATEMENT ANALYSIS
5
Reference:
Ball, R., Li, X. and Shivakumar, L., 2015. Contractibility and transparency of financial
statement information prepared under IFRS: Evidence from debt contracts around IFRS
adoption. Journal of Accounting Research, 53(5), pp.915-963.
Dung, N.V., 2016. Value-relevance of financial statement information: A flexible application
of modern theories to the Vietnamese stock market. Quarterly Journal of Economics, 84,
pp.488-500.
chevron_up_icon
1 out of 6
circle_padding
hide_on_mobile
zoom_out_icon
[object Object]