Finance: Accounting and Management Decisions - Week 10 Analysis

Verified

Added on  2023/04/20

|11
|1735
|88
Homework Assignment
AI Summary
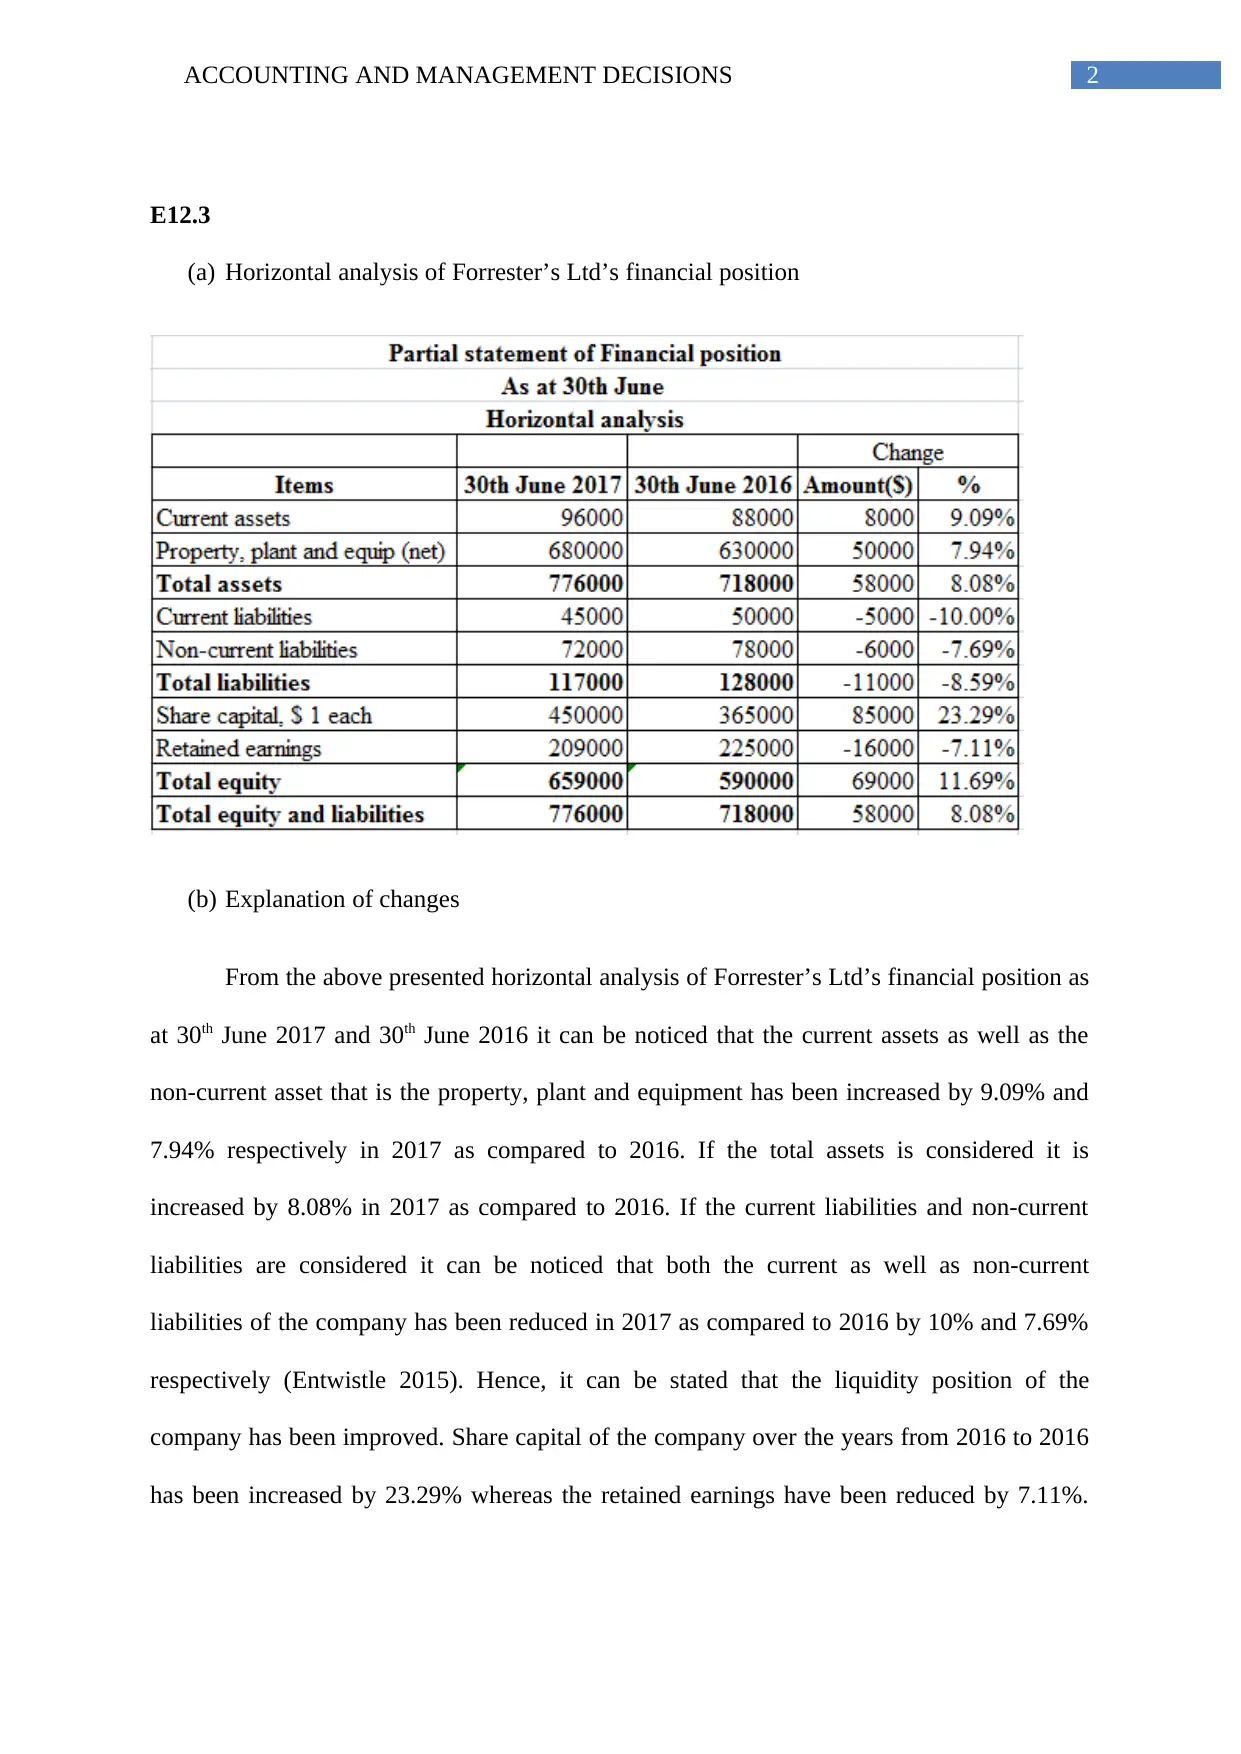
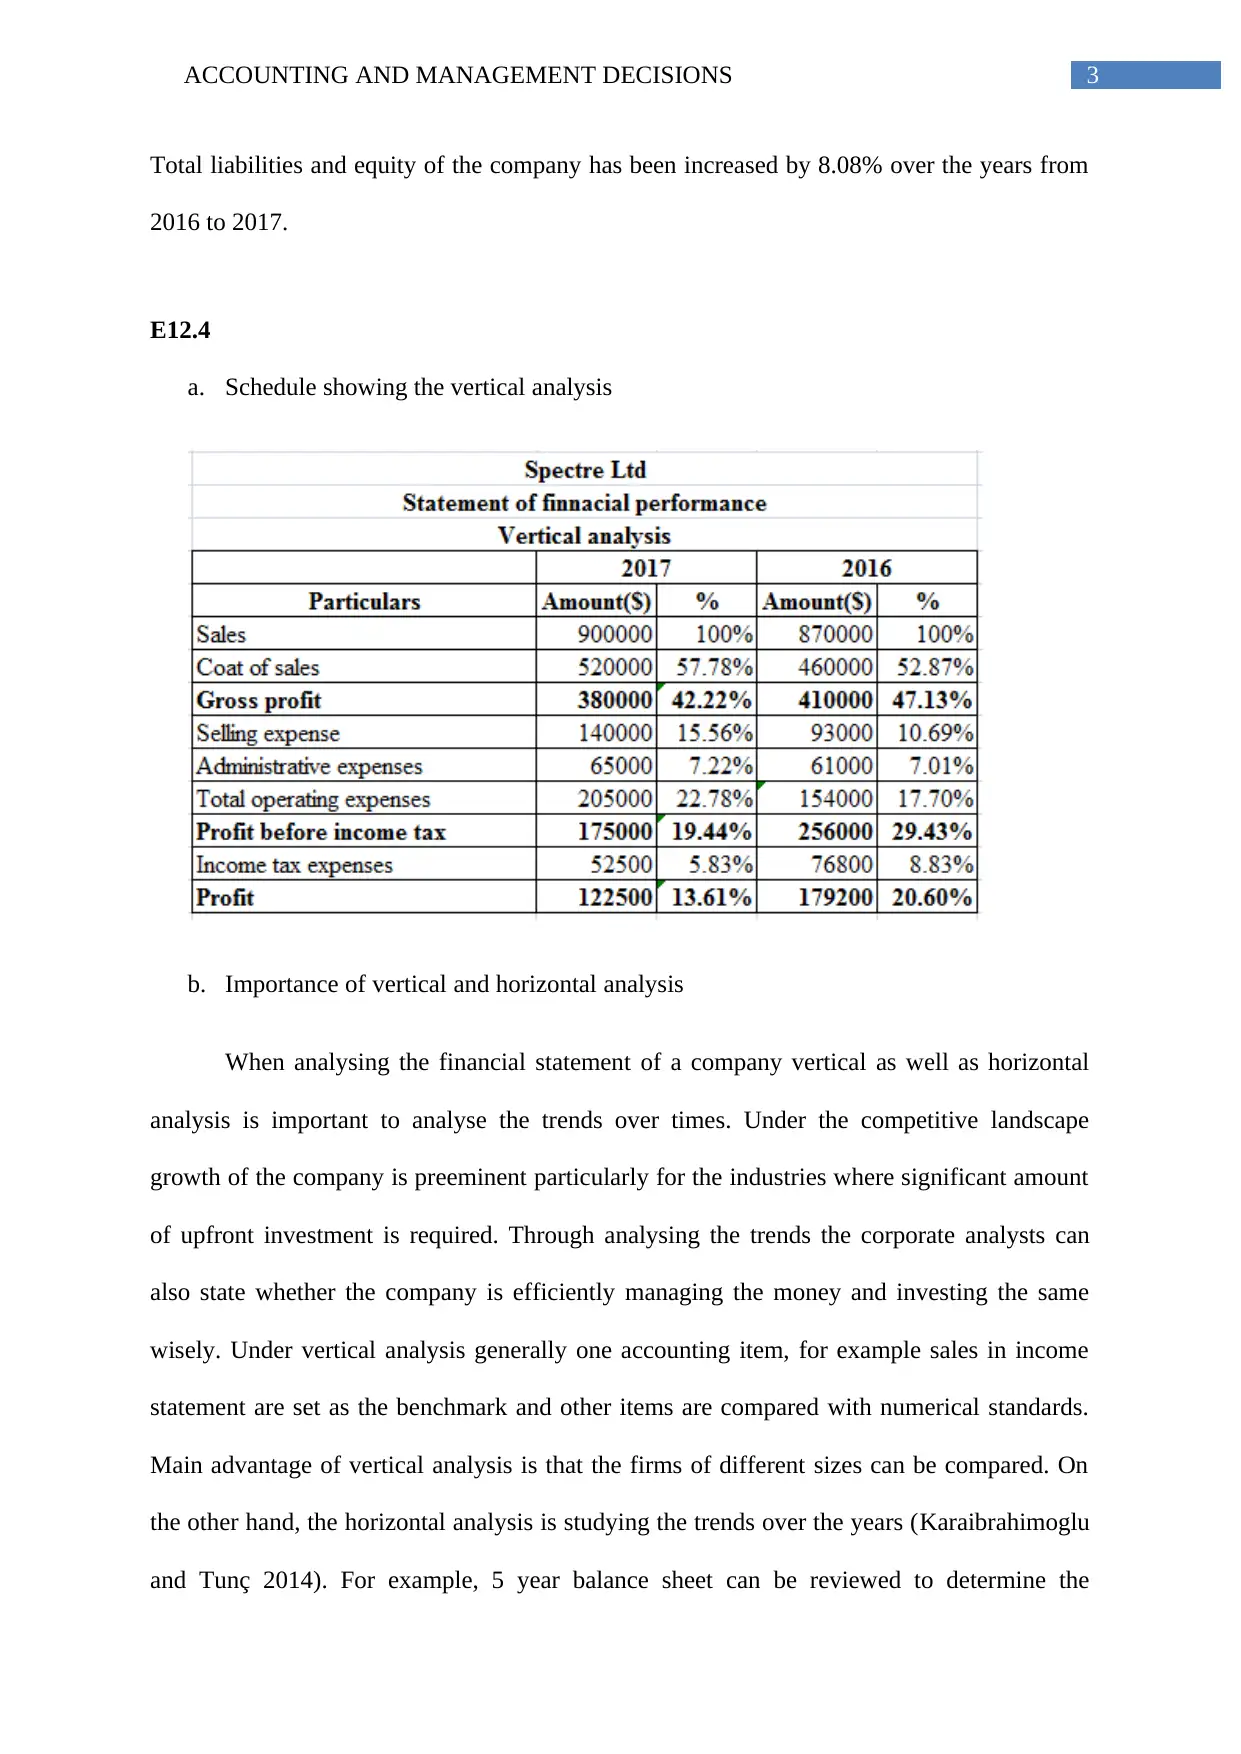
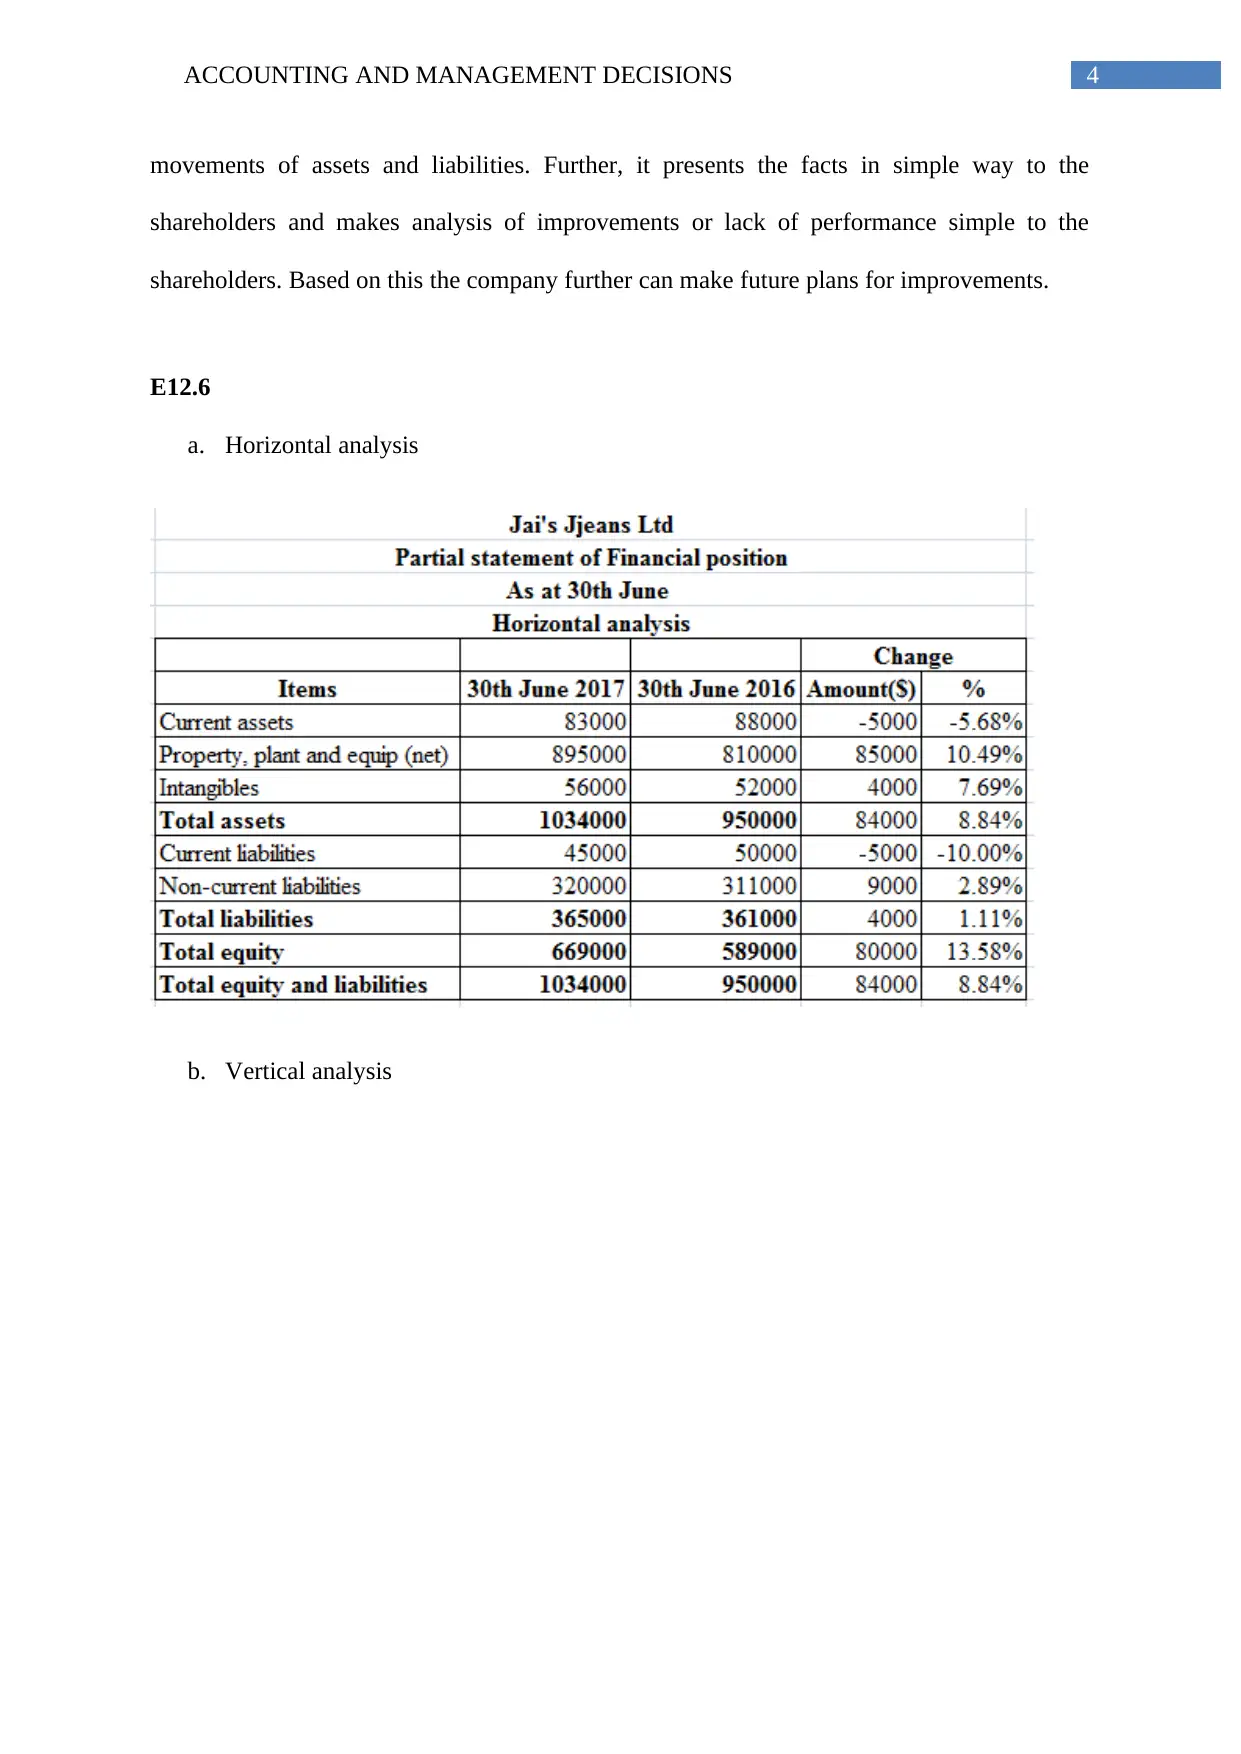
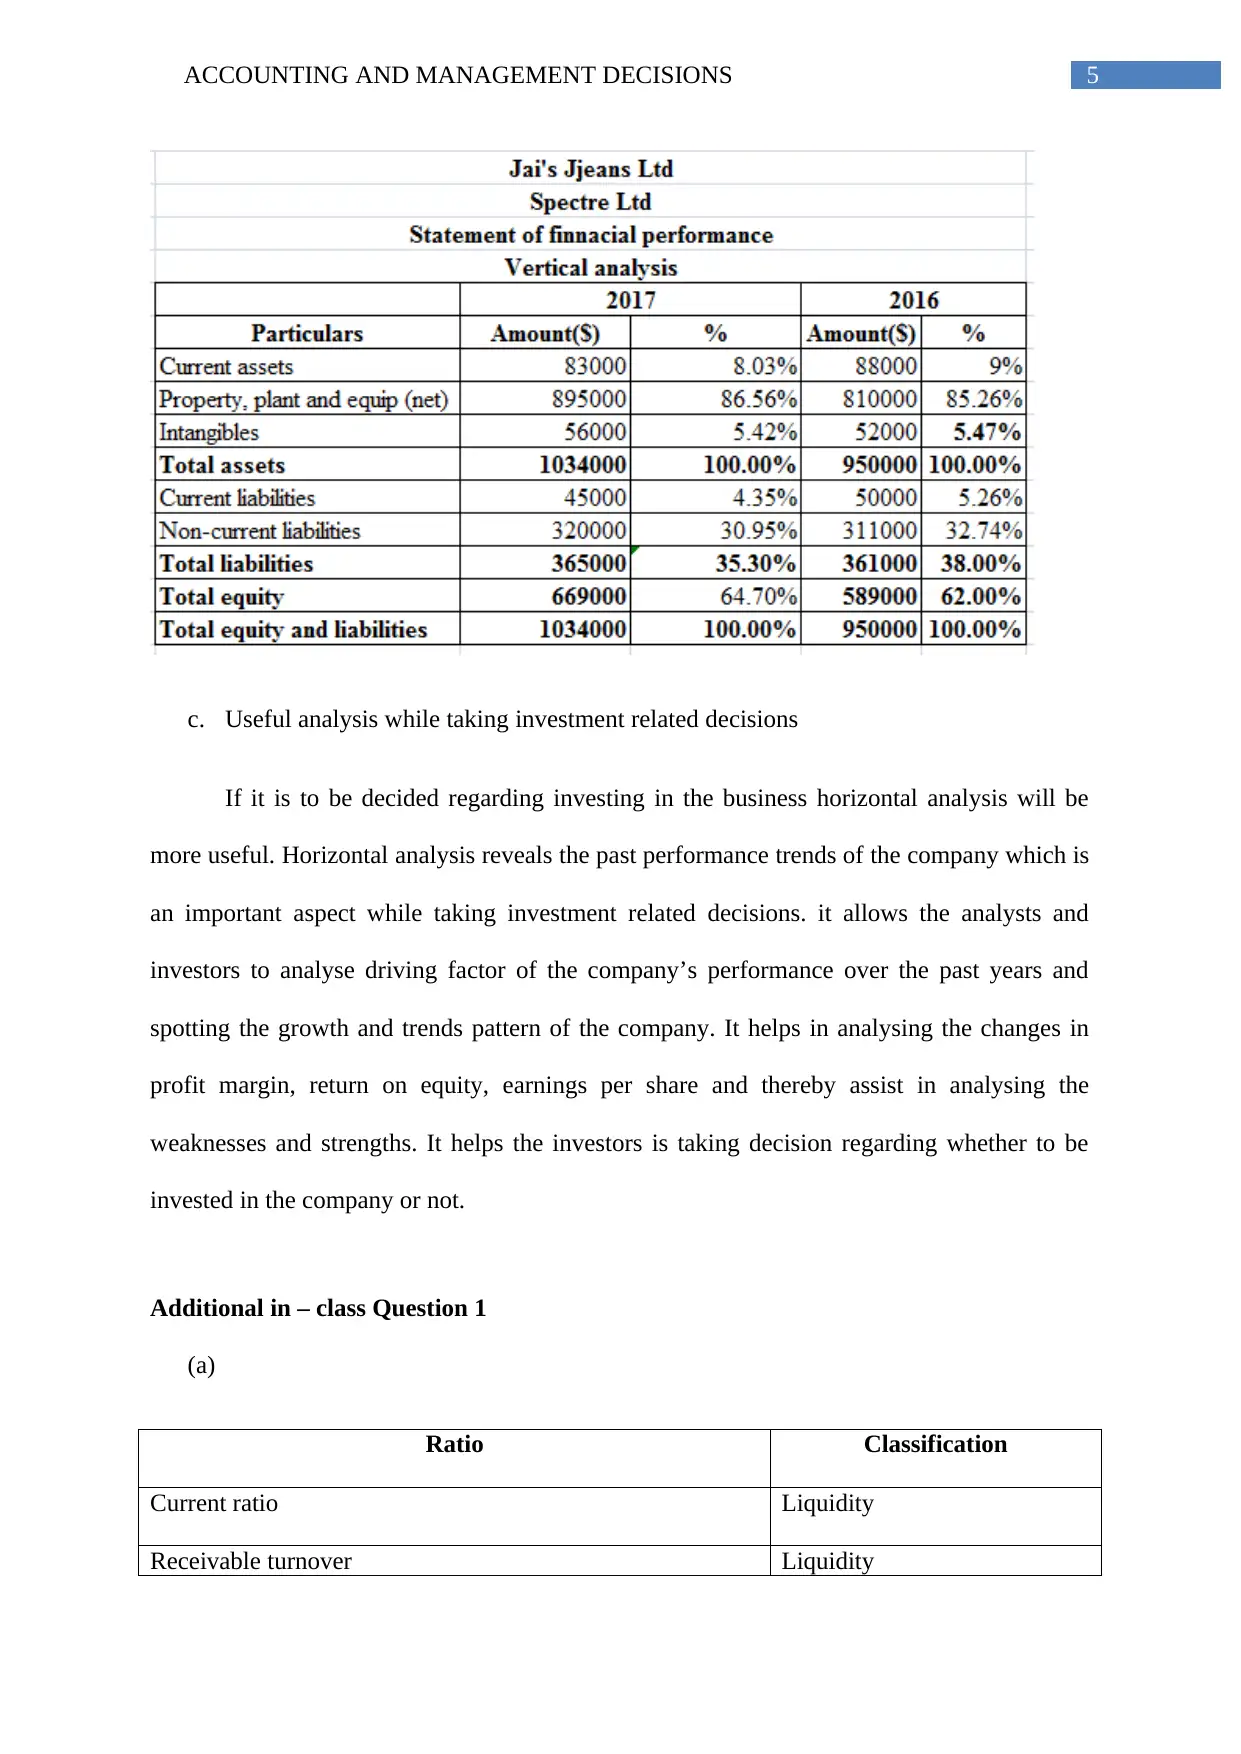
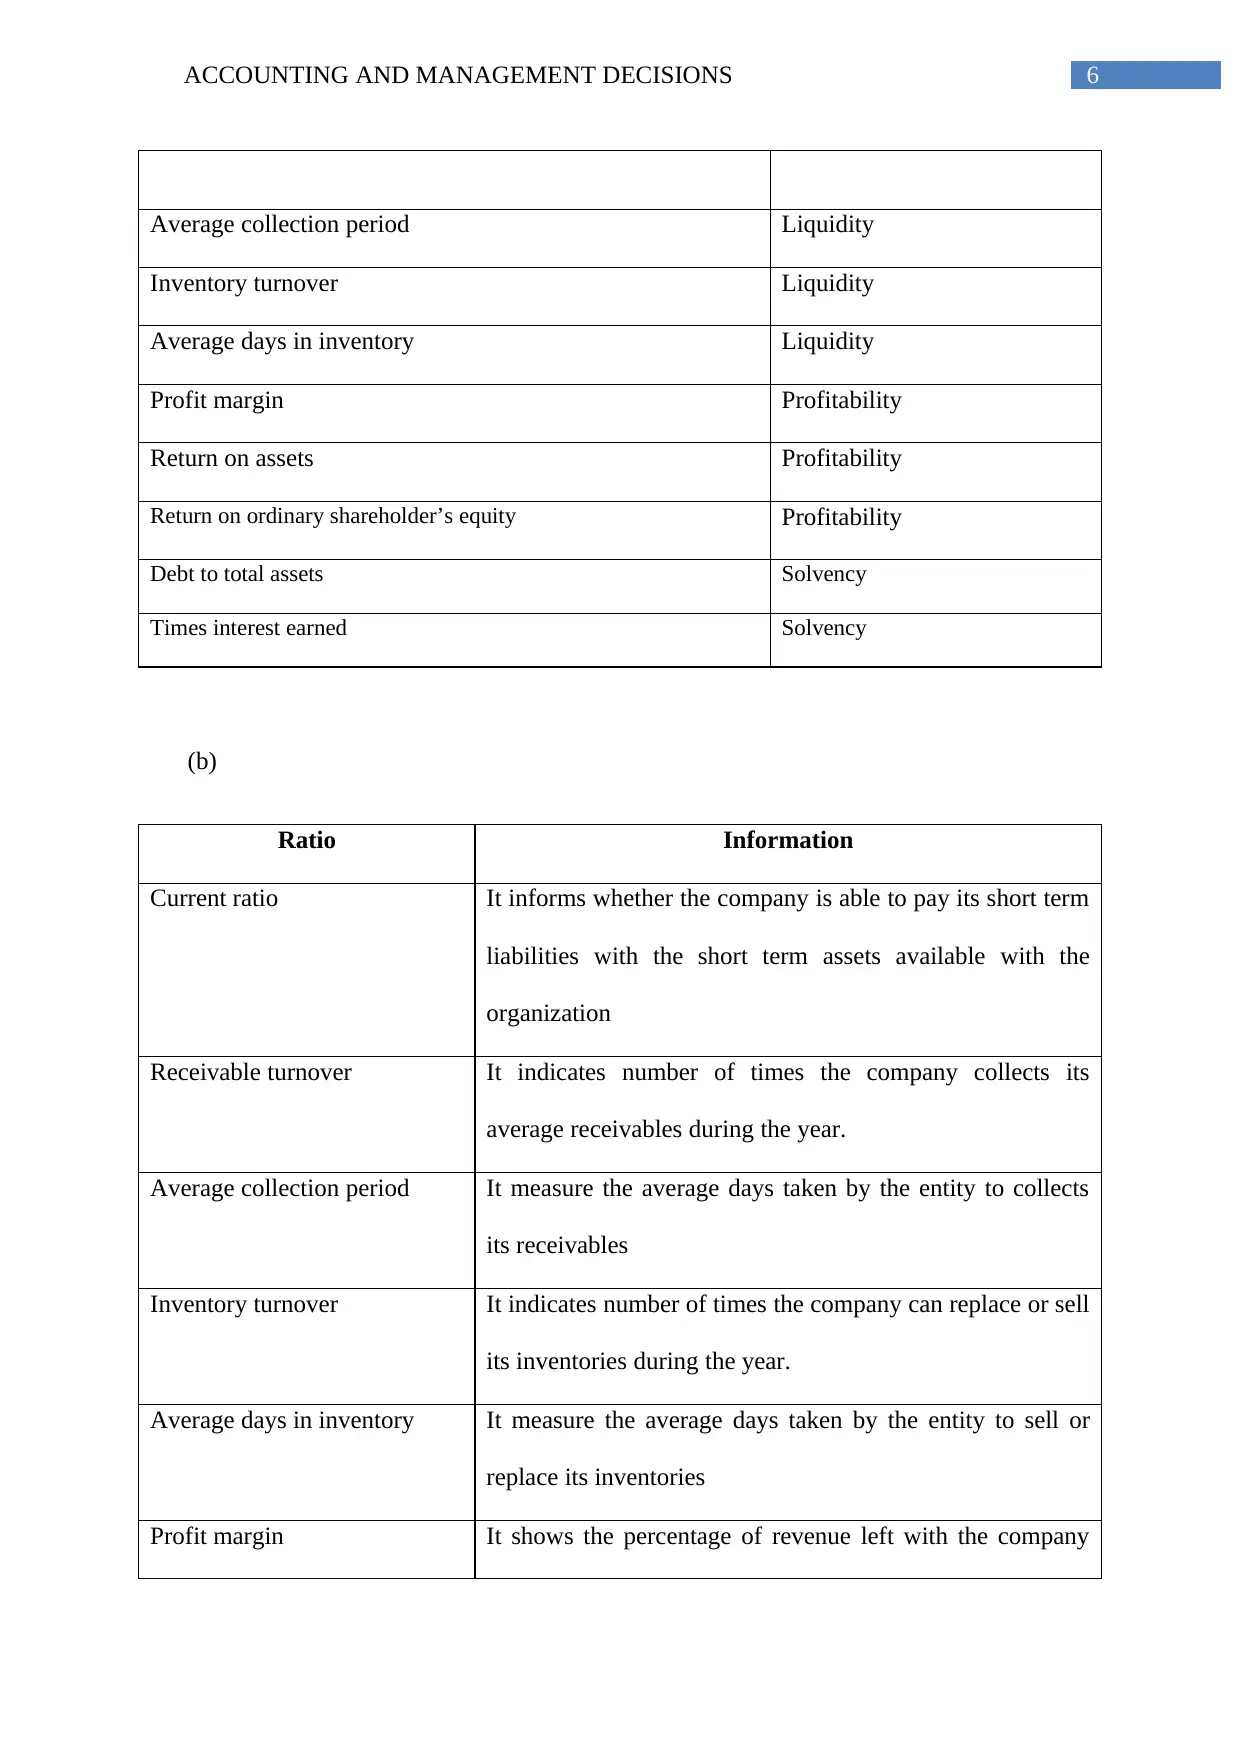
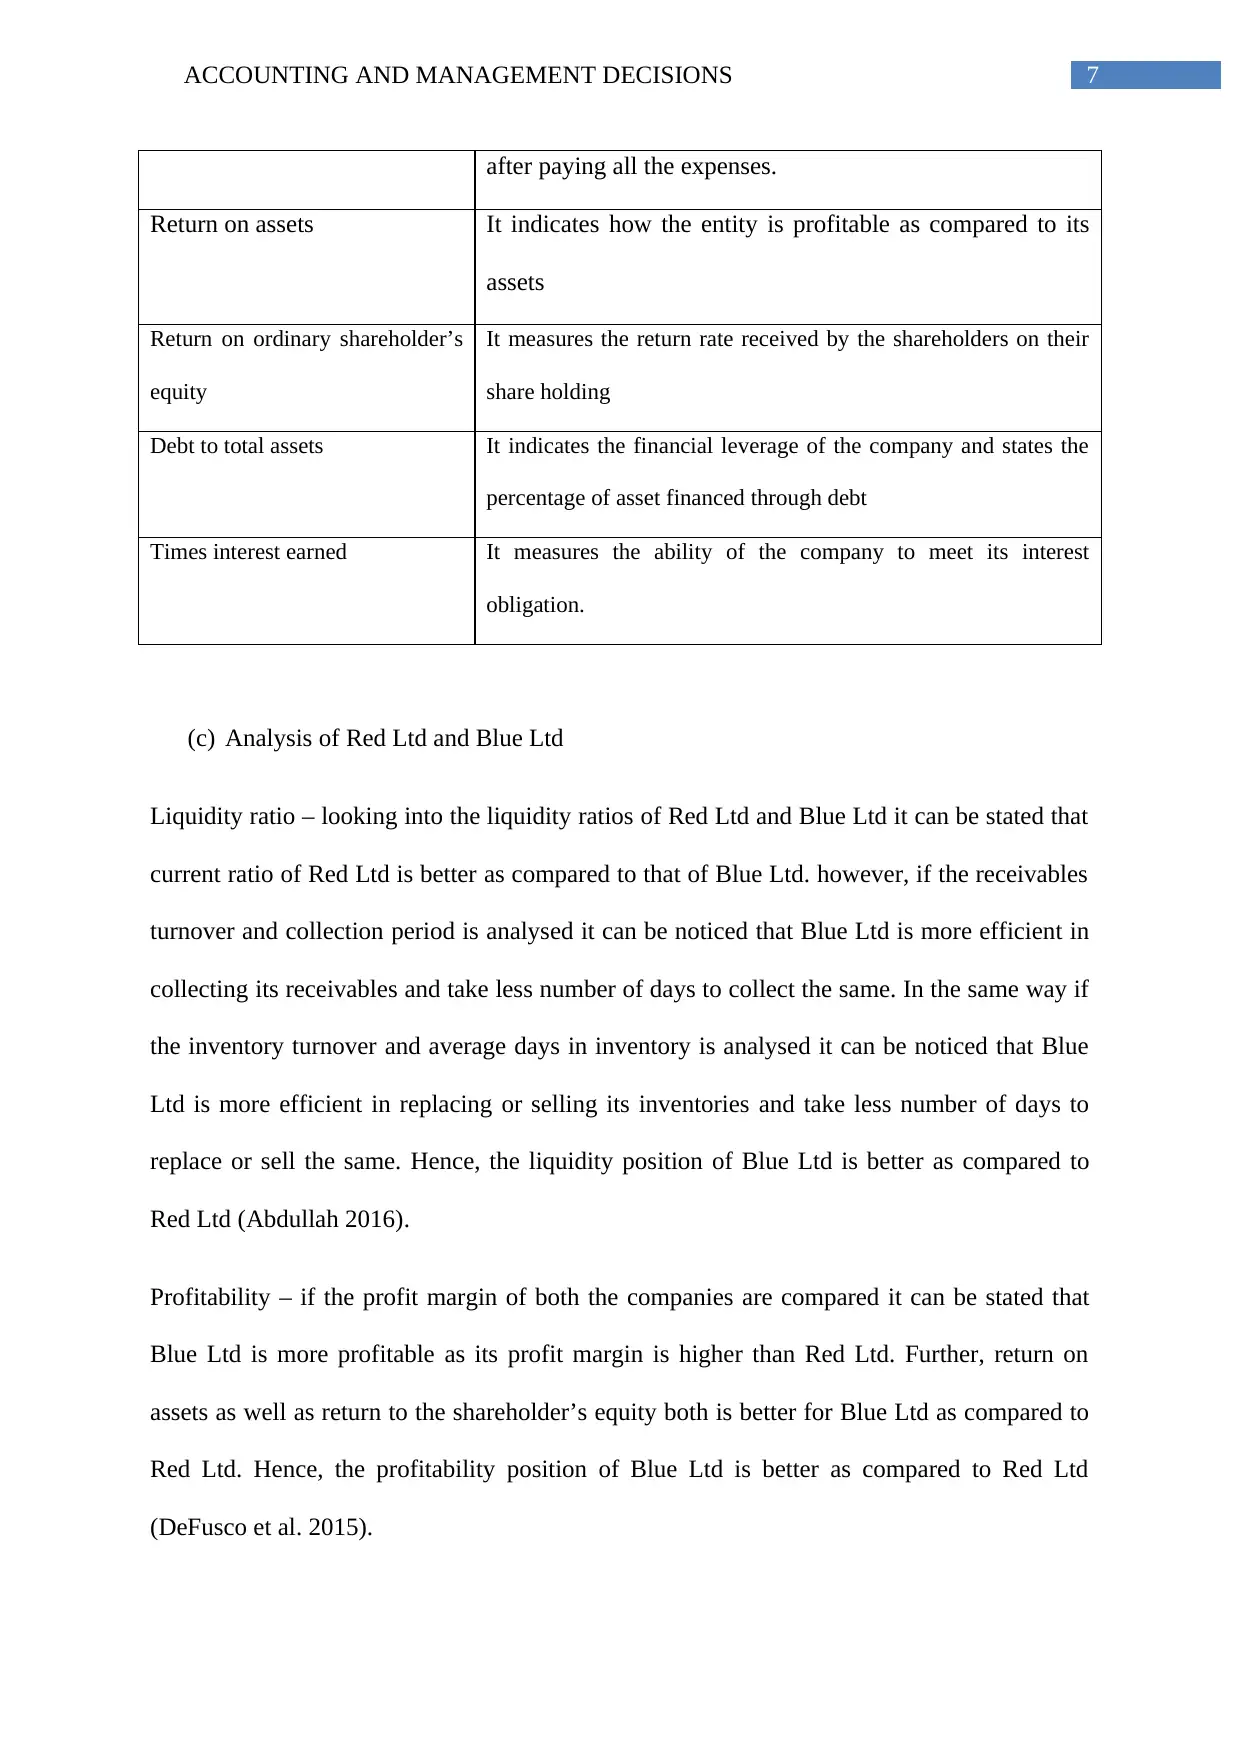
This assignment solution focuses on accounting and management decisions, providing a detailed analysis of financial statements. It includes horizontal and vertical analysis of Forrester’s Ltd's financial position, explaining changes in assets, liabilities, and equity. The solution also covers ratio analysis, classifying and interpreting various ratios like current ratio, receivable turnover, profit margin, and debt to total assets for Red Ltd and Blue Ltd, comparing their liquidity, profitability, and solvency. Furthermore, the assignment explores the usefulness of horizontal analysis in investment-related decisions and discusses the limitations of financial statement analysis, such as reliance on past data, comparability issues, and changes in accounting methods. The document concludes with a recommendation on which company to invest in based on the analysis.
Document Page
Running head: ACCOUNTING AND MANAGEMENT DECISIONS
Accounting and management decisions – Week 10
Name of the student
Name of the student
Student ID
Author note
tabler-icon-diamond-filled.svg

Paraphrase This Document

Need a fresh take? Get an instant paraphrase of this document with our AI Paraphraser
Document Page
1ACCOUNTING AND MANAGEMENT DECISIONS
Table of Contents
E12.3..........................................................................................................................................2
E12.4..........................................................................................................................................3
E12.6..........................................................................................................................................4
Additional in – class Question 1................................................................................................5
Additional in – class Question 2................................................................................................8
Reference....................................................................................................................................9
Document Page
2ACCOUNTING AND MANAGEMENT DECISIONS
E12.3
(a) Horizontal analysis of Forrester’s Ltd’s financial position
(b) Explanation of changes
From the above presented horizontal analysis of Forrester’s Ltd’s financial position as
at 30th June 2017 and 30th June 2016 it can be noticed that the current assets as well as the
non-current asset that is the property, plant and equipment has been increased by 9.09% and
7.94% respectively in 2017 as compared to 2016. If the total assets is considered it is
increased by 8.08% in 2017 as compared to 2016. If the current liabilities and non-current
liabilities are considered it can be noticed that both the current as well as non-current
liabilities of the company has been reduced in 2017 as compared to 2016 by 10% and 7.69%
respectively (Entwistle 2015). Hence, it can be stated that the liquidity position of the
company has been improved. Share capital of the company over the years from 2016 to 2016
has been increased by 23.29% whereas the retained earnings have been reduced by 7.11%.
Document Page
3ACCOUNTING AND MANAGEMENT DECISIONS
Total liabilities and equity of the company has been increased by 8.08% over the years from
2016 to 2017.
E12.4
a. Schedule showing the vertical analysis
b. Importance of vertical and horizontal analysis
When analysing the financial statement of a company vertical as well as horizontal
analysis is important to analyse the trends over times. Under the competitive landscape
growth of the company is preeminent particularly for the industries where significant amount
of upfront investment is required. Through analysing the trends the corporate analysts can
also state whether the company is efficiently managing the money and investing the same
wisely. Under vertical analysis generally one accounting item, for example sales in income
statement are set as the benchmark and other items are compared with numerical standards.
Main advantage of vertical analysis is that the firms of different sizes can be compared. On
the other hand, the horizontal analysis is studying the trends over the years (Karaibrahimoglu
and Tunç 2014). For example, 5 year balance sheet can be reviewed to determine the
tabler-icon-diamond-filled.svg

Paraphrase This Document

Need a fresh take? Get an instant paraphrase of this document with our AI Paraphraser
Document Page
4ACCOUNTING AND MANAGEMENT DECISIONS
movements of assets and liabilities. Further, it presents the facts in simple way to the
shareholders and makes analysis of improvements or lack of performance simple to the
shareholders. Based on this the company further can make future plans for improvements.
E12.6
a. Horizontal analysis
b. Vertical analysis
Document Page
5ACCOUNTING AND MANAGEMENT DECISIONS
c. Useful analysis while taking investment related decisions
If it is to be decided regarding investing in the business horizontal analysis will be
more useful. Horizontal analysis reveals the past performance trends of the company which is
an important aspect while taking investment related decisions. it allows the analysts and
investors to analyse driving factor of the company’s performance over the past years and
spotting the growth and trends pattern of the company. It helps in analysing the changes in
profit margin, return on equity, earnings per share and thereby assist in analysing the
weaknesses and strengths. It helps the investors is taking decision regarding whether to be
invested in the company or not.
Additional in – class Question 1
(a)
Ratio Classification
Current ratio Liquidity
Receivable turnover Liquidity
Document Page
6ACCOUNTING AND MANAGEMENT DECISIONS
Average collection period Liquidity
Inventory turnover Liquidity
Average days in inventory Liquidity
Profit margin Profitability
Return on assets Profitability
Return on ordinary shareholder’s equity Profitability
Debt to total assets Solvency
Times interest earned Solvency
(b)
Ratio Information
Current ratio It informs whether the company is able to pay its short term
liabilities with the short term assets available with the
organization
Receivable turnover It indicates number of times the company collects its
average receivables during the year.
Average collection period It measure the average days taken by the entity to collects
its receivables
Inventory turnover It indicates number of times the company can replace or sell
its inventories during the year.
Average days in inventory It measure the average days taken by the entity to sell or
replace its inventories
Profit margin It shows the percentage of revenue left with the company
tabler-icon-diamond-filled.svg

Paraphrase This Document

Need a fresh take? Get an instant paraphrase of this document with our AI Paraphraser
Document Page
7ACCOUNTING AND MANAGEMENT DECISIONS
after paying all the expenses.
Return on assets It indicates how the entity is profitable as compared to its
assets
Return on ordinary shareholder’s
equity
It measures the return rate received by the shareholders on their
share holding
Debt to total assets It indicates the financial leverage of the company and states the
percentage of asset financed through debt
Times interest earned It measures the ability of the company to meet its interest
obligation.
(c) Analysis of Red Ltd and Blue Ltd
Liquidity ratio – looking into the liquidity ratios of Red Ltd and Blue Ltd it can be stated that
current ratio of Red Ltd is better as compared to that of Blue Ltd. however, if the receivables
turnover and collection period is analysed it can be noticed that Blue Ltd is more efficient in
collecting its receivables and take less number of days to collect the same. In the same way if
the inventory turnover and average days in inventory is analysed it can be noticed that Blue
Ltd is more efficient in replacing or selling its inventories and take less number of days to
replace or sell the same. Hence, the liquidity position of Blue Ltd is better as compared to
Red Ltd (Abdullah 2016).
Profitability – if the profit margin of both the companies are compared it can be stated that
Blue Ltd is more profitable as its profit margin is higher than Red Ltd. Further, return on
assets as well as return to the shareholder’s equity both is better for Blue Ltd as compared to
Red Ltd. Hence, the profitability position of Blue Ltd is better as compared to Red Ltd
(DeFusco et al. 2015).
Document Page
8ACCOUNTING AND MANAGEMENT DECISIONS
Solvency – looking into the debt to total asset for both the companies it can be stated that Red
Ltd is more leveraged as compared to Blue Ltd as Red Ltd financed more of its assets
through debt. Further, the times interest earned ratio is indicating that Blue Ltd is more
efficient in meeting its interest obligation. Hence, the solvency position of Blue Ltd is better
as compared to Red Ltd (Jonas 2017)
(d) Overall recommendation
On the basis of information provided and above analysis if one company among Red
Ltd and Blue Ltd is to be chosen for the purpose of investment, Blue Ltd shall be chosen as it
is better in profitability, liquidity and solvency aspect as compared to that of Red Ltd.
Additional in – class Question 2
Limitations of financial analysis
Analysis of financial statement involves some limitations and hence shall be kept in mind
while making decisions. These limitations are as follows –
Based on the past data – only the past data are included in financial statement are
analysed. Hence, it cannot be used for providing basis for the future estimation,
budgeting, forecasting and planning (Wahlen, Baginski and Bradshaw 2014).
Issues in comparability – business sizes vary as per the transaction volume. Therefore,
figures from different year’s financial statement lose characteristics of comparability.
Changes in the accounting methods – uniform accounting methods and policies shall
be there for number of the years. If frequent changes are there figures from different
periods will be incomparable and different. In such circumstance, analysis will lose its
meaning and value.
Document Page
9ACCOUNTING AND MANAGEMENT DECISIONS
Changes in value of the money – purchasing power of the money reduced from year
to year owing to inflation. It raises issues while comparing the financial statements
from different years (Robinson et al. 2015).
Managerial ability is not assessed – results of analysis shall not be considered as the
indication for bad or good management. Therefore, ability of the managers cannot be
evaluated through analysis.
tabler-icon-diamond-filled.svg

Paraphrase This Document

Need a fresh take? Get an instant paraphrase of this document with our AI Paraphraser
Document Page
10ACCOUNTING AND MANAGEMENT DECISIONS
Reference
Abdullah, A.A., 2016. Financial Statement Analysis for Kier Group PLC. Global Journal of
Management And Business Research.
DeFusco, R.A., McLeavey, D.W., Pinto, J.E., Anson, M.J. and Runkle, D.E.,
2015. Quantitative investment analysis. John Wiley & Sons.
Entwistle, G., 2015. Reflections on teaching financial statement analysis. Accounting
Education, 24(6), pp.555-558.
Jonas, G.A., 2017. Asian Financial Statement Analysis: Detecting Financial Irregularities.
Thomas R. Robinson and ChinHwee Tan. John Wiley & Sons, Inc. Hoboken, New Jersey.
Copyright© 2014 by CFA Institute. 192 pages; Hardcover $36.34 (Amazon). ISBN 978-1-
118-48652-8.
Karaibrahimoglu, Y.Z. and Tunç, G., 2014. Financial Statement Analysis under IFRS.
In Handbook of Research on Strategic Business Infrastructure Development and
Contemporary Issues in Finance (pp. 238-255). IGI Global.
Robinson, T.R., Henry, E., Pirie, W.L., Broihahn, M.A. and Cope, A.T., 2015. International
Financial Statement Analysis, (CFA Institute Investment Series). John Wiley & Sons.
Wahlen, J., Baginski, S. and Bradshaw, M., 2014. Financial reporting, financial statement
analysis and valuation. Nelson Education.
chevron_up_icon
1 out of 11
circle_padding
hide_on_mobile
zoom_out_icon
[object Object]