ACC306 Report: Investment Analysis of Qantas Airways Financials
VerifiedAdded on 2023/06/07
|20
|4490
|470
Report
AI Summary
This report provides a comprehensive financial analysis of Qantas Airways, focusing on its long-term solvency and liquidity over the past three years. It assesses various financial ratios, including solvency ratios (debt to equity, total debt to total assets, interest coverage ratio, and return on financial leverage) and liquidity ratios (current ratio, quick ratio, working capital, operating cash flow with current liabilities and capital expenditures, and free cash flow). The analysis indicates that while Qantas Airways has performed satisfactorily, there are areas of concern, such as decreasing return on equity and increasing debt to equity ratio in 2017. The report also discusses the qualitative aspects of the company's financial statements, providing insights into its overall financial health. Desklib provides similar past papers and solved assignments for students.
Running Head: FINANCE 0
Finance
Finance
Paraphrase This Document
Need a fresh take? Get an instant paraphrase of this document with our AI Paraphraser
FINANCE 1
Table of Contents
Introduction................................................................................................................................2
Financial Performance Analysis................................................................................................4
Solvency and Liquidity...........................................................................................................5
Solvency ratios.......................................................................................................................5
Debt to equity......................................................................................................................6
Total debt to Total assets....................................................................................................7
Interest coverage Ratio.......................................................................................................8
Return on Financial leverage..............................................................................................9
Liquidity ratios.....................................................................................................................10
Current Ratio.....................................................................................................................11
Quick Ratio.......................................................................................................................11
Working capital.................................................................................................................13
Operating cash flow with the current liabilities................................................................14
Operating cash flow with the capital expenditures...........................................................14
Free cash flow...................................................................................................................14
Quality of the financial statements...........................................................................................15
References................................................................................................................................17
FINANCE 2
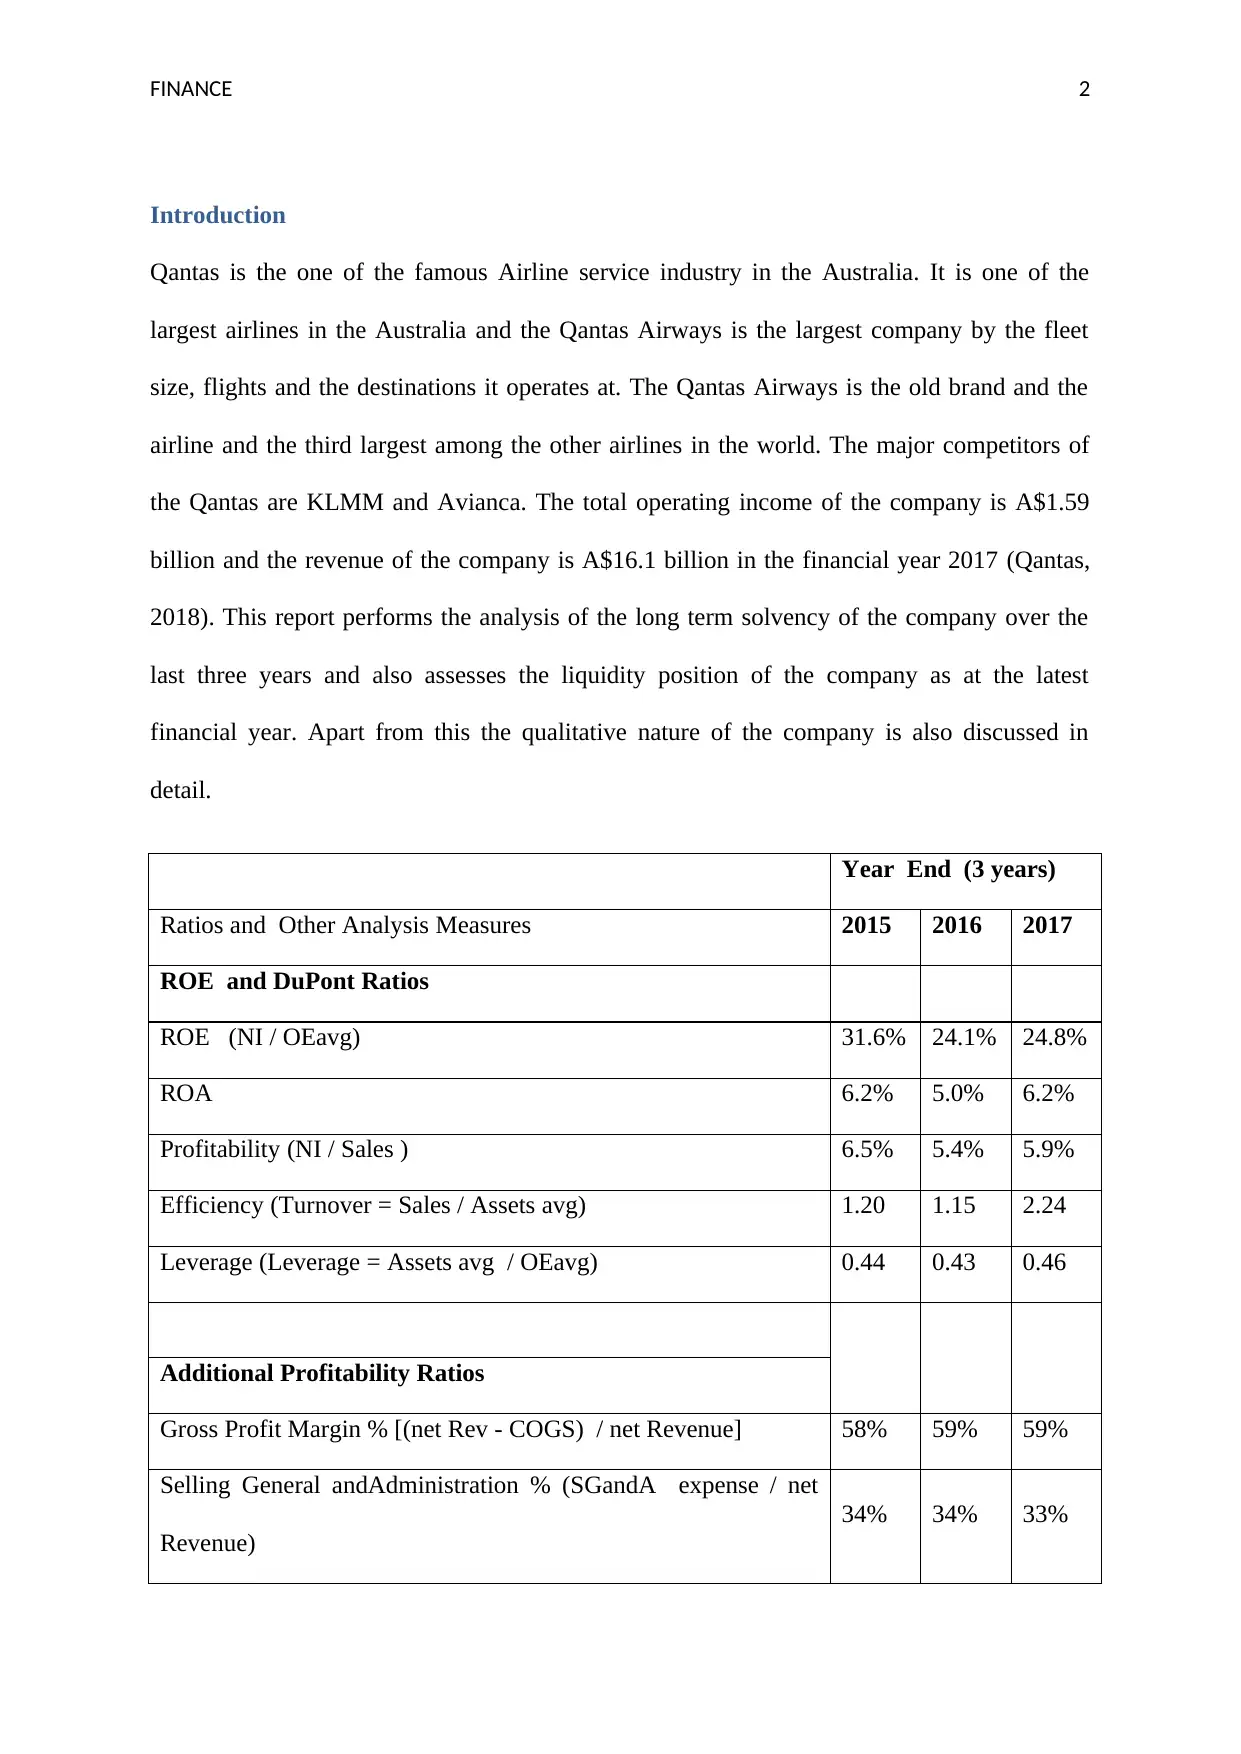
Introduction
Qantas is the one of the famous Airline service industry in the Australia. It is one of the
largest airlines in the Australia and the Qantas Airways is the largest company by the fleet
size, flights and the destinations it operates at. The Qantas Airways is the old brand and the
airline and the third largest among the other airlines in the world. The major competitors of
the Qantas are KLMM and Avianca. The total operating income of the company is A$1.59
billion and the revenue of the company is A$16.1 billion in the financial year 2017 (Qantas,
2018). This report performs the analysis of the long term solvency of the company over the
last three years and also assesses the liquidity position of the company as at the latest
financial year. Apart from this the qualitative nature of the company is also discussed in
detail.
Year End (3 years)
Ratios and Other Analysis Measures 2015 2016 2017
ROE and DuPont Ratios
ROE (NI / OEavg) 31.6% 24.1% 24.8%
ROA 6.2% 5.0% 6.2%
Profitability (NI / Sales ) 6.5% 5.4% 5.9%
Efficiency (Turnover = Sales / Assets avg) 1.20 1.15 2.24
Leverage (Leverage = Assets avg / OEavg) 0.44 0.43 0.46
Additional Profitability Ratios
Gross Profit Margin % [(net Rev - COGS) / net Revenue] 58% 59% 59%
Selling General andAdministration % (SGandA expense / net
Revenue)
34% 34% 33%
⊘ This is a preview!⊘
Do you want full access?
Subscribe today to unlock all pages.
Trusted by 1+ million students worldwide
FINANCE 3
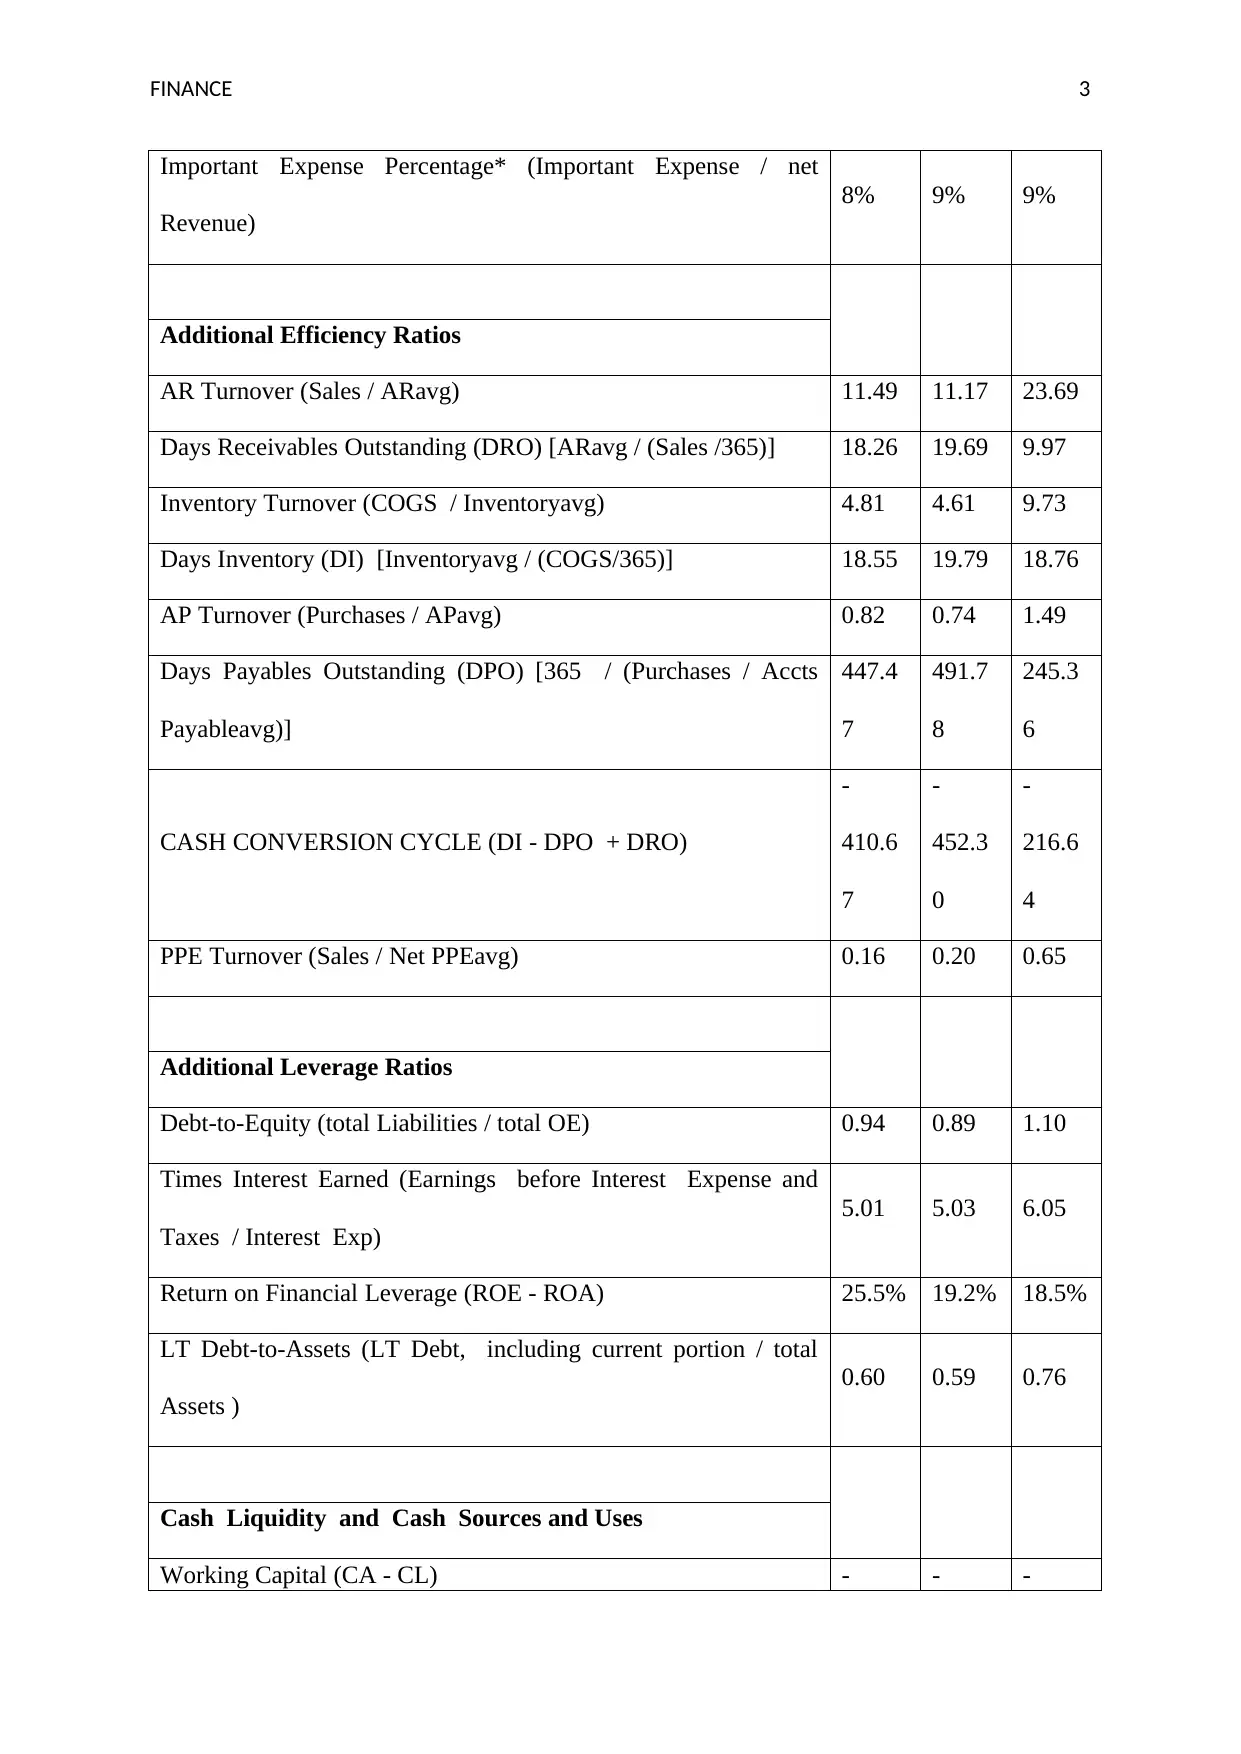
Important Expense Percentage* (Important Expense / net
Revenue)
8% 9% 9%
Additional Efficiency Ratios
AR Turnover (Sales / ARavg) 11.49 11.17 23.69
Days Receivables Outstanding (DRO) [ARavg / (Sales /365)] 18.26 19.69 9.97
Inventory Turnover (COGS / Inventoryavg) 4.81 4.61 9.73
Days Inventory (DI) [Inventoryavg / (COGS/365)] 18.55 19.79 18.76
AP Turnover (Purchases / APavg) 0.82 0.74 1.49
Days Payables Outstanding (DPO) [365 / (Purchases / Accts
Payableavg)]
447.4
7
491.7
8
245.3
6
CASH CONVERSION CYCLE (DI - DPO + DRO)
-
410.6
7
-
452.3
0
-
216.6
4
PPE Turnover (Sales / Net PPEavg) 0.16 0.20 0.65
Additional Leverage Ratios
Debt-to-Equity (total Liabilities / total OE) 0.94 0.89 1.10
Times Interest Earned (Earnings before Interest Expense and
Taxes / Interest Exp)
5.01 5.03 6.05
Return on Financial Leverage (ROE - ROA) 25.5% 19.2% 18.5%
LT Debt-to-Assets (LT Debt, including current portion / total
Assets )
0.60 0.59 0.76
Cash Liquidity and Cash Sources and Uses
Working Capital (CA - CL) - - -
Paraphrase This Document
Need a fresh take? Get an instant paraphrase of this document with our AI Paraphraser
FINANCE 4
35700
00
39760
00
38840
00
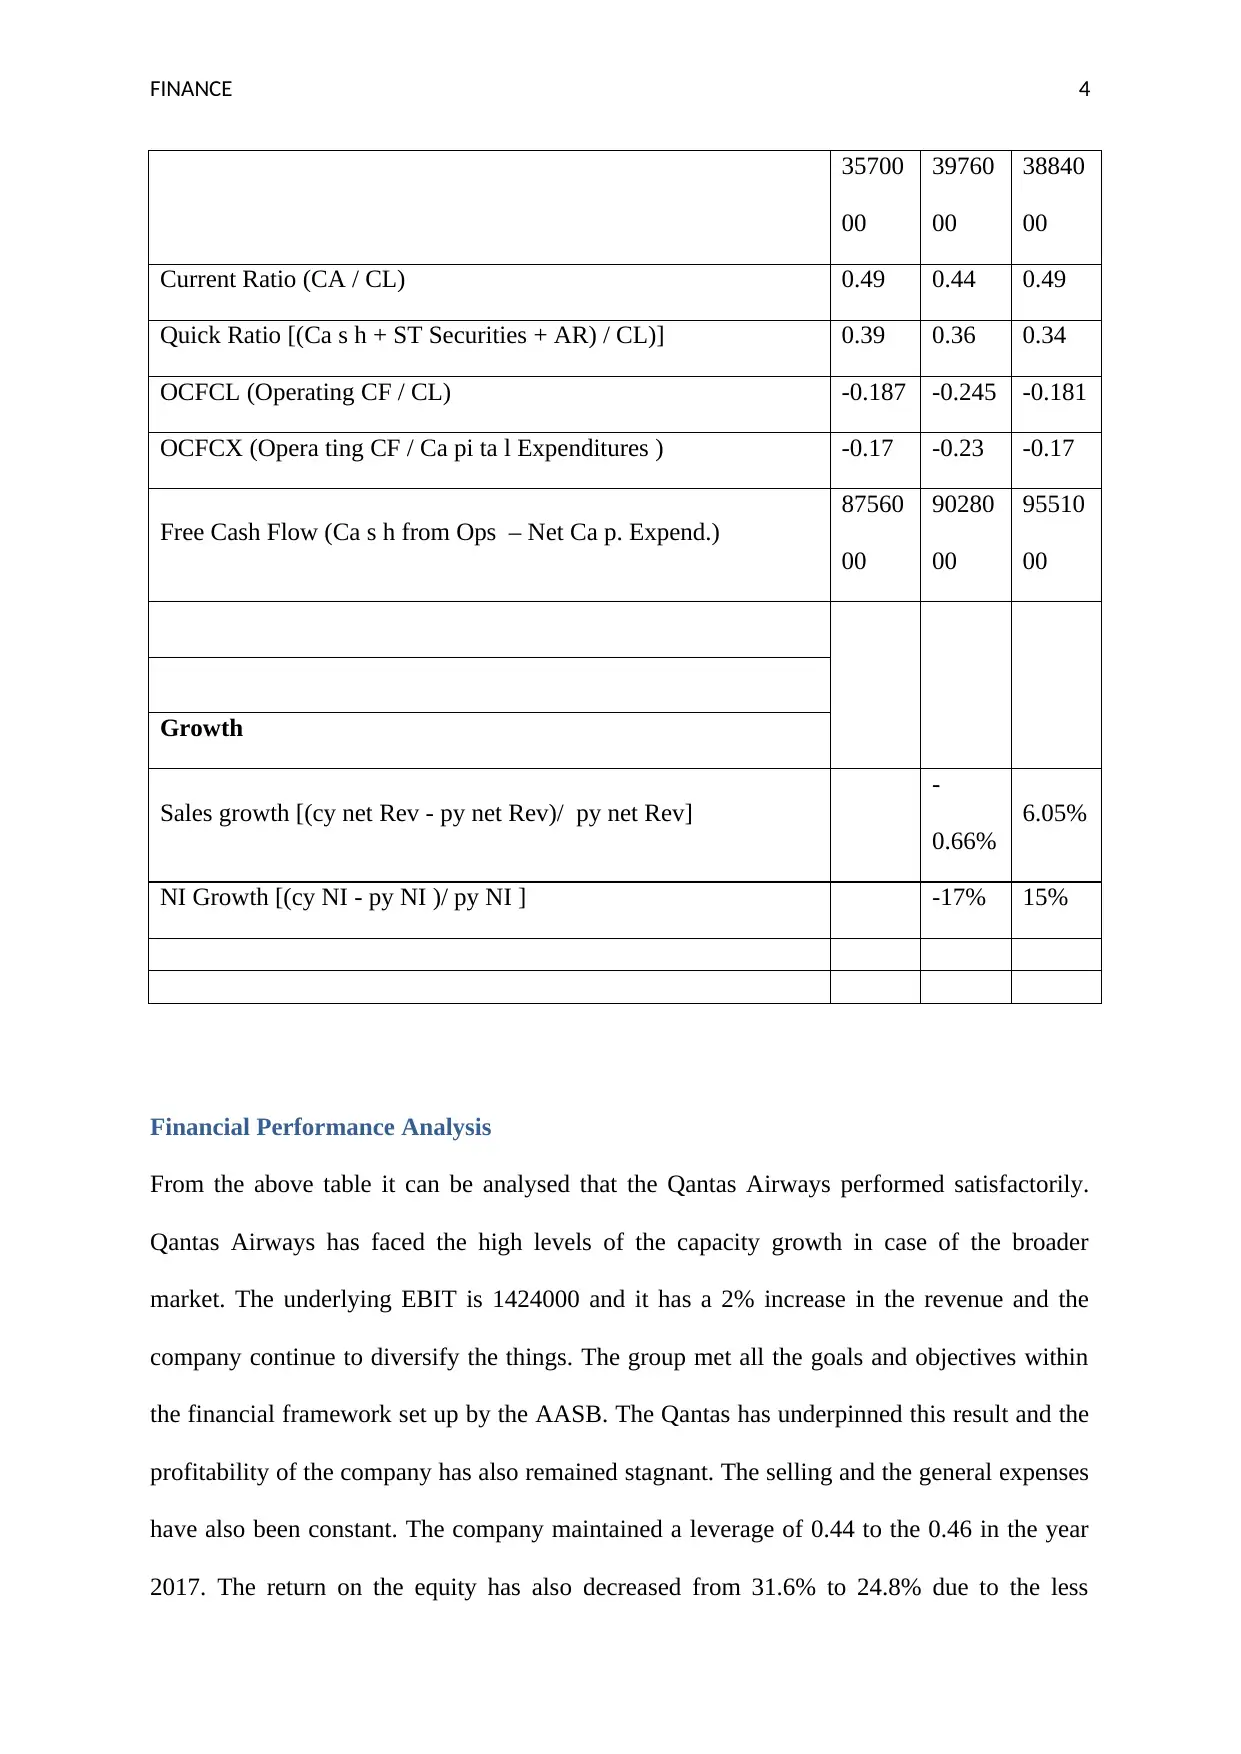
Current Ratio (CA / CL) 0.49 0.44 0.49
Quick Ratio [(Ca s h + ST Securities + AR) / CL)] 0.39 0.36 0.34
OCFCL (Operating CF / CL) -0.187 -0.245 -0.181
OCFCX (Opera ting CF / Ca pi ta l Expenditures ) -0.17 -0.23 -0.17
Free Cash Flow (Ca s h from Ops – Net Ca p. Expend.)
87560
00
90280
00
95510
00
Growth
Sales growth [(cy net Rev - py net Rev)/ py net Rev]
-
0.66%
6.05%
NI Growth [(cy NI - py NI )/ py NI ] -17% 15%
Financial Performance Analysis
From the above table it can be analysed that the Qantas Airways performed satisfactorily.
Qantas Airways has faced the high levels of the capacity growth in case of the broader
market. The underlying EBIT is 1424000 and it has a 2% increase in the revenue and the
company continue to diversify the things. The group met all the goals and objectives within
the financial framework set up by the AASB. The Qantas has underpinned this result and the
profitability of the company has also remained stagnant. The selling and the general expenses
have also been constant. The company maintained a leverage of 0.44 to the 0.46 in the year
2017. The return on the equity has also decreased from 31.6% to 24.8% due to the less
35700
00
39760
00
38840
00
Current Ratio (CA / CL) 0.49 0.44 0.49
Quick Ratio [(Ca s h + ST Securities + AR) / CL)] 0.39 0.36 0.34
OCFCL (Operating CF / CL) -0.187 -0.245 -0.181
OCFCX (Opera ting CF / Ca pi ta l Expenditures ) -0.17 -0.23 -0.17
Free Cash Flow (Ca s h from Ops – Net Ca p. Expend.)
87560
00
90280
00
95510
00
Growth
Sales growth [(cy net Rev - py net Rev)/ py net Rev]
-
0.66%
6.05%
NI Growth [(cy NI - py NI )/ py NI ] -17% 15%
Financial Performance Analysis
From the above table it can be analysed that the Qantas Airways performed satisfactorily.
Qantas Airways has faced the high levels of the capacity growth in case of the broader
market. The underlying EBIT is 1424000 and it has a 2% increase in the revenue and the
company continue to diversify the things. The group met all the goals and objectives within
the financial framework set up by the AASB. The Qantas has underpinned this result and the
profitability of the company has also remained stagnant. The selling and the general expenses
have also been constant. The company maintained a leverage of 0.44 to the 0.46 in the year
2017. The return on the equity has also decreased from 31.6% to 24.8% due to the less
FINANCE 5
number of the equity investors (News Corp Australia Network, 2017). The cash decreased by
286000 in the year 2017 in a period of last three years and therefore after the analysis of the
financial statements of the last three years.
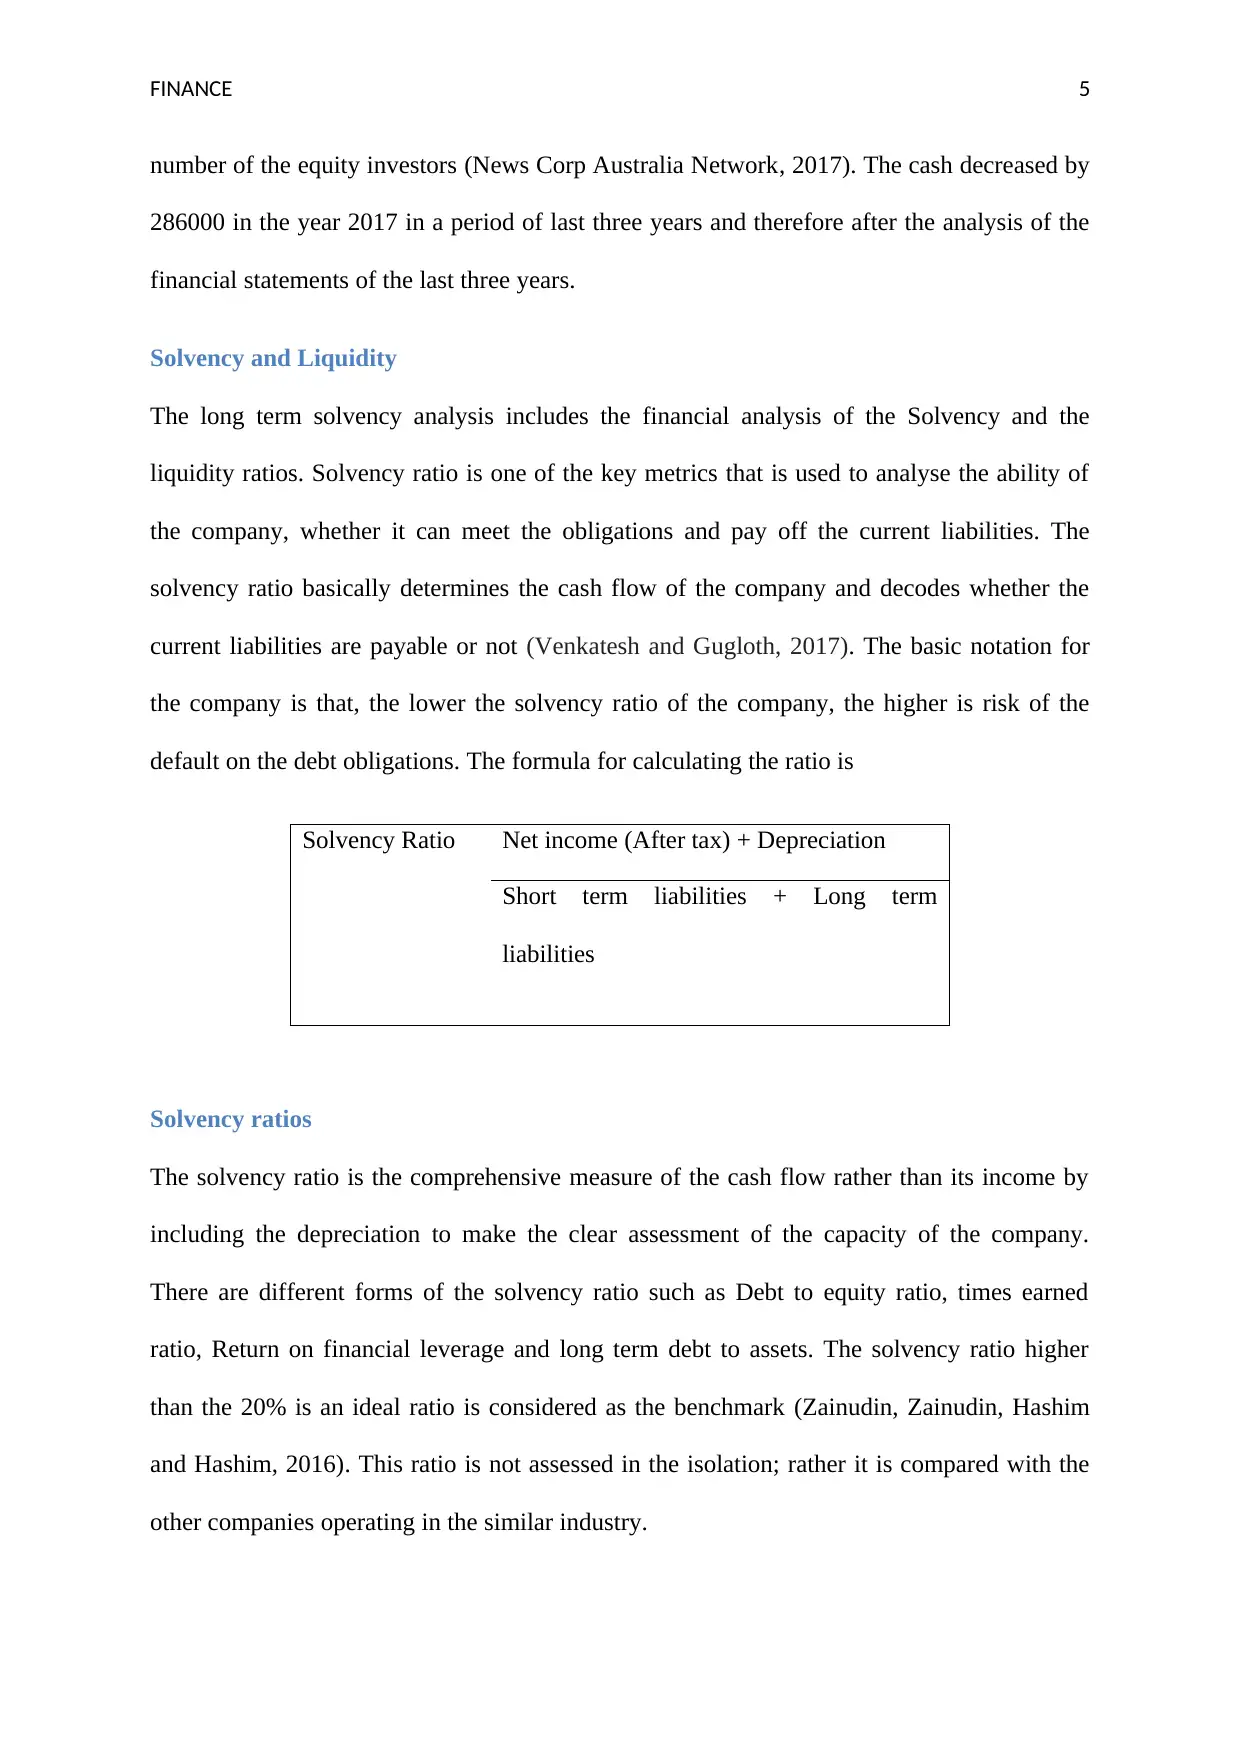
Solvency and Liquidity
The long term solvency analysis includes the financial analysis of the Solvency and the
liquidity ratios. Solvency ratio is one of the key metrics that is used to analyse the ability of
the company, whether it can meet the obligations and pay off the current liabilities. The
solvency ratio basically determines the cash flow of the company and decodes whether the
current liabilities are payable or not (Venkatesh and Gugloth, 2017). The basic notation for
the company is that, the lower the solvency ratio of the company, the higher is risk of the
default on the debt obligations. The formula for calculating the ratio is
Solvency Ratio Net income (After tax) + Depreciation
Short term liabilities + Long term
liabilities
Solvency ratios
The solvency ratio is the comprehensive measure of the cash flow rather than its income by
including the depreciation to make the clear assessment of the capacity of the company.
There are different forms of the solvency ratio such as Debt to equity ratio, times earned
ratio, Return on financial leverage and long term debt to assets. The solvency ratio higher
than the 20% is an ideal ratio is considered as the benchmark (Zainudin, Zainudin, Hashim
and Hashim, 2016). This ratio is not assessed in the isolation; rather it is compared with the
other companies operating in the similar industry.
number of the equity investors (News Corp Australia Network, 2017). The cash decreased by
286000 in the year 2017 in a period of last three years and therefore after the analysis of the
financial statements of the last three years.
Solvency and Liquidity
The long term solvency analysis includes the financial analysis of the Solvency and the
liquidity ratios. Solvency ratio is one of the key metrics that is used to analyse the ability of
the company, whether it can meet the obligations and pay off the current liabilities. The
solvency ratio basically determines the cash flow of the company and decodes whether the
current liabilities are payable or not (Venkatesh and Gugloth, 2017). The basic notation for
the company is that, the lower the solvency ratio of the company, the higher is risk of the
default on the debt obligations. The formula for calculating the ratio is
Solvency Ratio Net income (After tax) + Depreciation
Short term liabilities + Long term
liabilities
Solvency ratios
The solvency ratio is the comprehensive measure of the cash flow rather than its income by
including the depreciation to make the clear assessment of the capacity of the company.
There are different forms of the solvency ratio such as Debt to equity ratio, times earned
ratio, Return on financial leverage and long term debt to assets. The solvency ratio higher
than the 20% is an ideal ratio is considered as the benchmark (Zainudin, Zainudin, Hashim
and Hashim, 2016). This ratio is not assessed in the isolation; rather it is compared with the
other companies operating in the similar industry.
⊘ This is a preview!⊘
Do you want full access?
Subscribe today to unlock all pages.
Trusted by 1+ million students worldwide
FINANCE 6
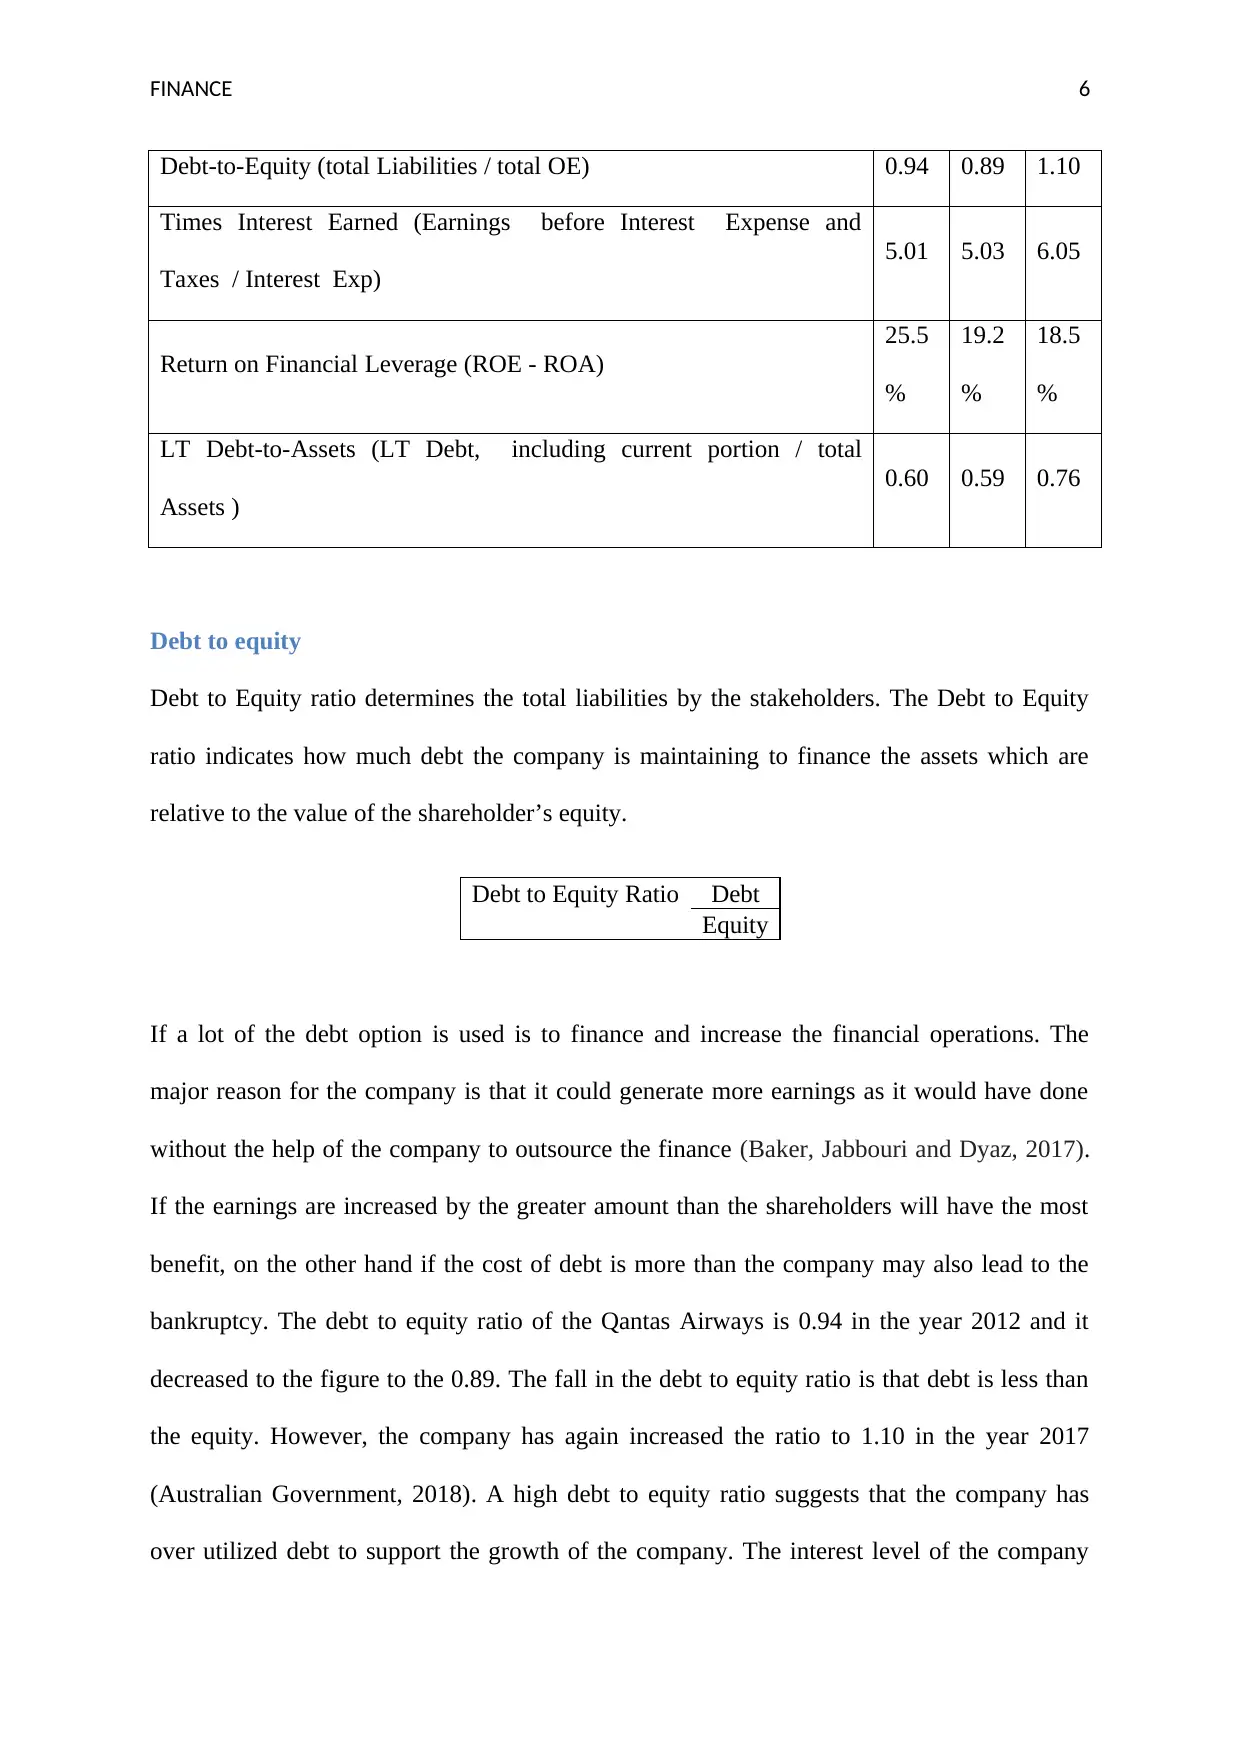
Debt-to-Equity (total Liabilities / total OE) 0.94 0.89 1.10
Times Interest Earned (Earnings before Interest Expense and
Taxes / Interest Exp)
5.01 5.03 6.05
Return on Financial Leverage (ROE - ROA)
25.5
%
19.2
%
18.5
%
LT Debt-to-Assets (LT Debt, including current portion / total
Assets )
0.60 0.59 0.76
Debt to equity
Debt to Equity ratio determines the total liabilities by the stakeholders. The Debt to Equity
ratio indicates how much debt the company is maintaining to finance the assets which are
relative to the value of the shareholder’s equity.
Debt to Equity Ratio Debt
Equity
If a lot of the debt option is used is to finance and increase the financial operations. The
major reason for the company is that it could generate more earnings as it would have done
without the help of the company to outsource the finance (Baker, Jabbouri and Dyaz, 2017).
If the earnings are increased by the greater amount than the shareholders will have the most
benefit, on the other hand if the cost of debt is more than the company may also lead to the
bankruptcy. The debt to equity ratio of the Qantas Airways is 0.94 in the year 2012 and it
decreased to the figure to the 0.89. The fall in the debt to equity ratio is that debt is less than
the equity. However, the company has again increased the ratio to 1.10 in the year 2017
(Australian Government, 2018). A high debt to equity ratio suggests that the company has
over utilized debt to support the growth of the company. The interest level of the company
Paraphrase This Document
Need a fresh take? Get an instant paraphrase of this document with our AI Paraphraser
FINANCE 7
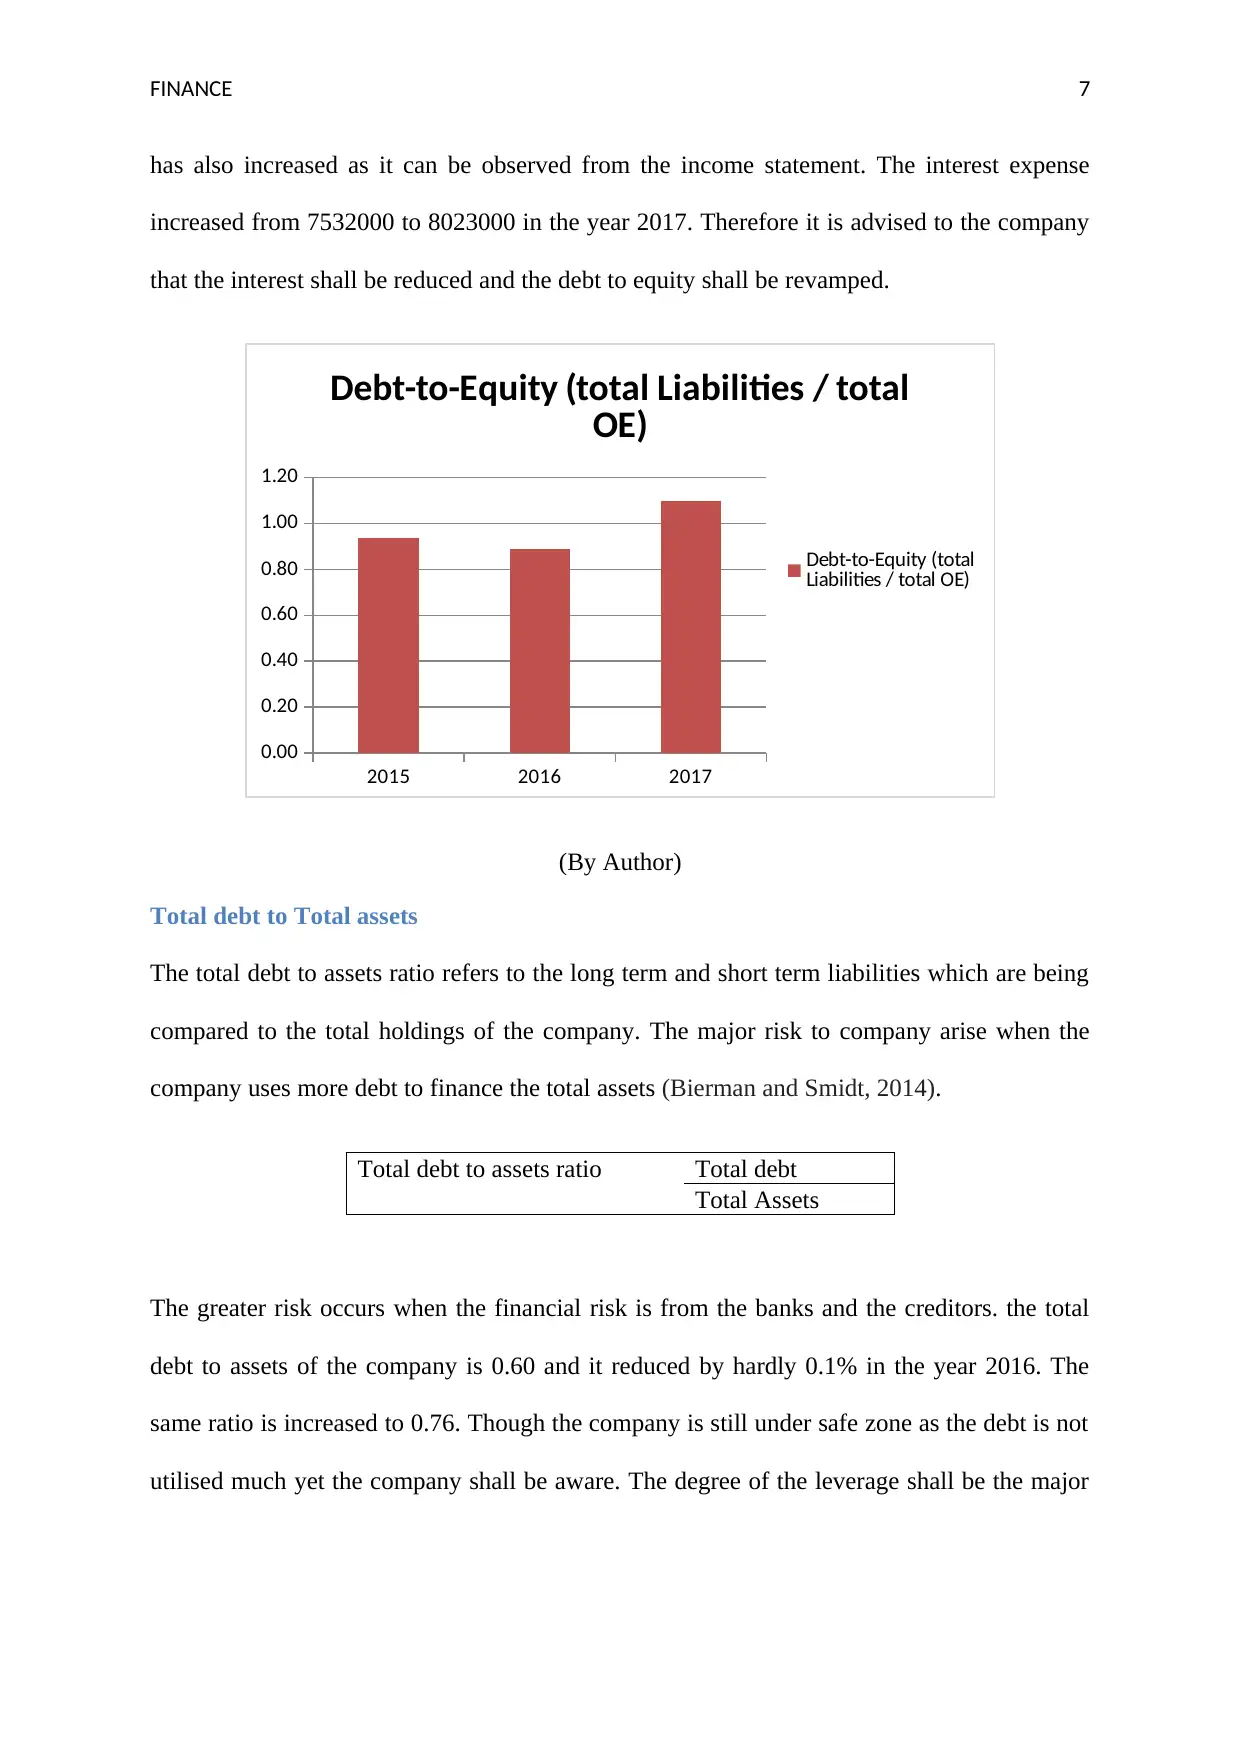
has also increased as it can be observed from the income statement. The interest expense
increased from 7532000 to 8023000 in the year 2017. Therefore it is advised to the company
that the interest shall be reduced and the debt to equity shall be revamped.
2015 2016 2017
0.00
0.20
0.40
0.60
0.80
1.00
1.20
Debt-to-Equity (total Liabilities / total
OE)
Debt-to-Equity (total
Liabilities / total OE)
(By Author)
Total debt to Total assets
The total debt to assets ratio refers to the long term and short term liabilities which are being
compared to the total holdings of the company. The major risk to company arise when the
company uses more debt to finance the total assets (Bierman and Smidt, 2014).
Total debt to assets ratio Total debt
Total Assets
The greater risk occurs when the financial risk is from the banks and the creditors. the total
debt to assets of the company is 0.60 and it reduced by hardly 0.1% in the year 2016. The
same ratio is increased to 0.76. Though the company is still under safe zone as the debt is not
utilised much yet the company shall be aware. The degree of the leverage shall be the major
FINANCE 8
concern for the Qantas Airways and therefore the value of the current assets shall be
increased (Gurufocus, 2018).
Interest coverage Ratio
The interest coverage ratio is the metric which keeps the record of the interest payments
which arise parallel with the outstanding debt. The business owner the Earnings before
interest and tax shall be divided by the interest expenses (Borgonovo, 2017).
Interest Coverage Ratio EBIT
Interest Expense
The interest coverage ratio is basically a source to the public which can be a clear indicator of
the fact that how much interest expenses the company is under the fact to pay to the debt
holders. After the payment of the interest and the taxes the final income is given to the
shareholders therefore, the company will be requiring to keep the interest income low so the
income can be distributed to the shareholders (Colloquy, 2015). The lower the interest
coverage ratio, the more its debt expense is going to affect the going concern of the company
and it will create a burden for the company. The company with the interest coverage ratio of
1.5 or less is considered to be unstable (Shapiro, 2008).
⊘ This is a preview!⊘
Do you want full access?
Subscribe today to unlock all pages.
Trusted by 1+ million students worldwide
FINANCE 9
2015 2016 2017
0.00
1.00
2.00
3.00
4.00
5.00
6.00
7.00
Times Interest Earned (Earnings
before Interest Expense and Taxes /
Interest Exp)
Times Interest Earned
(Earnings before Interest
Expense and Taxes /
Interest Exp)
(By Author)
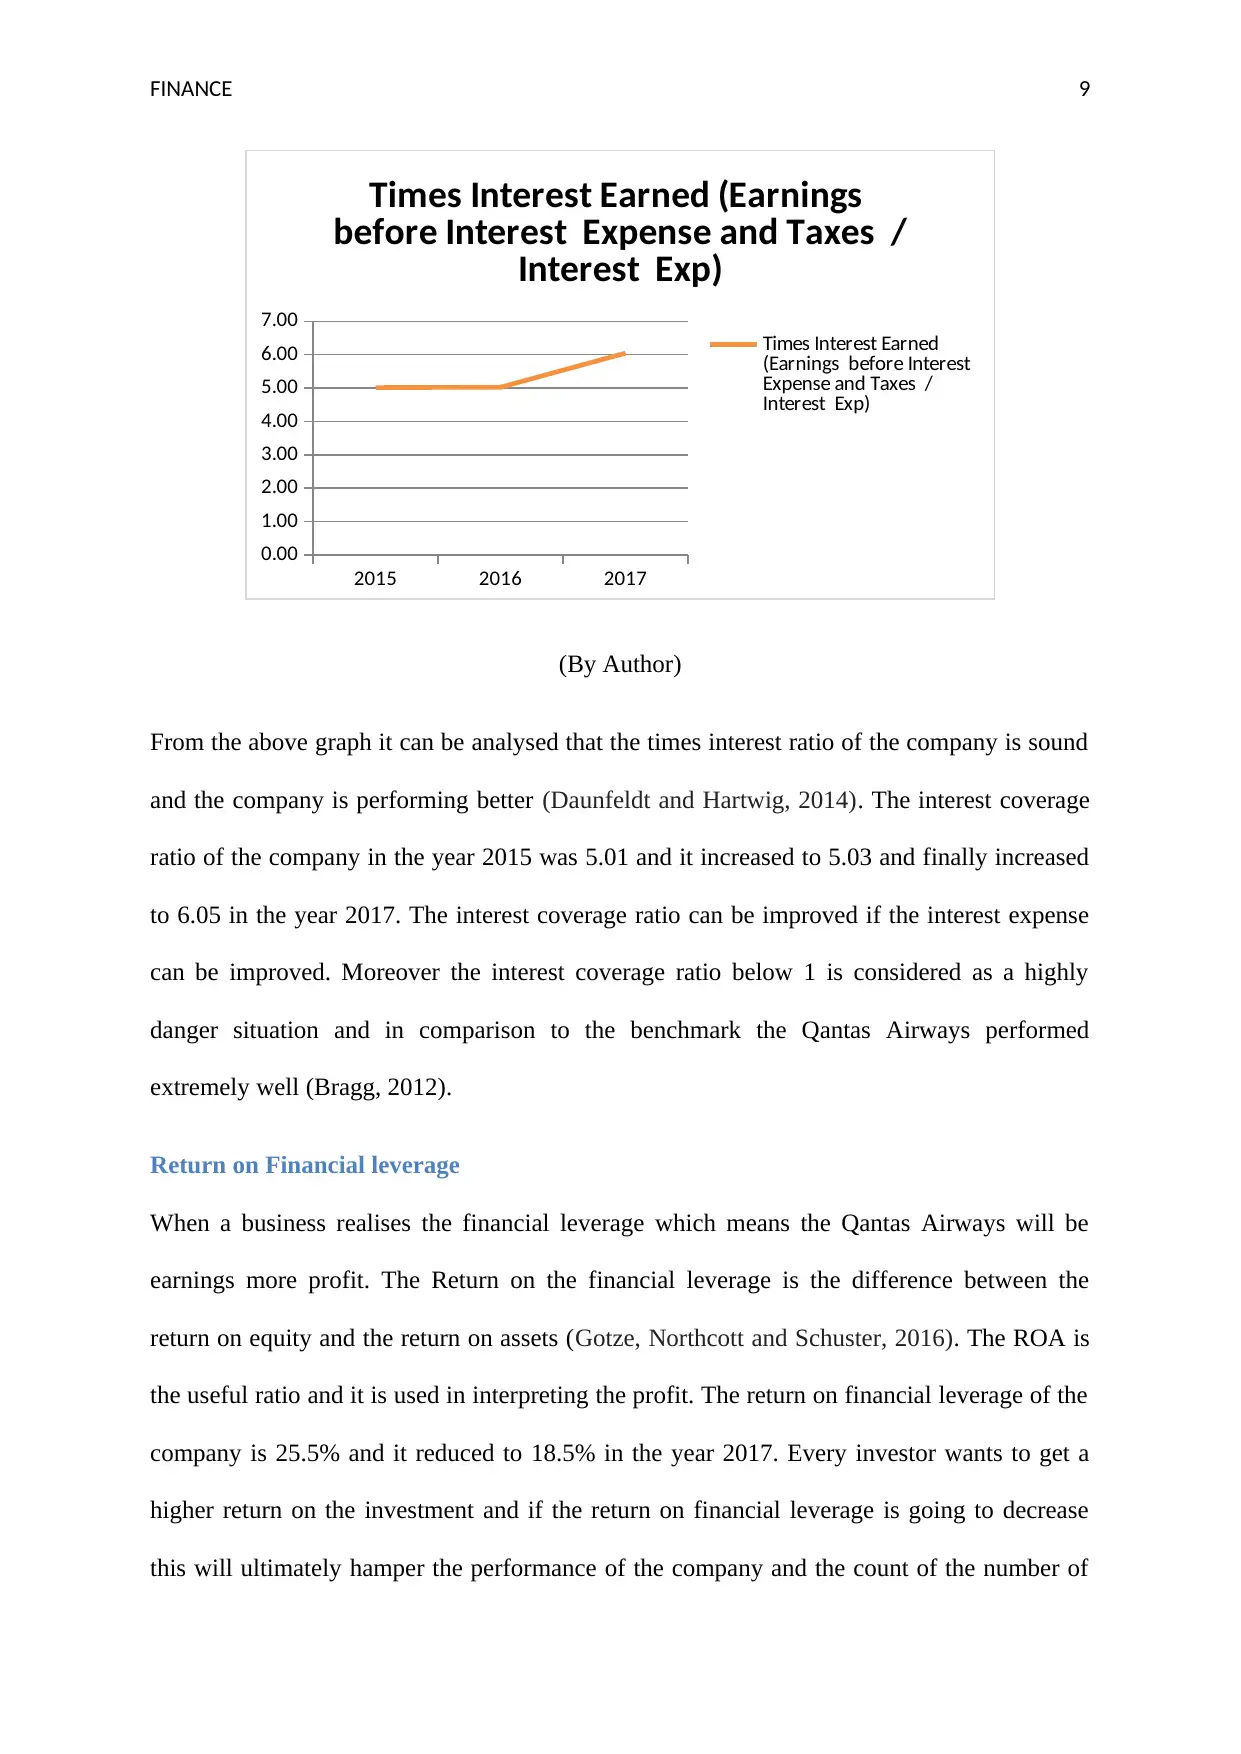
From the above graph it can be analysed that the times interest ratio of the company is sound
and the company is performing better (Daunfeldt and Hartwig, 2014). The interest coverage
ratio of the company in the year 2015 was 5.01 and it increased to 5.03 and finally increased
to 6.05 in the year 2017. The interest coverage ratio can be improved if the interest expense
can be improved. Moreover the interest coverage ratio below 1 is considered as a highly
danger situation and in comparison to the benchmark the Qantas Airways performed
extremely well (Bragg, 2012).
Return on Financial leverage
When a business realises the financial leverage which means the Qantas Airways will be
earnings more profit. The Return on the financial leverage is the difference between the
return on equity and the return on assets (Gotze, Northcott and Schuster, 2016). The ROA is
the useful ratio and it is used in interpreting the profit. The return on financial leverage of the
company is 25.5% and it reduced to 18.5% in the year 2017. Every investor wants to get a
higher return on the investment and if the return on financial leverage is going to decrease
this will ultimately hamper the performance of the company and the count of the number of
2015 2016 2017
0.00
1.00
2.00
3.00
4.00
5.00
6.00
7.00
Times Interest Earned (Earnings
before Interest Expense and Taxes /
Interest Exp)
Times Interest Earned
(Earnings before Interest
Expense and Taxes /
Interest Exp)
(By Author)
From the above graph it can be analysed that the times interest ratio of the company is sound
and the company is performing better (Daunfeldt and Hartwig, 2014). The interest coverage
ratio of the company in the year 2015 was 5.01 and it increased to 5.03 and finally increased
to 6.05 in the year 2017. The interest coverage ratio can be improved if the interest expense
can be improved. Moreover the interest coverage ratio below 1 is considered as a highly
danger situation and in comparison to the benchmark the Qantas Airways performed
extremely well (Bragg, 2012).
Return on Financial leverage
When a business realises the financial leverage which means the Qantas Airways will be
earnings more profit. The Return on the financial leverage is the difference between the
return on equity and the return on assets (Gotze, Northcott and Schuster, 2016). The ROA is
the useful ratio and it is used in interpreting the profit. The return on financial leverage of the
company is 25.5% and it reduced to 18.5% in the year 2017. Every investor wants to get a
higher return on the investment and if the return on financial leverage is going to decrease
this will ultimately hamper the performance of the company and the count of the number of
Paraphrase This Document
Need a fresh take? Get an instant paraphrase of this document with our AI Paraphraser
FINANCE 10
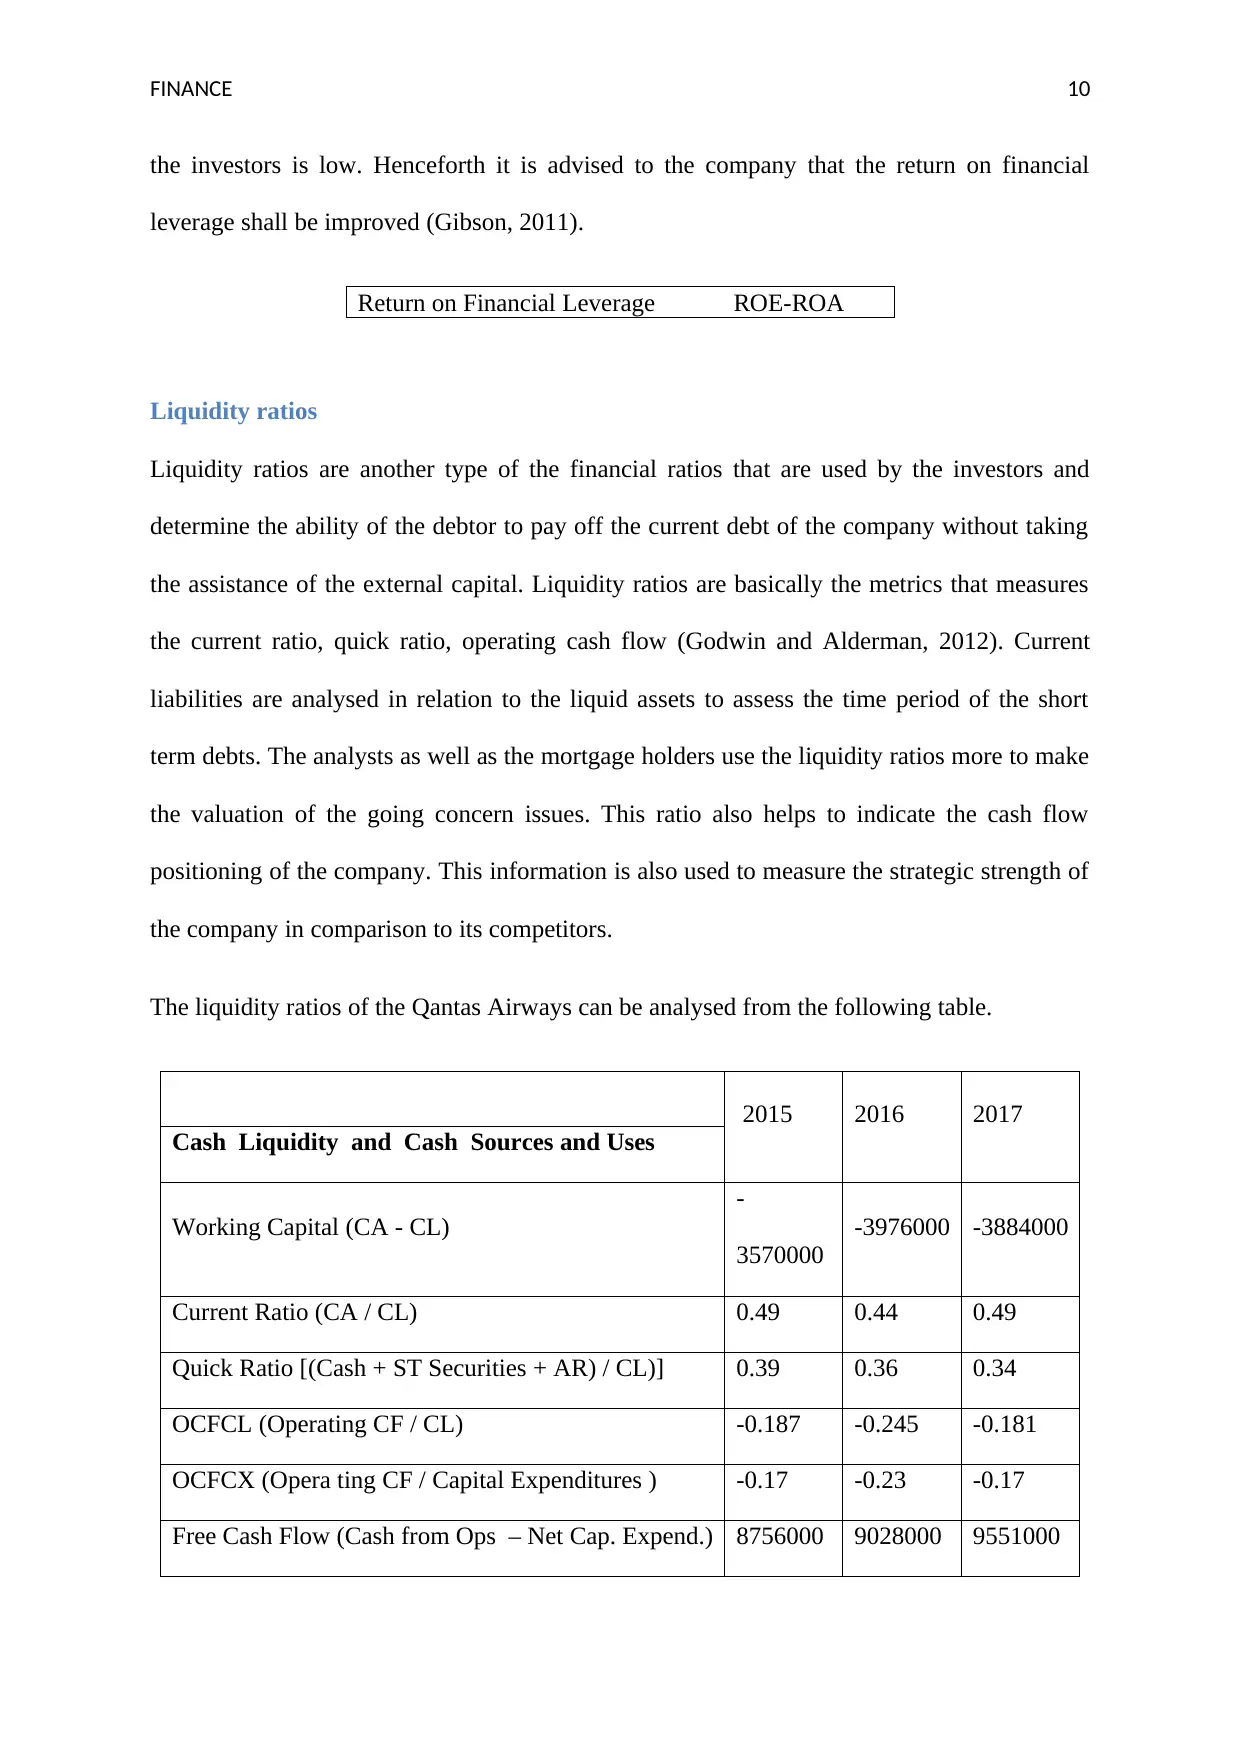
the investors is low. Henceforth it is advised to the company that the return on financial
leverage shall be improved (Gibson, 2011).
Return on Financial Leverage ROE-ROA
Liquidity ratios
Liquidity ratios are another type of the financial ratios that are used by the investors and
determine the ability of the debtor to pay off the current debt of the company without taking
the assistance of the external capital. Liquidity ratios are basically the metrics that measures
the current ratio, quick ratio, operating cash flow (Godwin and Alderman, 2012). Current
liabilities are analysed in relation to the liquid assets to assess the time period of the short
term debts. The analysts as well as the mortgage holders use the liquidity ratios more to make
the valuation of the going concern issues. This ratio also helps to indicate the cash flow
positioning of the company. This information is also used to measure the strategic strength of
the company in comparison to its competitors.
The liquidity ratios of the Qantas Airways can be analysed from the following table.
2015 2016 2017
Cash Liquidity and Cash Sources and Uses
Working Capital (CA - CL)
-
3570000
-3976000 -3884000
Current Ratio (CA / CL) 0.49 0.44 0.49
Quick Ratio [(Cash + ST Securities + AR) / CL)] 0.39 0.36 0.34
OCFCL (Operating CF / CL) -0.187 -0.245 -0.181
OCFCX (Opera ting CF / Capital Expenditures ) -0.17 -0.23 -0.17
Free Cash Flow (Cash from Ops – Net Cap. Expend.) 8756000 9028000 9551000
FINANCE 11
Current Ratio
Current ratio is the kind of the liquidity ratio which is used to measure the ability of the
company to pay short term liabilities as well as the long term liabilities. To cover this kind of
the liability the current ratios takes into the consideration that the total assets of the company
and its relation to the current liabilities of the company. From the table below it can be
analysed that the company is maintaining its current ratio from 0.48 to 0.50 consistently or
the past three years (Higgins, 2012). The company shall increase its ratio to 2:1 which is also
considered as the ideal ratio as per the standards of the industry. It is advised to the company
to get rid of the useless assets that are not beneficial to the company, and also the company
shall also control the overhead expenses to which the major cost cutting is possible.
Current Ratio Current Assets
Current Liabilities
Quick Ratio
The quick ratio also known as the liquid ratio or the acid test ratio is used to determine the
ability of the fir to generate the cash to pay back to the current liabilities and the obligations.
The quick ratio is basically the tester that determines the value of how much cash the
company can generate within the stipulated period of the 90 days. The assets and the
marketable securities are the quick generator of the cash and therefore this ratio reflects the
ideology of the quick sources of the cash (Jenter and Lewellen, 2015). The major difference
between the quick ratio and the current ratio is that not all the current assets are convertible
into cash within the given time frame. For example inventories.
⊘ This is a preview!⊘
Do you want full access?
Subscribe today to unlock all pages.
Trusted by 1+ million students worldwide
1 out of 20
Related Documents


Your All-in-One AI-Powered Toolkit for Academic Success.
+13062052269
info@desklib.com
Available 24*7 on WhatsApp / Email
![[object Object]](/_next/static/media/star-bottom.7253800d.svg)
Unlock your academic potential
Copyright © 2020–2026 A2Z Services. All Rights Reserved. Developed and managed by ZUCOL.