Analyzing, Forecasting, and Interpreting Financial Statements Report

Verified

Added on  2020/03/07

|6
|1497
|43
Report
AI Summary
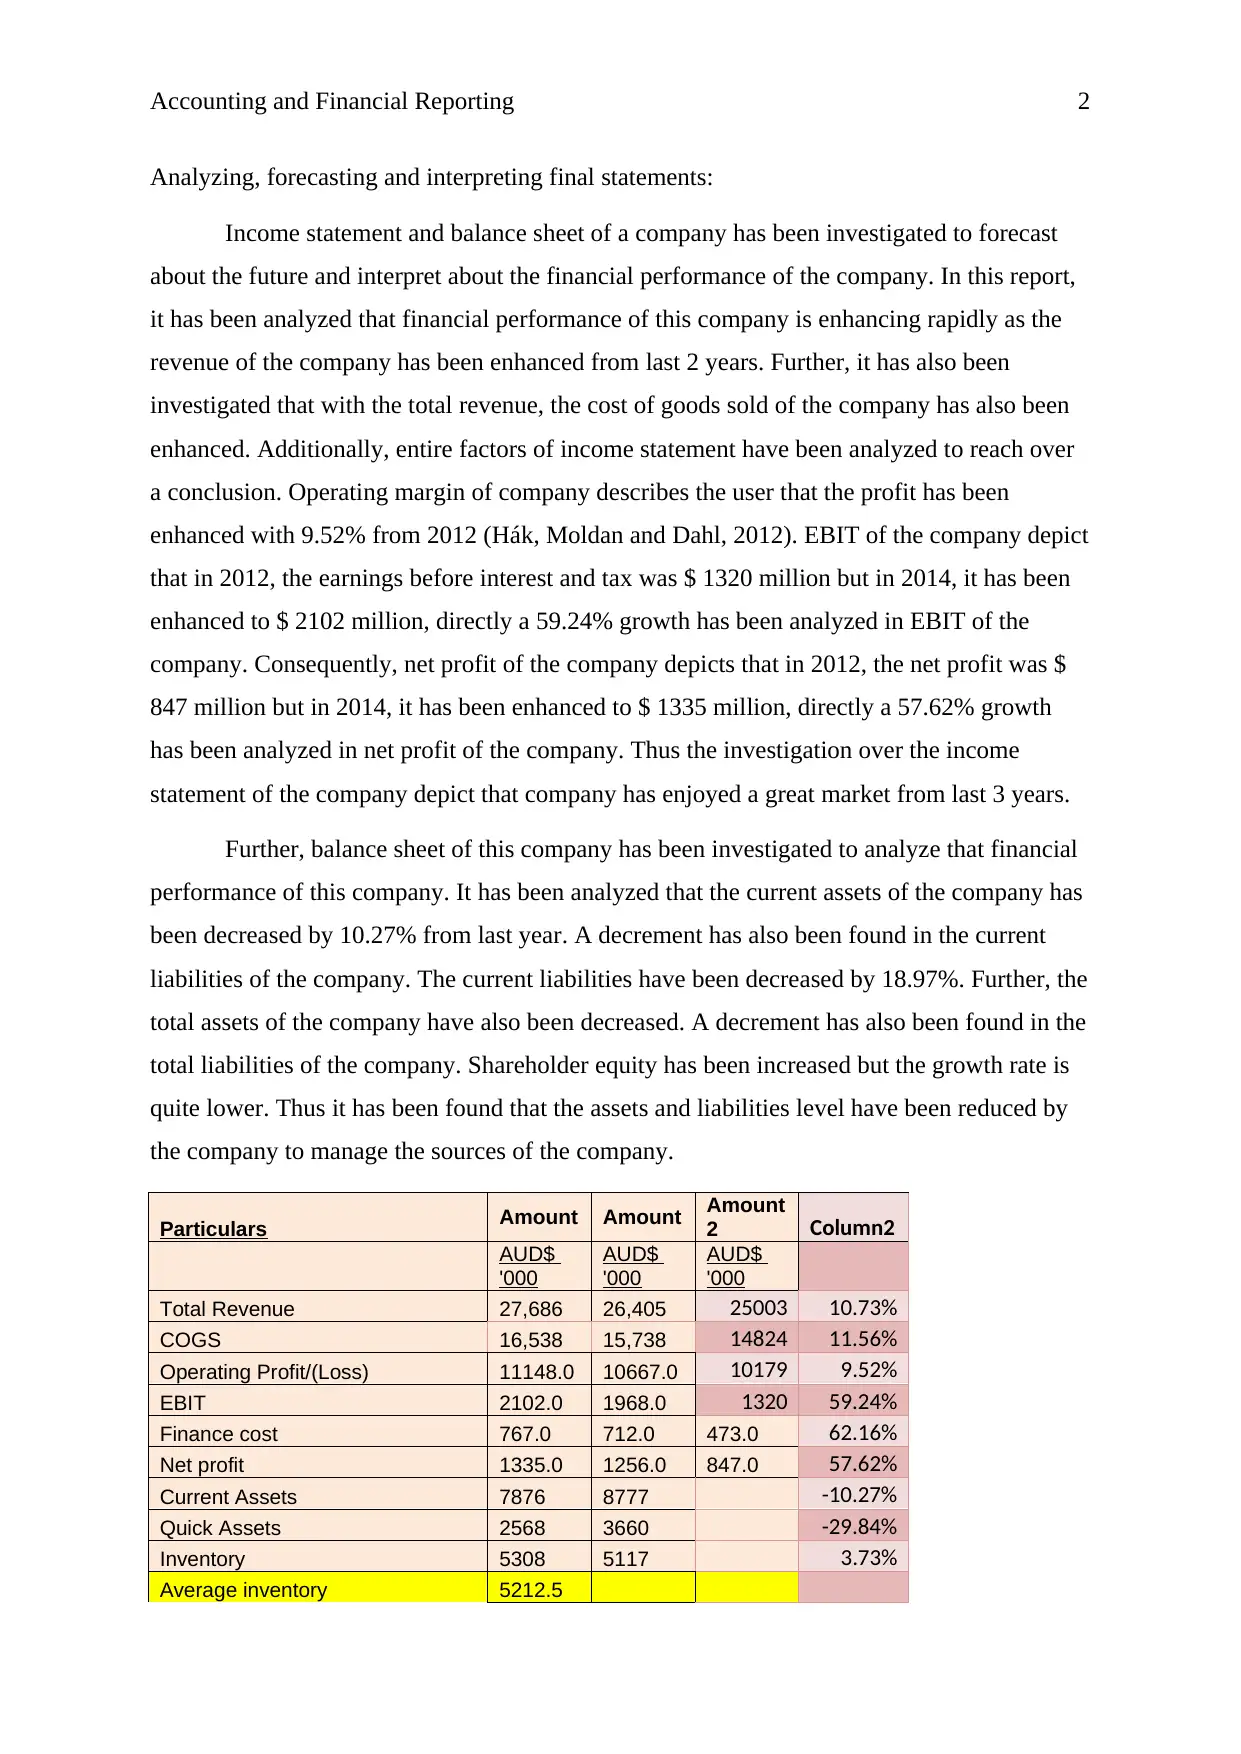
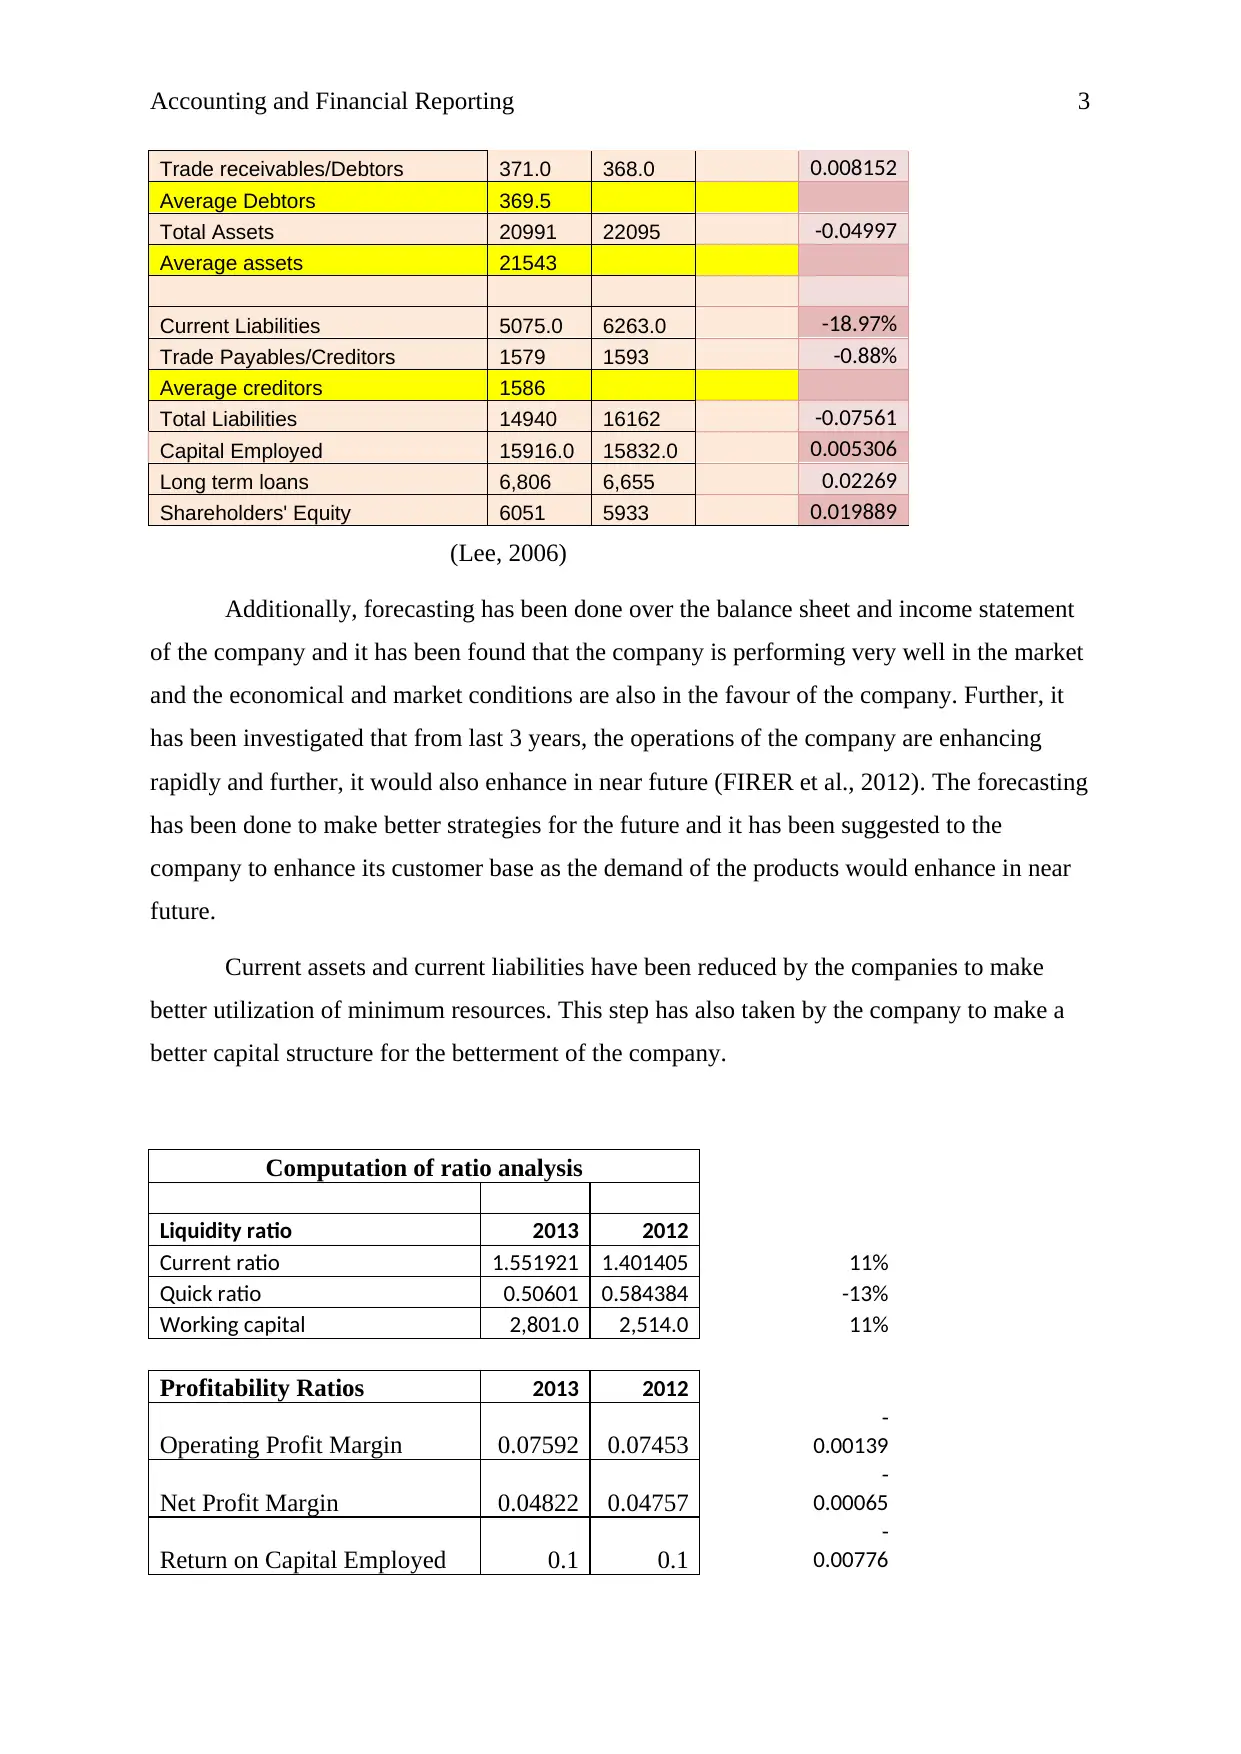
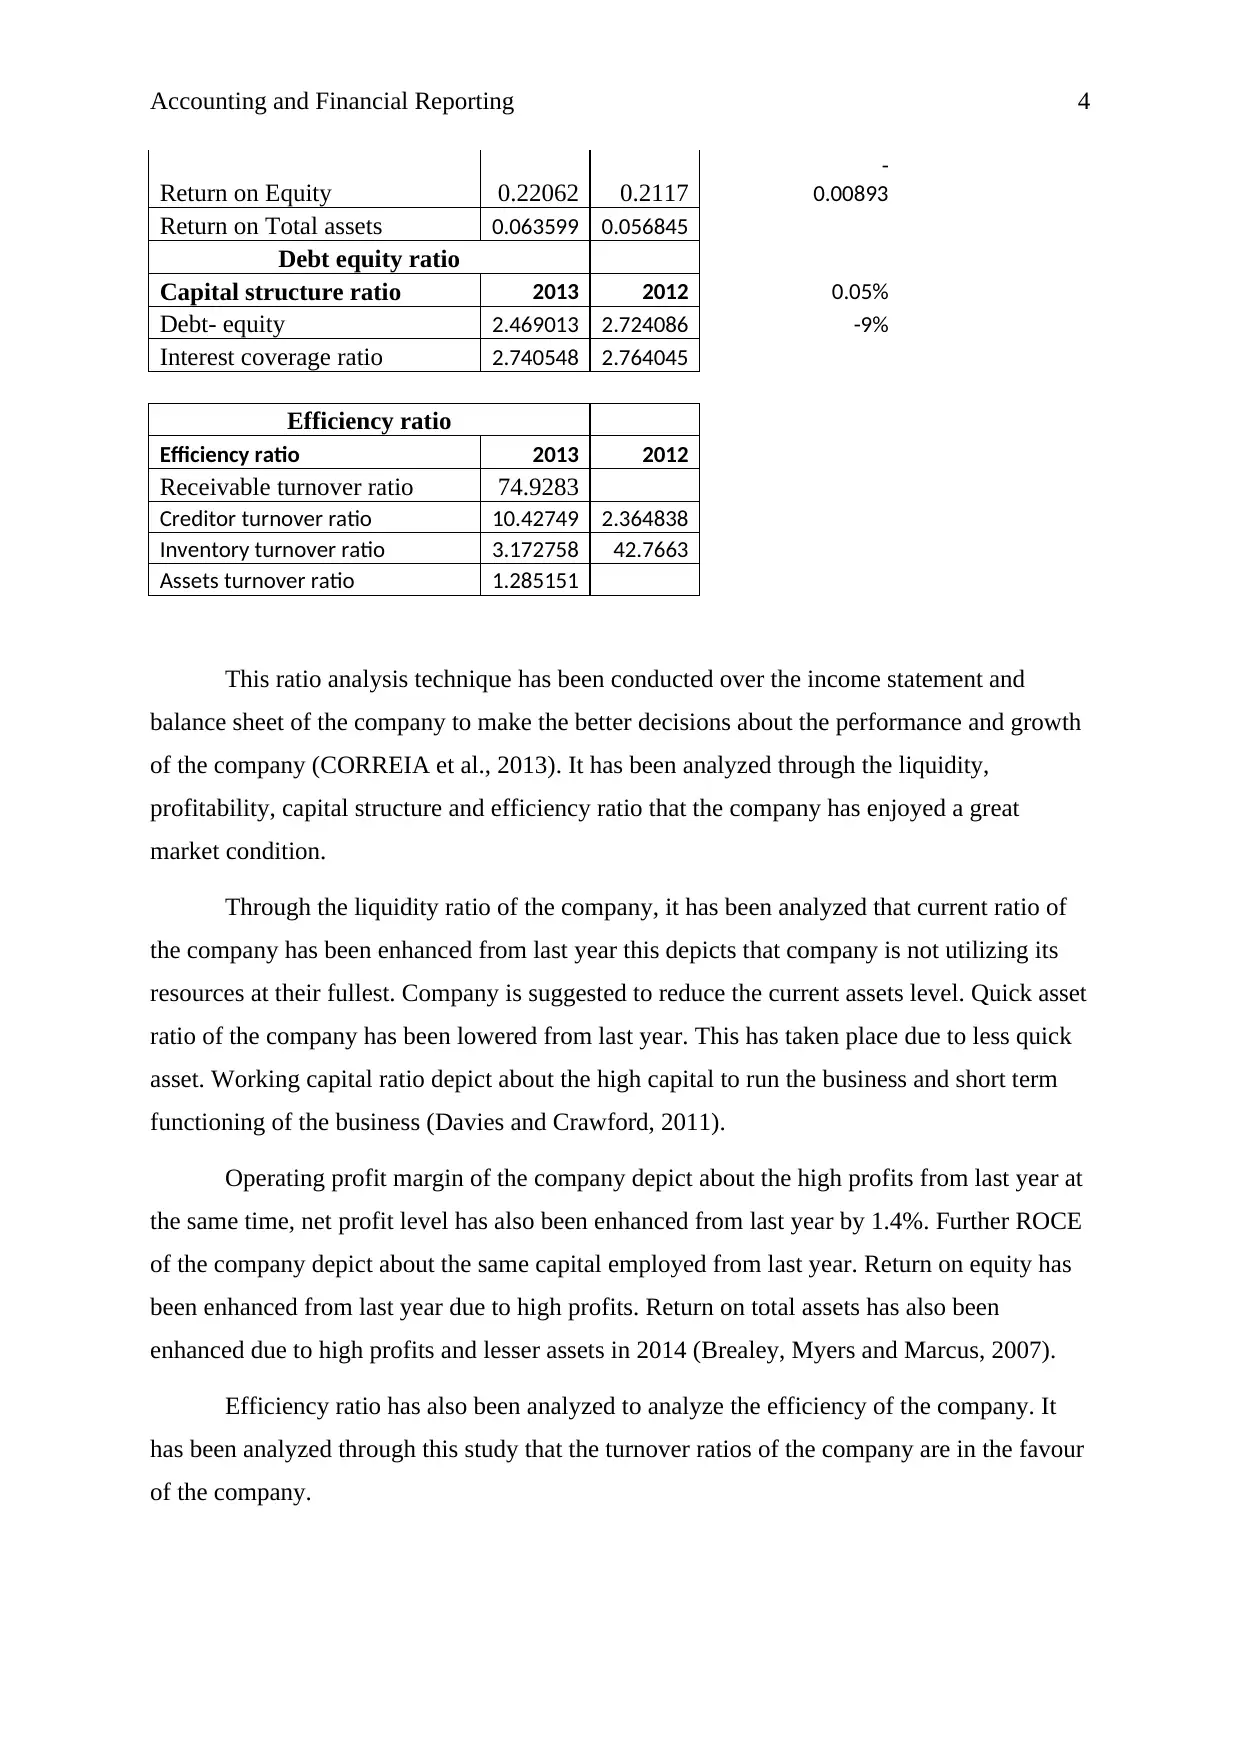
This report provides a comprehensive analysis of a company's financial performance, focusing on its income statement and balance sheet over a three-year period (2012-2014). The analysis reveals a positive trend, with increasing revenue, cost of goods sold, and significant growth in operating profit, EBIT, and net profit. The balance sheet analysis indicates a decrease in current assets and liabilities, with a slight increase in shareholder equity. Ratio analysis, including liquidity, profitability, capital structure, and efficiency ratios, further supports the positive financial health of the company. The report concludes with forecasting and strategic recommendations to enhance customer and market base, emphasizing efficient resource utilization and a strong capital structure. References to key financial texts are included to support the analysis.
Document Page
Running Head: Accounting and Financial Reporting
1
Accounting and financial Reporting
Student’s Name
tabler-icon-diamond-filled.svg

Paraphrase This Document

Need a fresh take? Get an instant paraphrase of this document with our AI Paraphraser
Document Page
Accounting and Financial Reporting 2
Analyzing, forecasting and interpreting final statements:
Income statement and balance sheet of a company has been investigated to forecast
about the future and interpret about the financial performance of the company. In this report,
it has been analyzed that financial performance of this company is enhancing rapidly as the
revenue of the company has been enhanced from last 2 years. Further, it has also been
investigated that with the total revenue, the cost of goods sold of the company has also been
enhanced. Additionally, entire factors of income statement have been analyzed to reach over
a conclusion. Operating margin of company describes the user that the profit has been
enhanced with 9.52% from 2012 (Hák, Moldan and Dahl, 2012). EBIT of the company depict
that in 2012, the earnings before interest and tax was $ 1320 million but in 2014, it has been
enhanced to $ 2102 million, directly a 59.24% growth has been analyzed in EBIT of the
company. Consequently, net profit of the company depicts that in 2012, the net profit was $
847 million but in 2014, it has been enhanced to $ 1335 million, directly a 57.62% growth
has been analyzed in net profit of the company. Thus the investigation over the income
statement of the company depict that company has enjoyed a great market from last 3 years.
Further, balance sheet of this company has been investigated to analyze that financial
performance of this company. It has been analyzed that the current assets of the company has
been decreased by 10.27% from last year. A decrement has also been found in the current
liabilities of the company. The current liabilities have been decreased by 18.97%. Further, the
total assets of the company have also been decreased. A decrement has also been found in the
total liabilities of the company. Shareholder equity has been increased but the growth rate is
quite lower. Thus it has been found that the assets and liabilities level have been reduced by
the company to manage the sources of the company.
Particulars Amount Amount Amount
2 Column2
AUD$
'000
AUD$
'000
AUD$
'000
Total Revenue 27,686 26,405 25003 10.73%
COGS 16,538 15,738 14824 11.56%
Operating Profit/(Loss) 11148.0 10667.0 10179 9.52%
EBIT 2102.0 1968.0 1320 59.24%
Finance cost 767.0 712.0 473.0 62.16%
Net profit 1335.0 1256.0 847.0 57.62%
Current Assets 7876 8777 -10.27%
Quick Assets 2568 3660 -29.84%
Inventory 5308 5117 3.73%
Average inventory 5212.5
Document Page
Accounting and Financial Reporting 3
Trade receivables/Debtors 371.0 368.0 0.008152
Average Debtors 369.5
Total Assets 20991 22095 -0.04997
Average assets 21543
Current Liabilities 5075.0 6263.0 -18.97%
Trade Payables/Creditors 1579 1593 -0.88%
Average creditors 1586
Total Liabilities 14940 16162 -0.07561
Capital Employed 15916.0 15832.0 0.005306
Long term loans 6,806 6,655 0.02269
Shareholders' Equity 6051 5933 0.019889
(Lee, 2006)
Additionally, forecasting has been done over the balance sheet and income statement
of the company and it has been found that the company is performing very well in the market
and the economical and market conditions are also in the favour of the company. Further, it
has been investigated that from last 3 years, the operations of the company are enhancing
rapidly and further, it would also enhance in near future (FIRER et al., 2012). The forecasting
has been done to make better strategies for the future and it has been suggested to the
company to enhance its customer base as the demand of the products would enhance in near
future.
Current assets and current liabilities have been reduced by the companies to make
better utilization of minimum resources. This step has also taken by the company to make a
better capital structure for the betterment of the company.
Computation of ratio analysis
Liquidity ratio 2013 2012
Current ratio 1.551921 1.401405 11%
Quick ratio 0.50601 0.584384 -13%
Working capital 2,801.0 2,514.0 11%
Profitability Ratios 2013 2012
Operating Profit Margin 0.07592 0.07453
-
0.00139
Net Profit Margin 0.04822 0.04757
-
0.00065
Return on Capital Employed 0.1 0.1
-
0.00776
Document Page
Accounting and Financial Reporting 4
Return on Equity 0.22062 0.2117
-
0.00893
Return on Total assets 0.063599 0.056845
Debt equity ratio
Capital structure ratio 2013 2012 0.05%
Debt- equity 2.469013 2.724086 -9%
Interest coverage ratio 2.740548 2.764045
Efficiency ratio
Efficiency ratio 2013 2012
Receivable turnover ratio 74.9283
Creditor turnover ratio 10.42749 2.364838
Inventory turnover ratio 3.172758 42.7663
Assets turnover ratio 1.285151
This ratio analysis technique has been conducted over the income statement and
balance sheet of the company to make the better decisions about the performance and growth
of the company (CORREIA et al., 2013). It has been analyzed through the liquidity,
profitability, capital structure and efficiency ratio that the company has enjoyed a great
market condition.
Through the liquidity ratio of the company, it has been analyzed that current ratio of
the company has been enhanced from last year this depicts that company is not utilizing its
resources at their fullest. Company is suggested to reduce the current assets level. Quick asset
ratio of the company has been lowered from last year. This has taken place due to less quick
asset. Working capital ratio depict about the high capital to run the business and short term
functioning of the business (Davies and Crawford, 2011).
Operating profit margin of the company depict about the high profits from last year at
the same time, net profit level has also been enhanced from last year by 1.4%. Further ROCE
of the company depict about the same capital employed from last year. Return on equity has
been enhanced from last year due to high profits. Return on total assets has also been
enhanced due to high profits and lesser assets in 2014 (Brealey, Myers and Marcus, 2007).
Efficiency ratio has also been analyzed to analyze the efficiency of the company. It
has been analyzed through this study that the turnover ratios of the company are in the favour
of the company.
tabler-icon-diamond-filled.svg

Paraphrase This Document

Need a fresh take? Get an instant paraphrase of this document with our AI Paraphraser
Document Page
Accounting and Financial Reporting 5
Thus through this analysis it could be concluded that the performance and growth of
the company is commendable. Company is just need to make some changed into its
operations to enhanced the customer base and market base of the company.
Document Page
Accounting and Financial Reporting 6
References:
Brealey, R., Myers, S.C. and Marcus, A.J., 2007. FundamentalsofCorporate Finance. Mc
Graw Hill, New York.
CORREIA, C. et al. 2013. Financial Management. 7th Edition. Cape Town: Juta
andCompany Ltd.2.
Davies, T. and Crawford, I., 2011. Business accounting and finance. Pearson.
FIRER, C. et al. 2012. Fundamentals of Corporate Finance. 5th Edition.Berkshire.McGraw-
Hill Companies, Inc.
Hák, T., Moldan, B., and Dahl, A. L. (Eds.)., 2012. Sustainability indicators: a scientific
assessment (Vol. 67). Island Press.
Lee, T.A., 2006. The FASB and accounting for economic reality. Accounting and the Public
Interest, 6(1), pp.1-21.
chevron_up_icon
1 out of 6
circle_padding
hide_on_mobile
zoom_out_icon
[object Object]