William Angliss Institute: MAN605 Financial Health Assessment Report

Verified

Added on  2022/11/13

|10
|1755
|220
Report
AI Summary
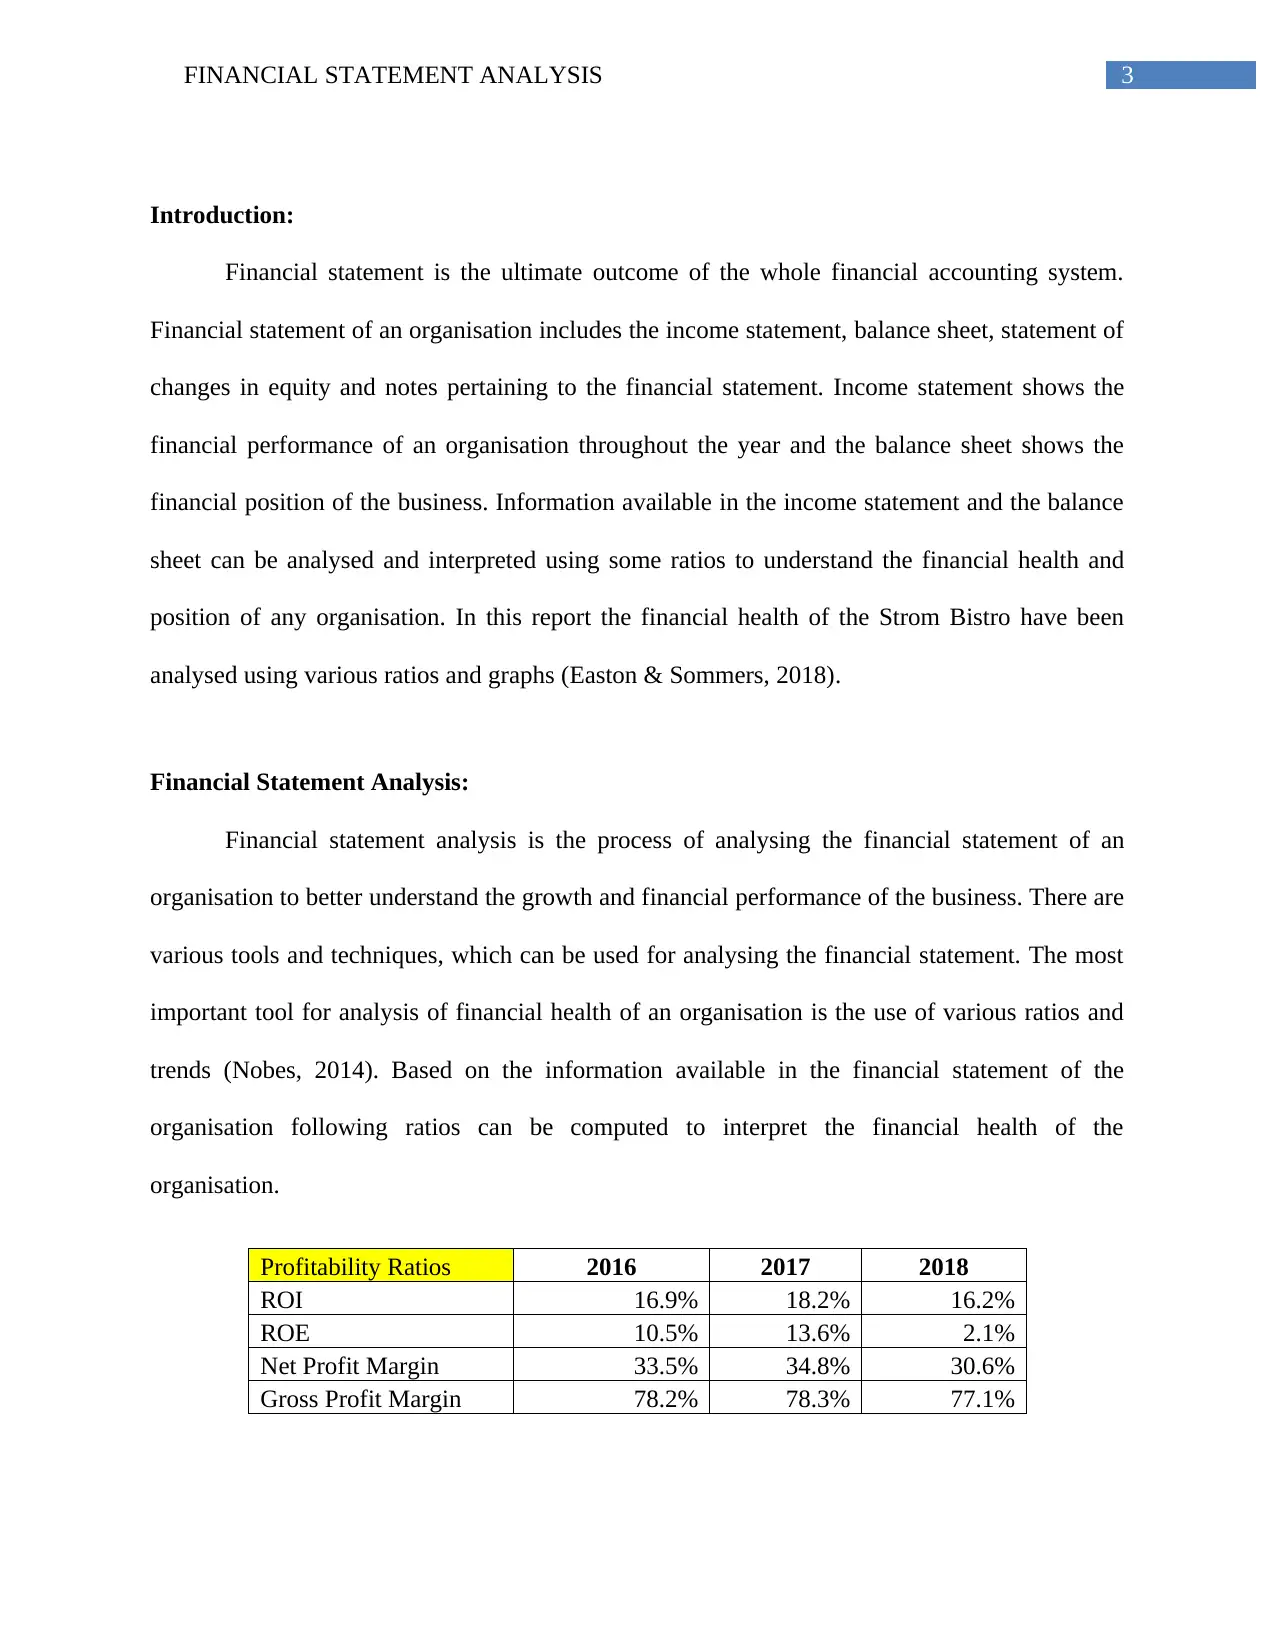
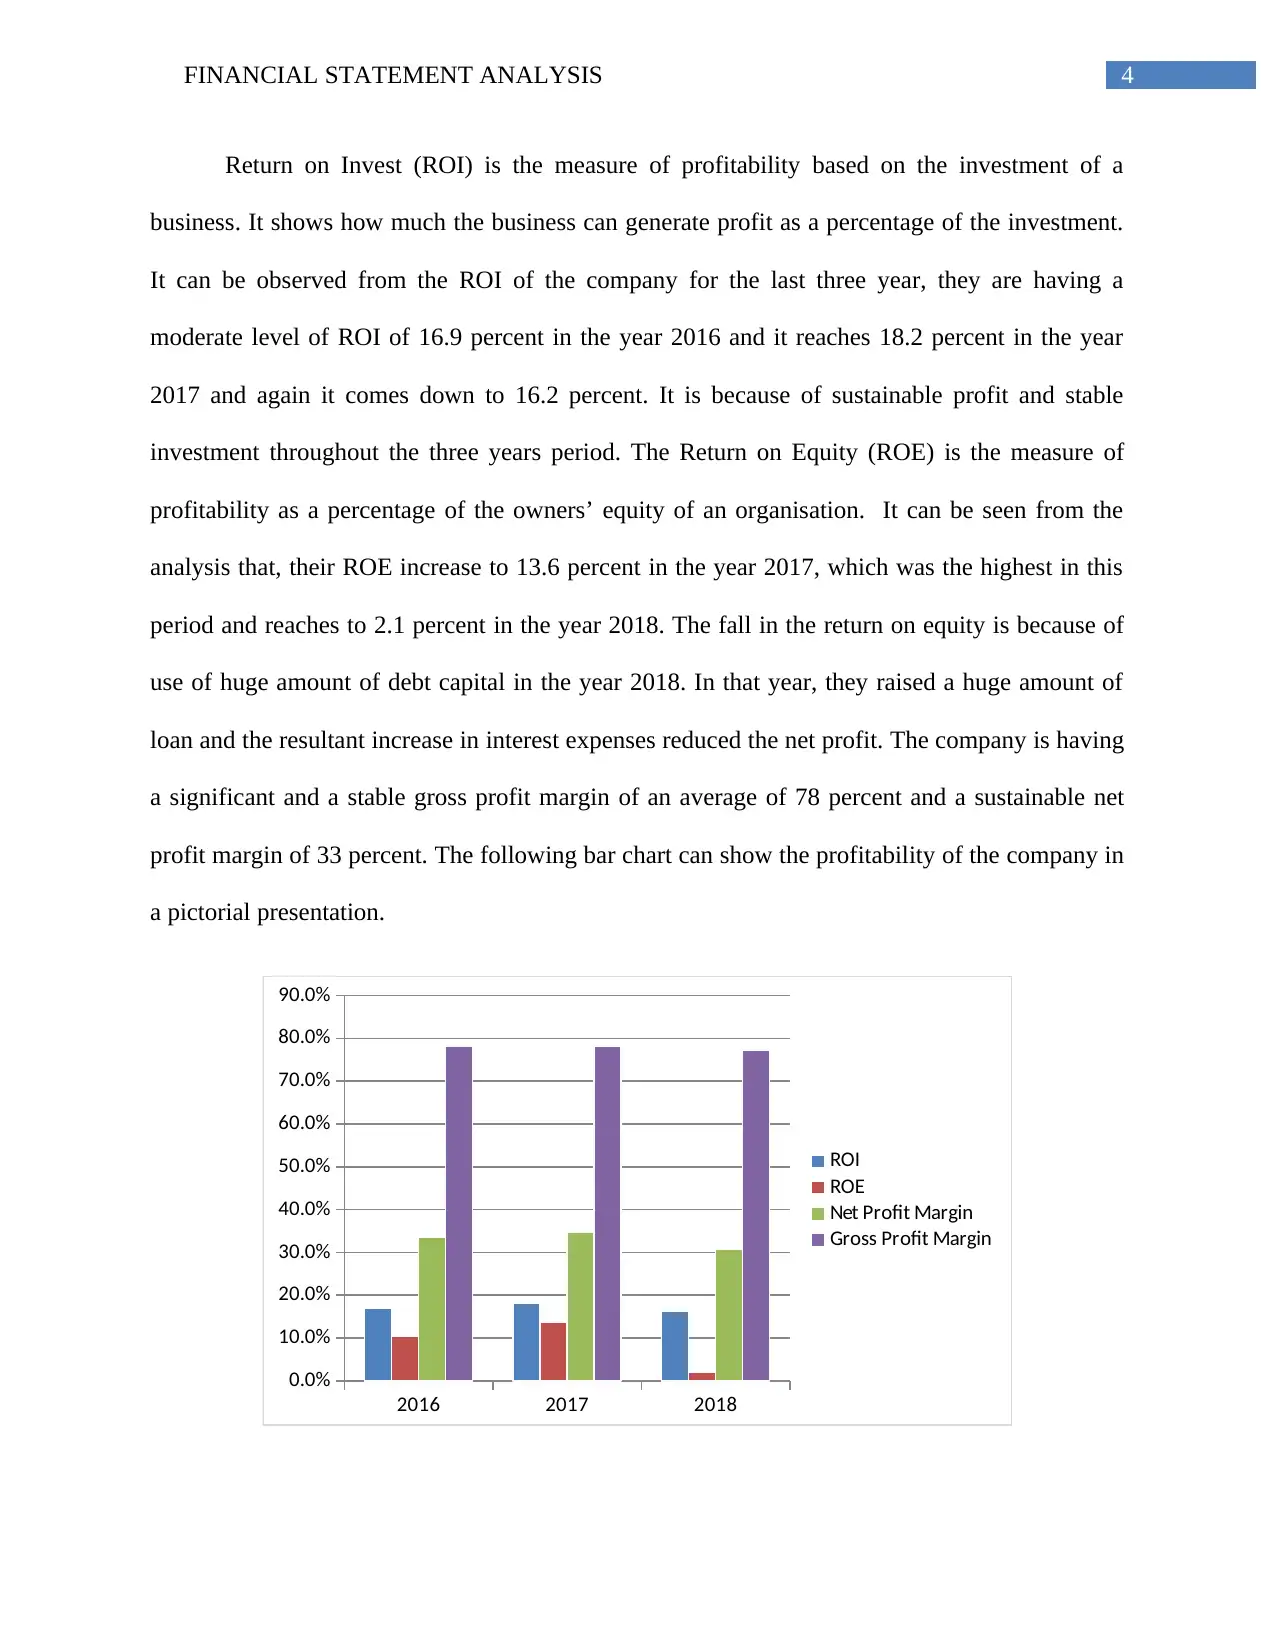
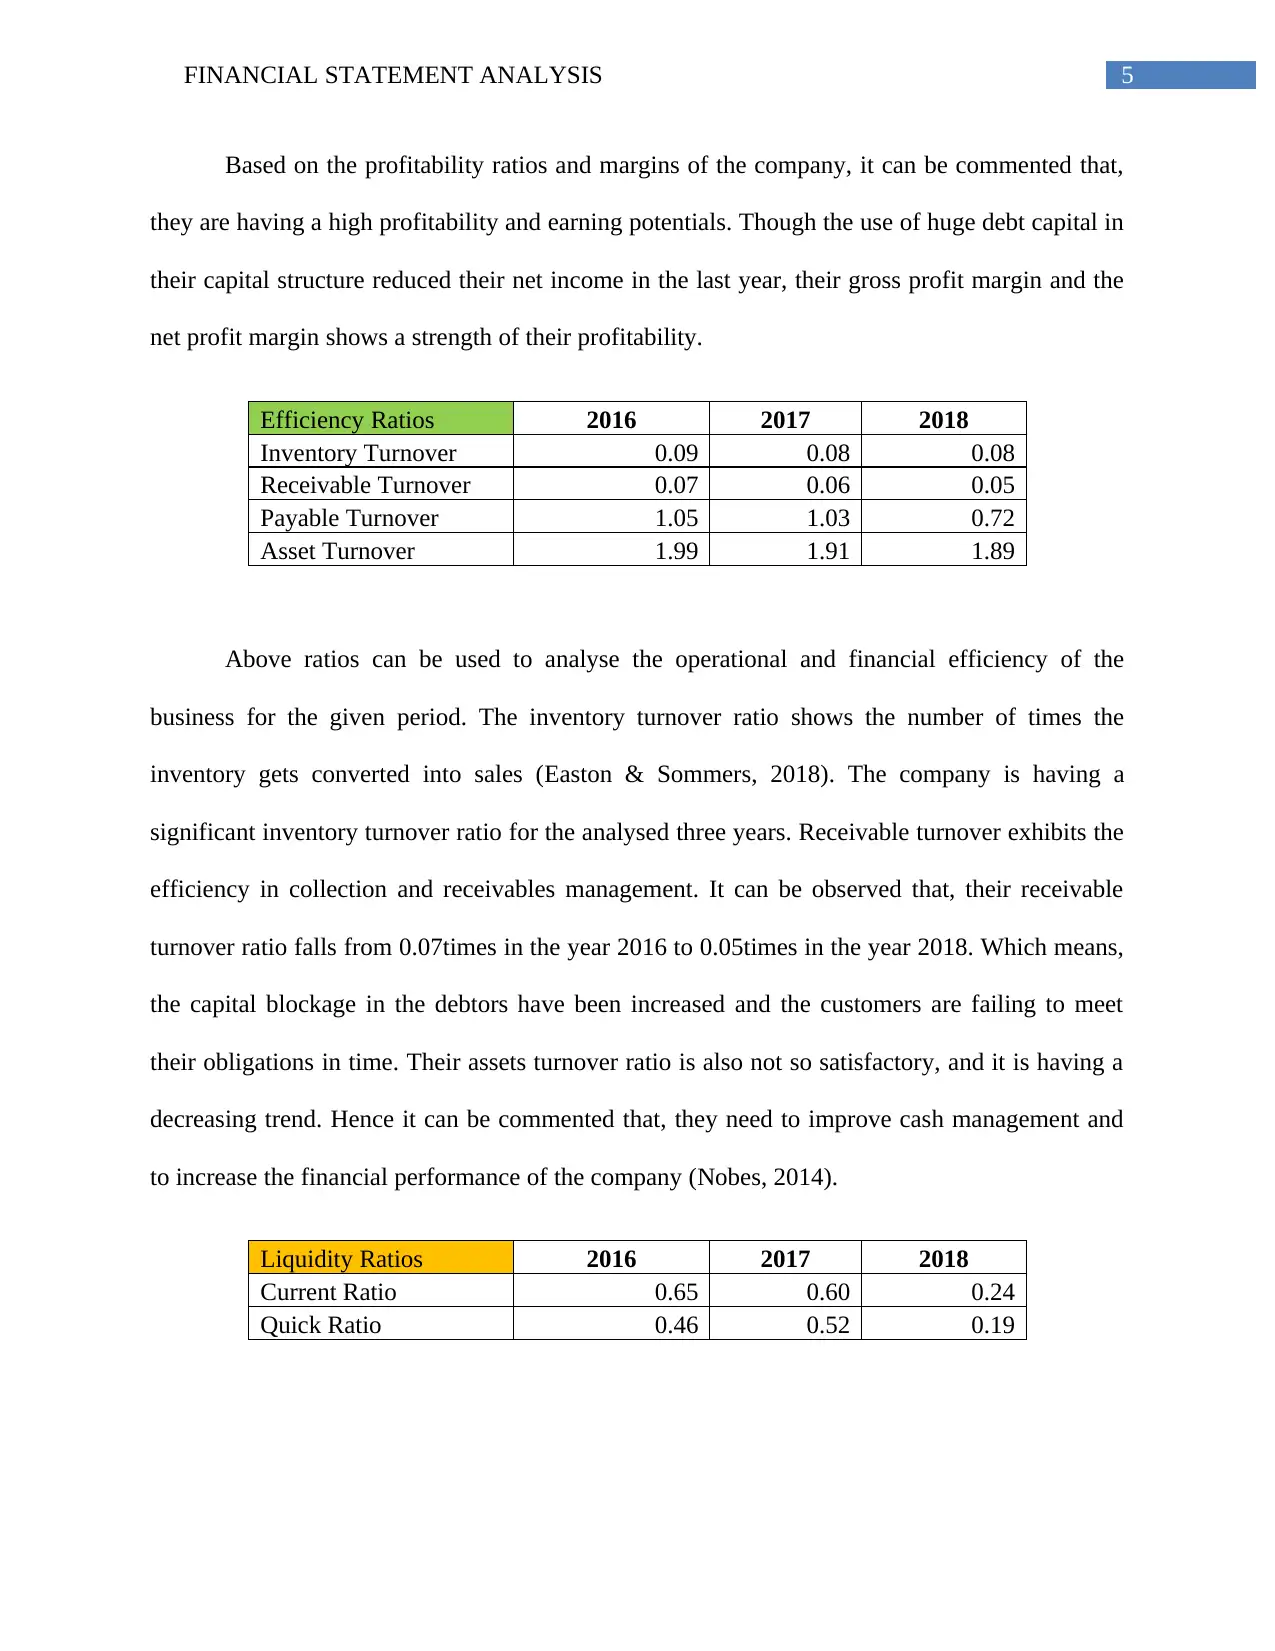
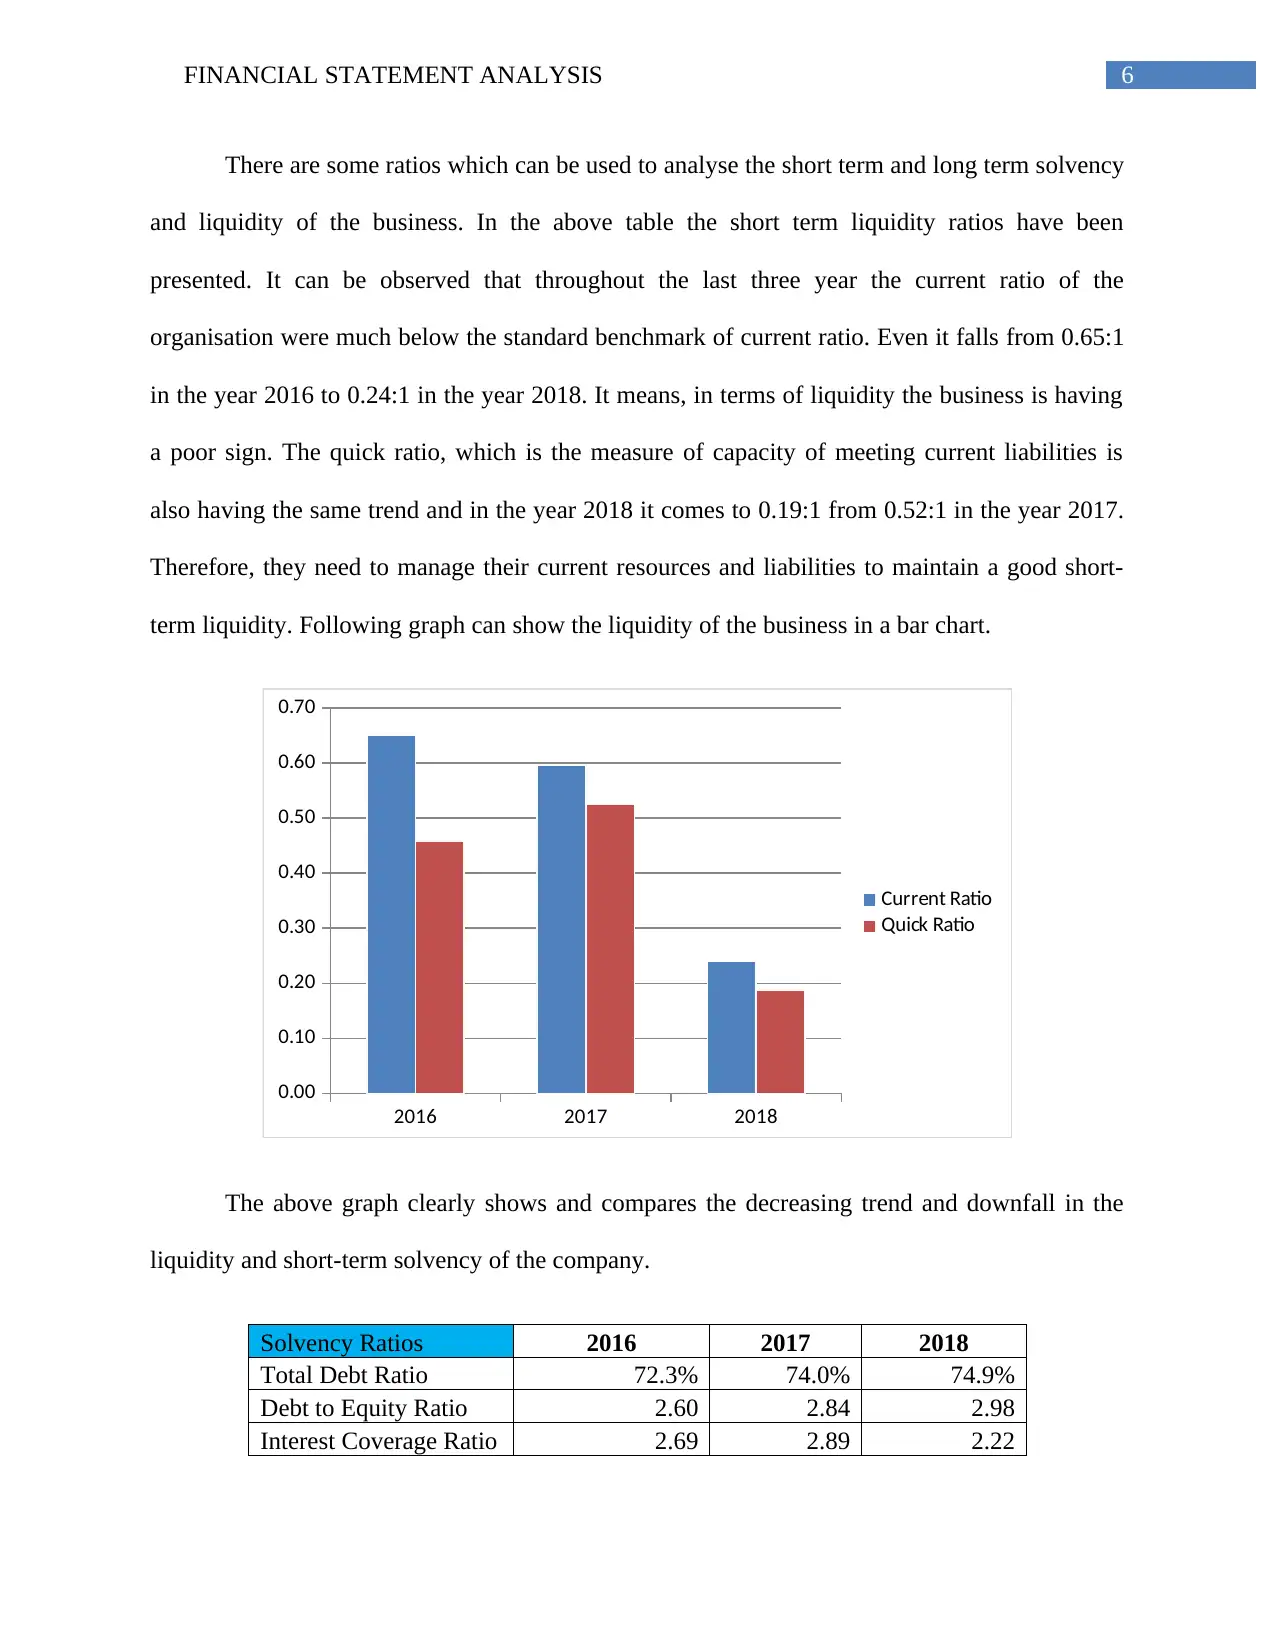
This report provides a comprehensive financial statement analysis of Strom Bistro, examining its financial performance and position from 2016 to 2018. The analysis encompasses profitability ratios (ROI, ROE, profit margins), efficiency ratios (inventory, receivable, payable, and asset turnover), liquidity ratios (current and quick ratios), and solvency ratios (total debt, debt-to-equity, and interest coverage). The report highlights trends in these ratios, providing insights into the company's financial health, including its profitability, operational efficiency, liquidity, and solvency. The analysis reveals strengths in profitability but also points out concerns regarding liquidity and solvency, particularly the increased use of debt. Based on the analysis, the report concludes with recommendations for the management to improve the financial performance and health of the company, including better cash management, improved collection systems, and capital structure restructuring.
Document Page
Running head: FINANCIAL STATEMENT ANALYSIS
Financial Statement Analysis
Name of the Student:
Name of the University:
Author’s Note:
tabler-icon-diamond-filled.svg

Paraphrase This Document

Need a fresh take? Get an instant paraphrase of this document with our AI Paraphraser
Document Page
1FINANCIAL STATEMENT ANALYSIS
Executive Summary:
This report is prepared to describe and understand the process of financial statement analysis.
Financial statement analysis is a process of interpreting the financial performance and financial
position of an organization based on the information available in the annual report or the
financial statement of an organization. In this report, the financial health of the company Strom
Bistro has been analyzed based on the information available in their financial statement for the
last three years. Lastly the report concludes with some recommendation for the company for
improvement in their financial performance and financial health.
Document Page
2FINANCIAL STATEMENT ANALYSIS
Table of Contents
Introduction:....................................................................................................................................3
Financial Statement Analysis:.........................................................................................................3
Conclusion:......................................................................................................................................8
Recommendations:..........................................................................................................................8
References and bibliography:..........................................................................................................9
Document Page
3FINANCIAL STATEMENT ANALYSIS
Introduction:
Financial statement is the ultimate outcome of the whole financial accounting system.
Financial statement of an organisation includes the income statement, balance sheet, statement of
changes in equity and notes pertaining to the financial statement. Income statement shows the
financial performance of an organisation throughout the year and the balance sheet shows the
financial position of the business. Information available in the income statement and the balance
sheet can be analysed and interpreted using some ratios to understand the financial health and
position of any organisation. In this report the financial health of the Strom Bistro have been
analysed using various ratios and graphs (Easton & Sommers, 2018).
Financial Statement Analysis:
Financial statement analysis is the process of analysing the financial statement of an
organisation to better understand the growth and financial performance of the business. There are
various tools and techniques, which can be used for analysing the financial statement. The most
important tool for analysis of financial health of an organisation is the use of various ratios and
trends (Nobes, 2014). Based on the information available in the financial statement of the
organisation following ratios can be computed to interpret the financial health of the
organisation.
Profitability Ratios 2016 2017 2018
ROI 16.9% 18.2% 16.2%
ROE 10.5% 13.6% 2.1%
Net Profit Margin 33.5% 34.8% 30.6%
Gross Profit Margin 78.2% 78.3% 77.1%
tabler-icon-diamond-filled.svg

Paraphrase This Document

Need a fresh take? Get an instant paraphrase of this document with our AI Paraphraser
Document Page
4FINANCIAL STATEMENT ANALYSIS
Return on Invest (ROI) is the measure of profitability based on the investment of a
business. It shows how much the business can generate profit as a percentage of the investment.
It can be observed from the ROI of the company for the last three year, they are having a
moderate level of ROI of 16.9 percent in the year 2016 and it reaches 18.2 percent in the year
2017 and again it comes down to 16.2 percent. It is because of sustainable profit and stable
investment throughout the three years period. The Return on Equity (ROE) is the measure of
profitability as a percentage of the owners’ equity of an organisation. It can be seen from the
analysis that, their ROE increase to 13.6 percent in the year 2017, which was the highest in this
period and reaches to 2.1 percent in the year 2018. The fall in the return on equity is because of
use of huge amount of debt capital in the year 2018. In that year, they raised a huge amount of
loan and the resultant increase in interest expenses reduced the net profit. The company is having
a significant and a stable gross profit margin of an average of 78 percent and a sustainable net
profit margin of 33 percent. The following bar chart can show the profitability of the company in
a pictorial presentation.
2016 2017 2018
0.0%
10.0%
20.0%
30.0%
40.0%
50.0%
60.0%
70.0%
80.0%
90.0%
ROI
ROE
Net Profit Margin
Gross Profit Margin
Document Page
5FINANCIAL STATEMENT ANALYSIS
Based on the profitability ratios and margins of the company, it can be commented that,
they are having a high profitability and earning potentials. Though the use of huge debt capital in
their capital structure reduced their net income in the last year, their gross profit margin and the
net profit margin shows a strength of their profitability.
Efficiency Ratios 2016 2017 2018
Inventory Turnover 0.09 0.08 0.08
Receivable Turnover 0.07 0.06 0.05
Payable Turnover 1.05 1.03 0.72
Asset Turnover 1.99 1.91 1.89
Above ratios can be used to analyse the operational and financial efficiency of the
business for the given period. The inventory turnover ratio shows the number of times the
inventory gets converted into sales (Easton & Sommers, 2018). The company is having a
significant inventory turnover ratio for the analysed three years. Receivable turnover exhibits the
efficiency in collection and receivables management. It can be observed that, their receivable
turnover ratio falls from 0.07times in the year 2016 to 0.05times in the year 2018. Which means,
the capital blockage in the debtors have been increased and the customers are failing to meet
their obligations in time. Their assets turnover ratio is also not so satisfactory, and it is having a
decreasing trend. Hence it can be commented that, they need to improve cash management and
to increase the financial performance of the company (Nobes, 2014).
Liquidity Ratios 2016 2017 2018
Current Ratio 0.65 0.60 0.24
Quick Ratio 0.46 0.52 0.19
Document Page
6FINANCIAL STATEMENT ANALYSIS
There are some ratios which can be used to analyse the short term and long term solvency
and liquidity of the business. In the above table the short term liquidity ratios have been
presented. It can be observed that throughout the last three year the current ratio of the
organisation were much below the standard benchmark of current ratio. Even it falls from 0.65:1
in the year 2016 to 0.24:1 in the year 2018. It means, in terms of liquidity the business is having
a poor sign. The quick ratio, which is the measure of capacity of meeting current liabilities is
also having the same trend and in the year 2018 it comes to 0.19:1 from 0.52:1 in the year 2017.
Therefore, they need to manage their current resources and liabilities to maintain a good short-
term liquidity. Following graph can show the liquidity of the business in a bar chart.
2016 2017 2018
0.00
0.10
0.20
0.30
0.40
0.50
0.60
0.70
Current Ratio
Quick Ratio
The above graph clearly shows and compares the decreasing trend and downfall in the
liquidity and short-term solvency of the company.
Solvency Ratios 2016 2017 2018
Total Debt Ratio 72.3% 74.0% 74.9%
Debt to Equity Ratio 2.60 2.84 2.98
Interest Coverage Ratio 2.69 2.89 2.22
tabler-icon-diamond-filled.svg

Paraphrase This Document

Need a fresh take? Get an instant paraphrase of this document with our AI Paraphraser
Document Page
7FINANCIAL STATEMENT ANALYSIS
In the above some ratios have been calculated and presented to show the long term
solvency of the business. It can be seen from the above table that, they are having a total debt
ratio of 72.3 percent in the year 2016. It implies 72.3 percent of their assets are financed by the
debt capital. Their business is highly leveraged and taking a huge risk in financing their long-
term assets. It can also be observed that, the total debt ratio have increased significantly in the
year 2018 and it reaches to almost 75 percent in the year 2018. The debt to equity ratio shows the
amount of total debt capital as a percentage of total equity. It can be observed that the total debt
is almost 2.5 times on an average of the total equity for the analysed three years. It again proves
the use of high leverage in financing the capital needs of the organisation. In the following graph
it can easily be shown comparatively (Nobes, 2014).
2016 2017 2018
0.0%
50.0%
100.0%
150.0%
200.0%
250.0%
300.0%
350.0%
Total Debt Ratio
Debt to Equity Ratio
Interest Coverage Ratio
It can also be observed that, the interest coverage ratio is stable and efficient enough to
pay off the increased interest burden of the business. It is also having a decreasing trend and
overall solvency is having a down trend for the three years starting from 2016 to 2018.
Document Page
8FINANCIAL STATEMENT ANALYSIS
Conclusion:
Based on the above discussion it can be concluded that, though the company is having a
high profitability and sustainability, there is a downfall in the financial performance and
solvency of the business. The profitability in terms of gross profit margin and net margin has
remained same except the effect increased interest burden in the year 2018. In terms of solvency
and liquidity, the organisation is showing a poor sign.
Recommendations:
After observing their financial and operational performance and position, it can be
recommended for the management that, they need to manage their current assets more efficiently
to increase their liquidity, they need to improve their cash collection system from the customers.
They also need to restructure their capital mix to have a good leveraged benefit in the welth
maximisation objective of the business.
Document Page
9FINANCIAL STATEMENT ANALYSIS
References and bibliography:
Coates IV, J. C. (2014). Cost-benefit analysis of financial regulation: Case studies and
implications. Yale LJ, 124, 882.
Crowther, D. (2018). A Social Critique of Corporate Reporting: A Semiotic Analysis of
Corporate Financial and Environmental Reporting: A Semiotic Analysis of Corporate
Financial and Environmental Reporting. Routledge.
Easton, M., & Sommers, Z. (2018). Financial Statement Analysis & Valuation, 5e.
Grant, R. M. (2016). Contemporary strategy analysis: Text and cases edition. John Wiley &
Sons.
Lin, C. C., Chiu, A. A., Huang, S. Y., & Yen, D. C. (2015). Detecting the financial statement
fraud: The analysis of the differences between data mining techniques and experts’
judgments. Knowledge-Based Systems, 89, 459-470.
Nobes, C. (2014). International classification of financial reporting. Routledge.
Palepu, K. G., Healy, P. M., & Peek, E. (2013). Business analysis and valuation: IFRS edition.
Cengage learning.
Robinson, T. R., Henry, E., Pirie, W. L., & Broihahn, M. A. (2015). International financial
statement analysis. John Wiley & Sons.
chevron_up_icon
1 out of 10
circle_padding
hide_on_mobile
zoom_out_icon
[object Object]