Financial Statement Analysis: Firm Performance and Ratios
VerifiedAdded on 2022/10/17
|9
|2260
|17
Report
AI Summary
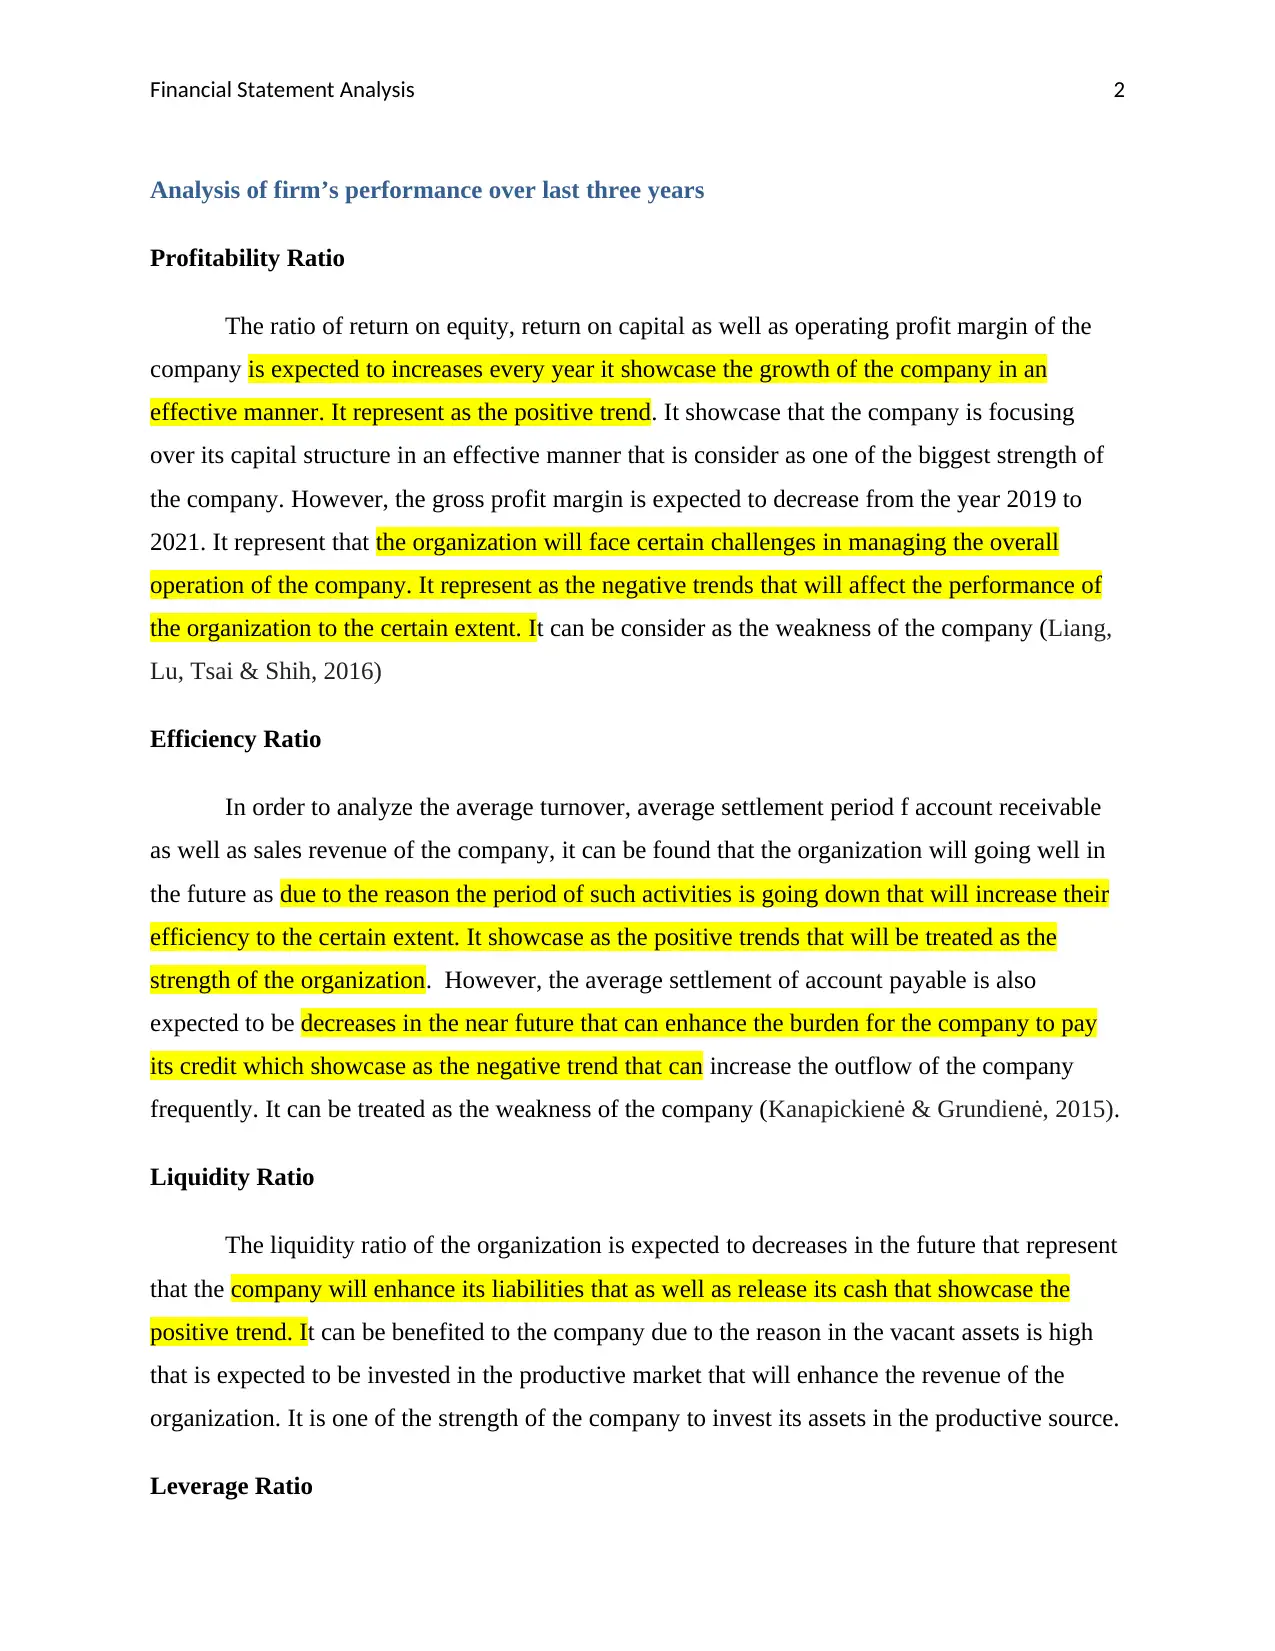
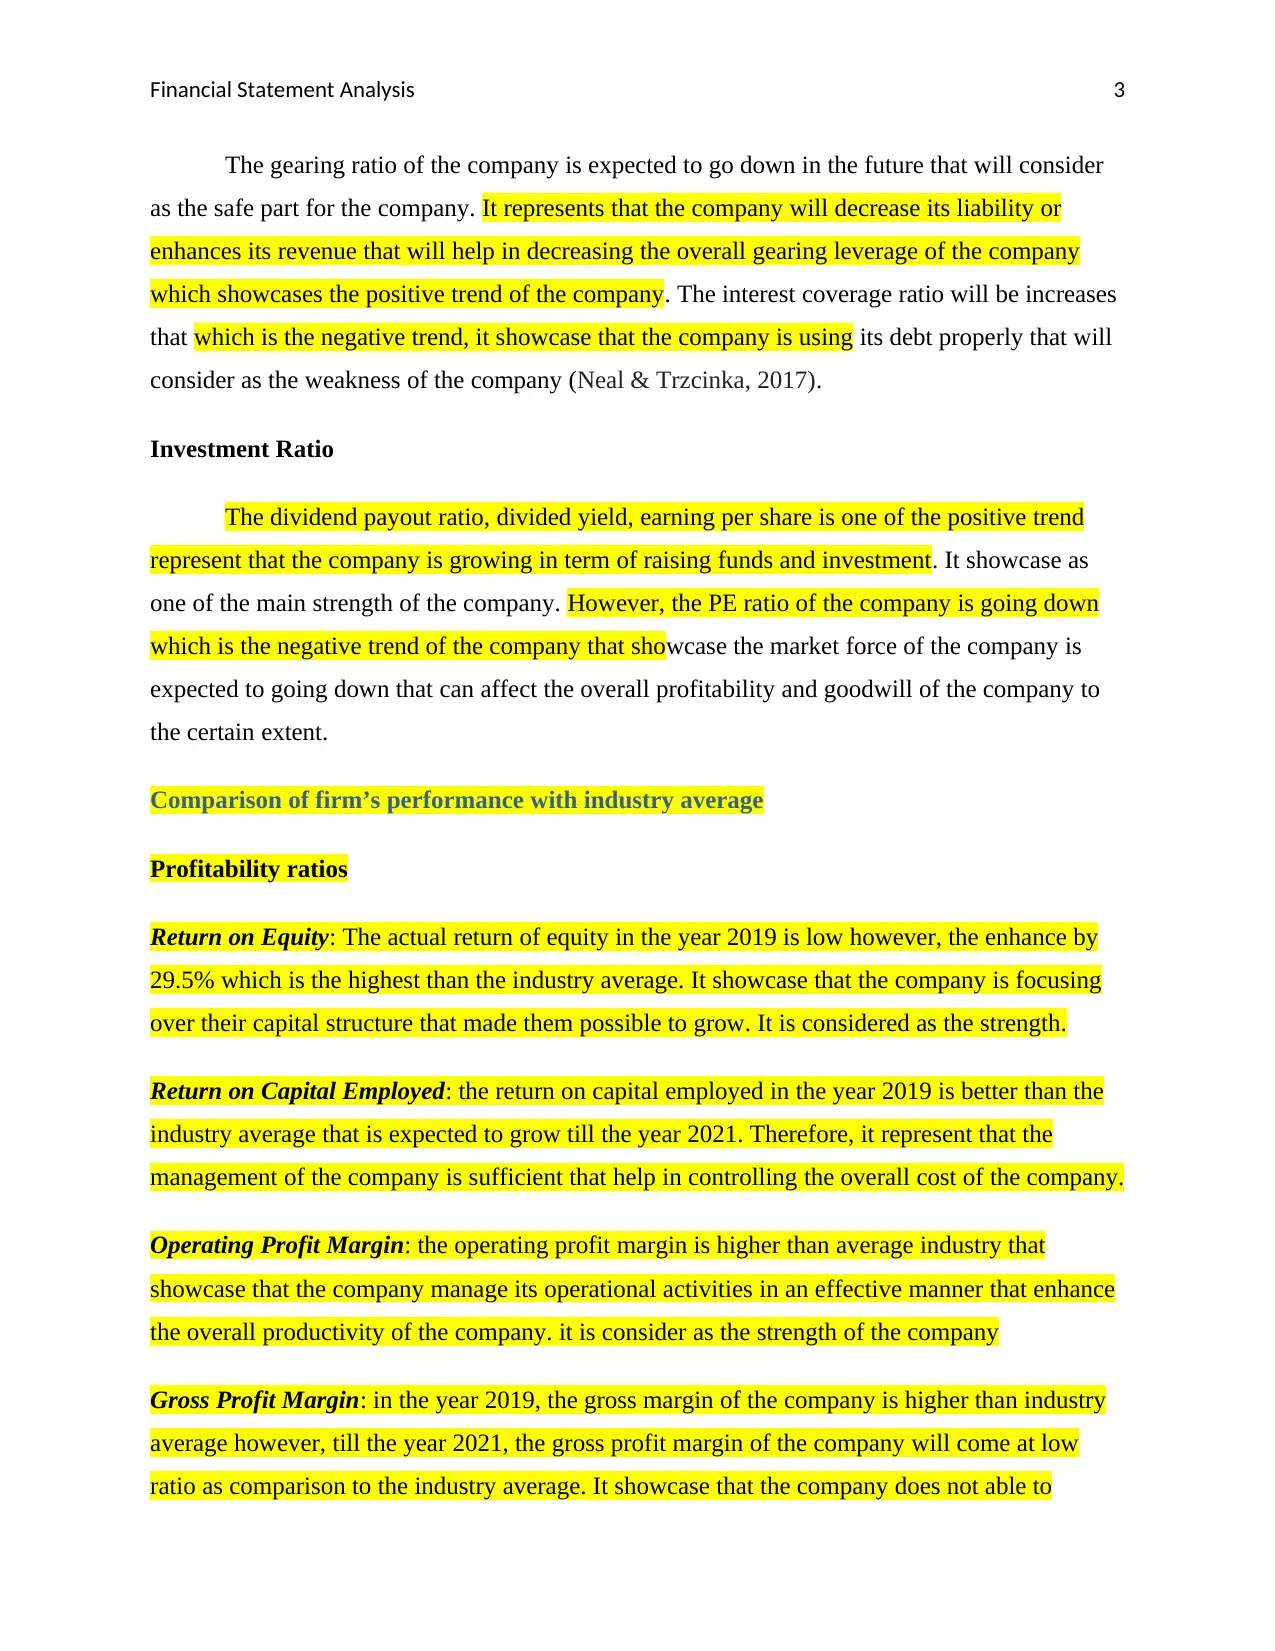
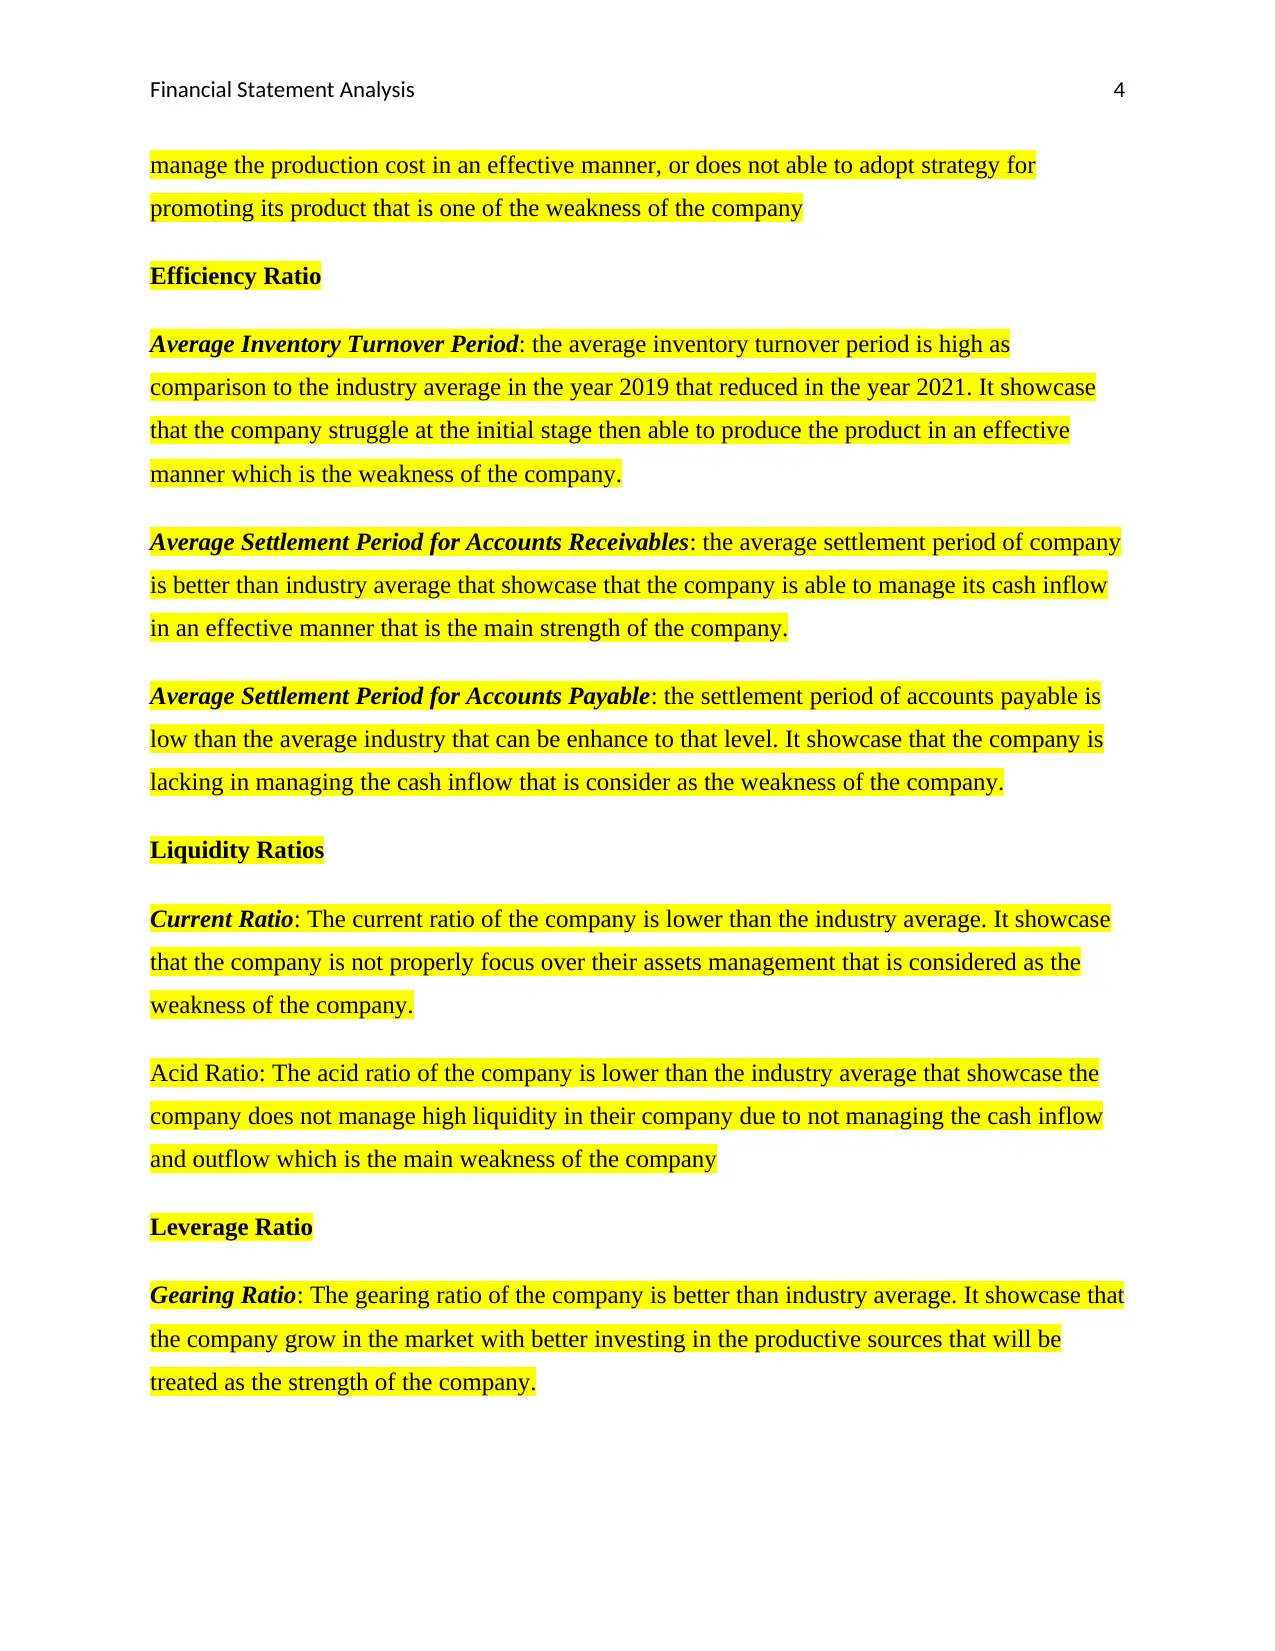
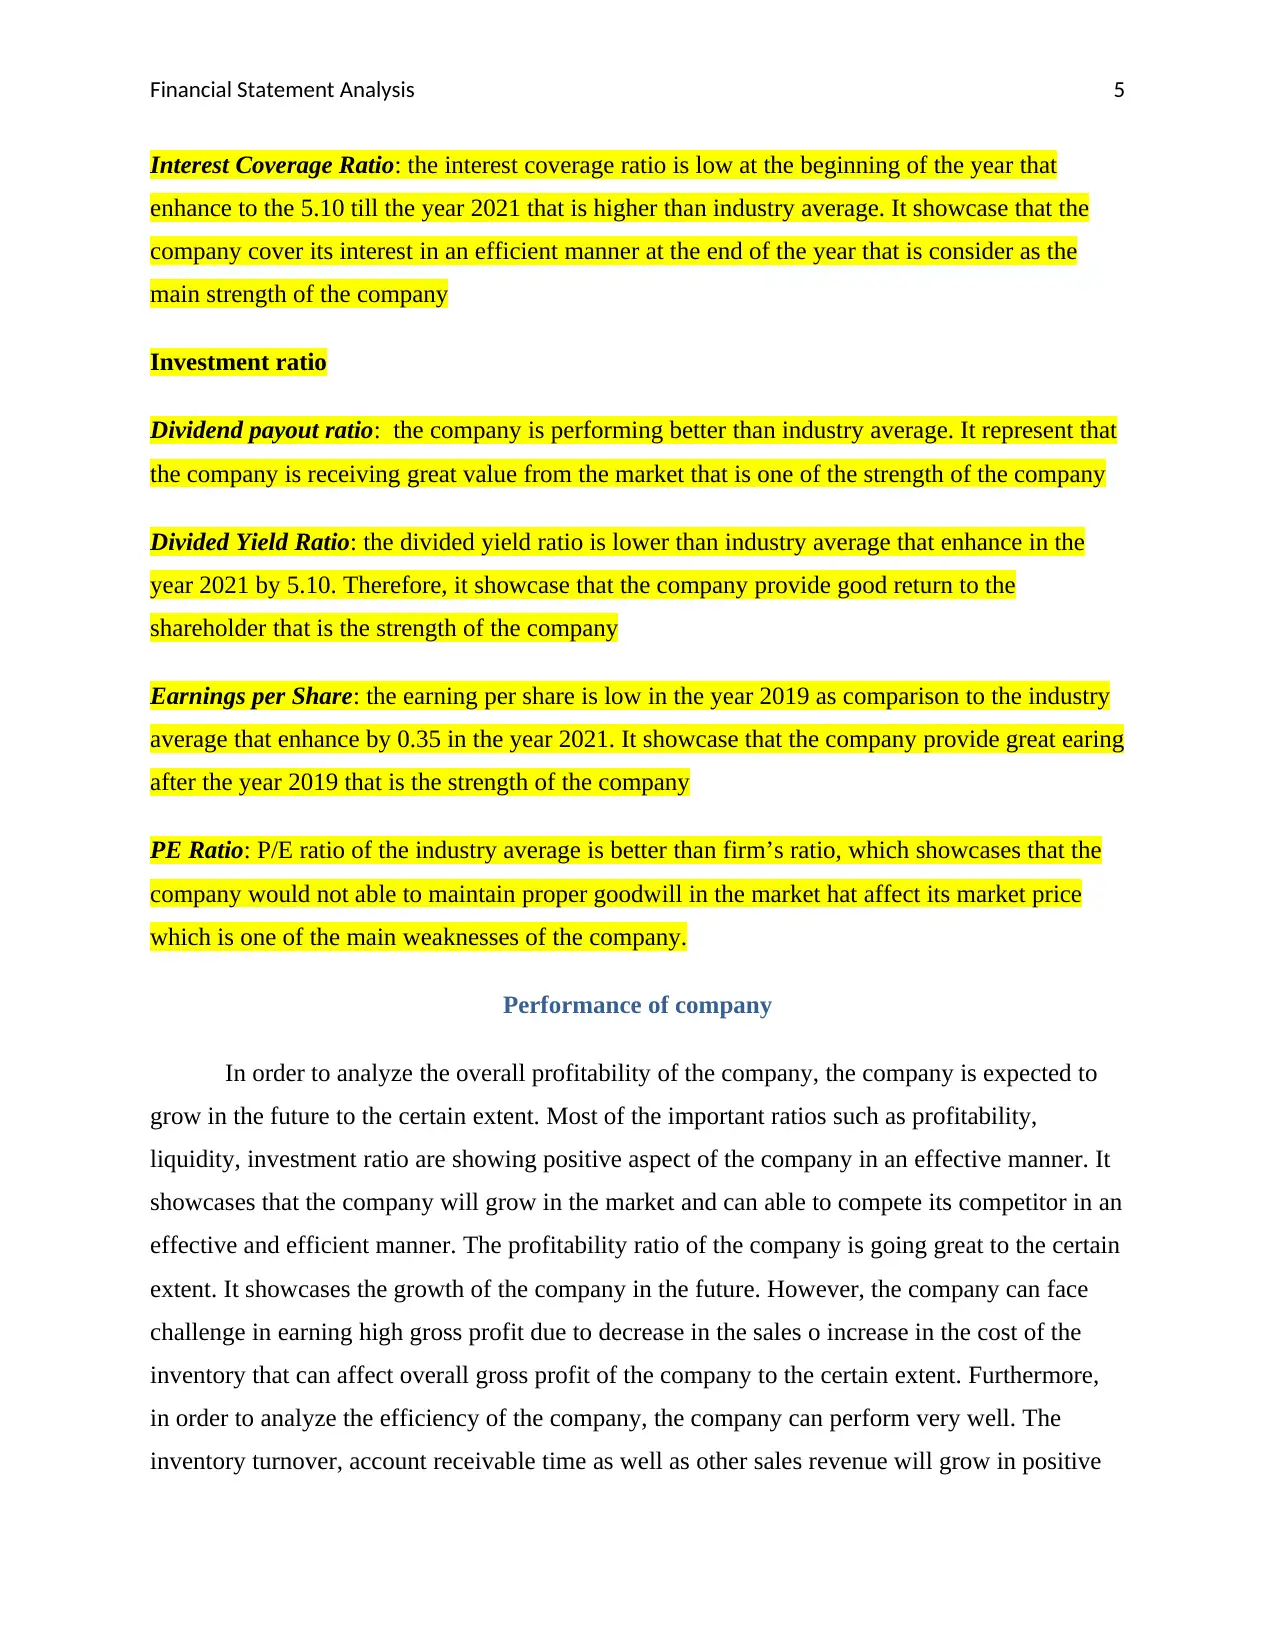
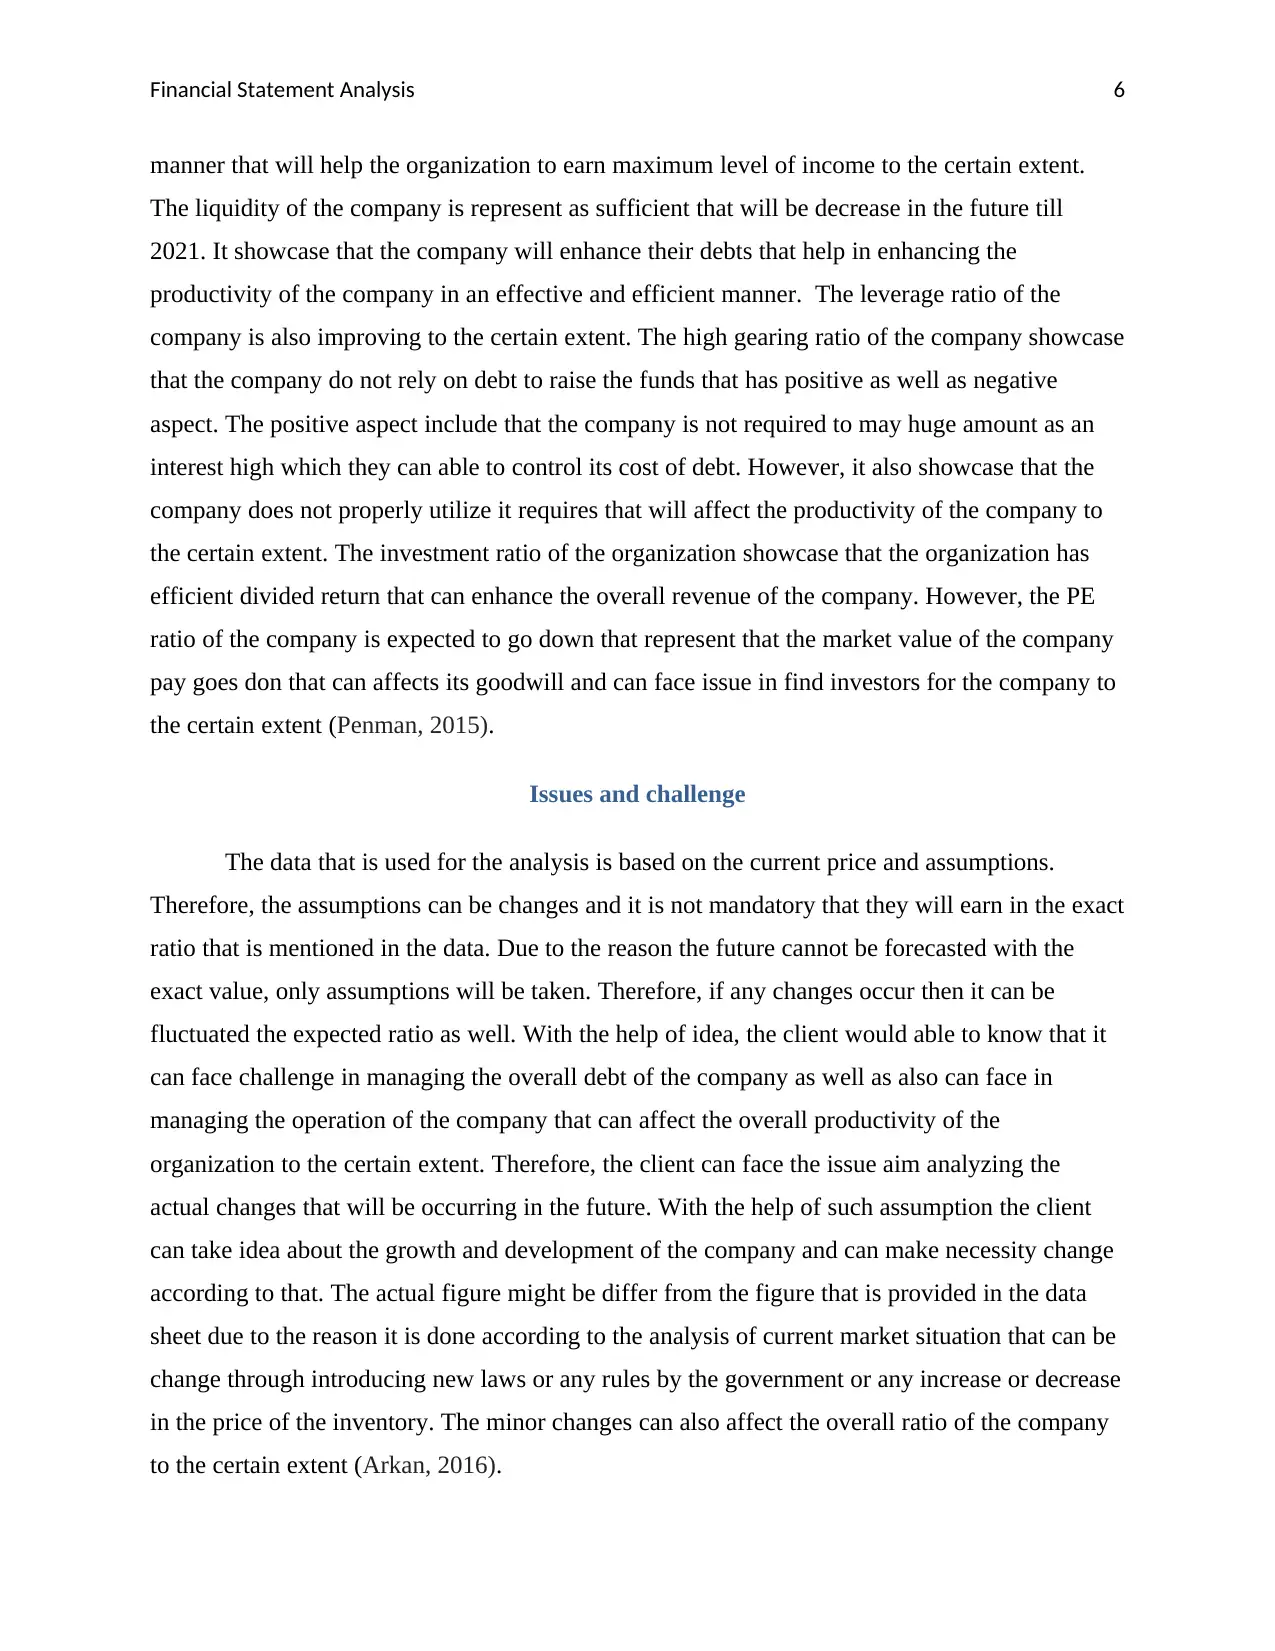
This report presents a comprehensive financial statement analysis of a company's performance over a three-year period. The analysis encompasses a detailed examination of profitability, efficiency, liquidity, leverage, and investment ratios, identifying both positive and negative trends. The report compares the firm's performance to industry averages, highlighting strengths and weaknesses in each ratio category. The company demonstrates positive trends in profitability, efficiency, and investment ratios, with potential challenges in managing gross profit margin and inventory turnover. The analysis also addresses the company's liquidity and leverage positions, indicating areas for improvement. The report concludes with a discussion of potential issues and challenges associated with the analysis, such as reliance on assumptions and the impact of external factors. It emphasizes the importance of considering these limitations when interpreting the findings and making informed decisions. The report provides a valuable assessment of the company's financial health and prospects.

Running Head: Financial Statement Analysis 0
Financial Statement Analysis
(Student Name)
Financial Statement Analysis
(Student Name)
Secure Best Marks with AI Grader
Need help grading? Try our AI Grader for instant feedback on your assignments.

Financial Statement Analysis 1
Table of Contents
Analysis of firm’s performance over last three years......................................................................2
Comparison of firm’s performance with industry average..............................................................3
Performance of company.................................................................................................................3
Issues and challenge........................................................................................................................4
References........................................................................................................................................5

Financial Statement Analysis 2
Analysis of firm’s performance over last three years
Profitability Ratio
The ratio of return on equity, return on capital as well as operating profit margin of the
company is expected to increases every year it showcase the growth of the company in an
effective manner. It represent as the positive trend. It showcase that the company is focusing
over its capital structure in an effective manner that is consider as one of the biggest strength of
the company. However, the gross profit margin is expected to decrease from the year 2019 to
2021. It represent that the organization will face certain challenges in managing the overall
operation of the company. It represent as the negative trends that will affect the performance of
the organization to the certain extent. It can be consider as the weakness of the company (Liang,
Lu, Tsai & Shih, 2016)
Efficiency Ratio
In order to analyze the average turnover, average settlement period f account receivable
as well as sales revenue of the company, it can be found that the organization will going well in
the future as due to the reason the period of such activities is going down that will increase their
efficiency to the certain extent. It showcase as the positive trends that will be treated as the
strength of the organization. However, the average settlement of account payable is also
expected to be decreases in the near future that can enhance the burden for the company to pay
its credit which showcase as the negative trend that can increase the outflow of the company
frequently. It can be treated as the weakness of the company (Kanapickienė & Grundienė, 2015).
Liquidity Ratio
The liquidity ratio of the organization is expected to decreases in the future that represent
that the company will enhance its liabilities that as well as release its cash that showcase the
positive trend. It can be benefited to the company due to the reason in the vacant assets is high
that is expected to be invested in the productive market that will enhance the revenue of the
organization. It is one of the strength of the company to invest its assets in the productive source.
Leverage Ratio

Financial Statement Analysis 3
The gearing ratio of the company is expected to go down in the future that will consider
as the safe part for the company. It represents that the company will decrease its liability or
enhances its revenue that will help in decreasing the overall gearing leverage of the company
which showcases the positive trend of the company. The interest coverage ratio will be increases
that which is the negative trend, it showcase that the company is using its debt properly that will
consider as the weakness of the company (Neal & Trzcinka, 2017).
Investment Ratio
The dividend payout ratio, divided yield, earning per share is one of the positive trend
represent that the company is growing in term of raising funds and investment. It showcase as
one of the main strength of the company. However, the PE ratio of the company is going down
which is the negative trend of the company that showcase the market force of the company is
expected to going down that can affect the overall profitability and goodwill of the company to
the certain extent.
Comparison of firm’s performance with industry average
Profitability ratios
Return on Equity: The actual return of equity in the year 2019 is low however, the enhance by
29.5% which is the highest than the industry average. It showcase that the company is focusing
over their capital structure that made them possible to grow. It is considered as the strength.
Return on Capital Employed: the return on capital employed in the year 2019 is better than the
industry average that is expected to grow till the year 2021. Therefore, it represent that the
management of the company is sufficient that help in controlling the overall cost of the company.
Operating Profit Margin: the operating profit margin is higher than average industry that
showcase that the company manage its operational activities in an effective manner that enhance
the overall productivity of the company. it is consider as the strength of the company
Gross Profit Margin: in the year 2019, the gross margin of the company is higher than industry
average however, till the year 2021, the gross profit margin of the company will come at low
ratio as comparison to the industry average. It showcase that the company does not able to
Secure Best Marks with AI Grader
Need help grading? Try our AI Grader for instant feedback on your assignments.

Financial Statement Analysis 4
manage the production cost in an effective manner, or does not able to adopt strategy for
promoting its product that is one of the weakness of the company
Efficiency Ratio
Average Inventory Turnover Period: the average inventory turnover period is high as
comparison to the industry average in the year 2019 that reduced in the year 2021. It showcase
that the company struggle at the initial stage then able to produce the product in an effective
manner which is the weakness of the company.
Average Settlement Period for Accounts Receivables: the average settlement period of company
is better than industry average that showcase that the company is able to manage its cash inflow
in an effective manner that is the main strength of the company.
Average Settlement Period for Accounts Payable: the settlement period of accounts payable is
low than the average industry that can be enhance to that level. It showcase that the company is
lacking in managing the cash inflow that is consider as the weakness of the company.
Liquidity Ratios
Current Ratio: The current ratio of the company is lower than the industry average. It showcase
that the company is not properly focus over their assets management that is considered as the
weakness of the company.
Acid Ratio: The acid ratio of the company is lower than the industry average that showcase the
company does not manage high liquidity in their company due to not managing the cash inflow
and outflow which is the main weakness of the company
Leverage Ratio
Gearing Ratio: The gearing ratio of the company is better than industry average. It showcase that
the company grow in the market with better investing in the productive sources that will be
treated as the strength of the company.

Financial Statement Analysis 5
Interest Coverage Ratio: the interest coverage ratio is low at the beginning of the year that
enhance to the 5.10 till the year 2021 that is higher than industry average. It showcase that the
company cover its interest in an efficient manner at the end of the year that is consider as the
main strength of the company
Investment ratio
Dividend payout ratio: the company is performing better than industry average. It represent that
the company is receiving great value from the market that is one of the strength of the company
Divided Yield Ratio: the divided yield ratio is lower than industry average that enhance in the
year 2021 by 5.10. Therefore, it showcase that the company provide good return to the
shareholder that is the strength of the company
Earnings per Share: the earning per share is low in the year 2019 as comparison to the industry
average that enhance by 0.35 in the year 2021. It showcase that the company provide great earing
after the year 2019 that is the strength of the company
PE Ratio: P/E ratio of the industry average is better than firm’s ratio, which showcases that the
company would not able to maintain proper goodwill in the market hat affect its market price
which is one of the main weaknesses of the company.
Performance of company
In order to analyze the overall profitability of the company, the company is expected to
grow in the future to the certain extent. Most of the important ratios such as profitability,
liquidity, investment ratio are showing positive aspect of the company in an effective manner. It
showcases that the company will grow in the market and can able to compete its competitor in an
effective and efficient manner. The profitability ratio of the company is going great to the certain
extent. It showcases the growth of the company in the future. However, the company can face
challenge in earning high gross profit due to decrease in the sales o increase in the cost of the
inventory that can affect overall gross profit of the company to the certain extent. Furthermore,
in order to analyze the efficiency of the company, the company can perform very well. The
inventory turnover, account receivable time as well as other sales revenue will grow in positive

Financial Statement Analysis 6
manner that will help the organization to earn maximum level of income to the certain extent.
The liquidity of the company is represent as sufficient that will be decrease in the future till
2021. It showcase that the company will enhance their debts that help in enhancing the
productivity of the company in an effective and efficient manner. The leverage ratio of the
company is also improving to the certain extent. The high gearing ratio of the company showcase
that the company do not rely on debt to raise the funds that has positive as well as negative
aspect. The positive aspect include that the company is not required to may huge amount as an
interest high which they can able to control its cost of debt. However, it also showcase that the
company does not properly utilize it requires that will affect the productivity of the company to
the certain extent. The investment ratio of the organization showcase that the organization has
efficient divided return that can enhance the overall revenue of the company. However, the PE
ratio of the company is expected to go down that represent that the market value of the company
pay goes don that can affects its goodwill and can face issue in find investors for the company to
the certain extent (Penman, 2015).
Issues and challenge
The data that is used for the analysis is based on the current price and assumptions.
Therefore, the assumptions can be changes and it is not mandatory that they will earn in the exact
ratio that is mentioned in the data. Due to the reason the future cannot be forecasted with the
exact value, only assumptions will be taken. Therefore, if any changes occur then it can be
fluctuated the expected ratio as well. With the help of idea, the client would able to know that it
can face challenge in managing the overall debt of the company as well as also can face in
managing the operation of the company that can affect the overall productivity of the
organization to the certain extent. Therefore, the client can face the issue aim analyzing the
actual changes that will be occurring in the future. With the help of such assumption the client
can take idea about the growth and development of the company and can make necessity change
according to that. The actual figure might be differ from the figure that is provided in the data
sheet due to the reason it is done according to the analysis of current market situation that can be
change through introducing new laws or any rules by the government or any increase or decrease
in the price of the inventory. The minor changes can also affect the overall ratio of the company
to the certain extent (Arkan, 2016).
Paraphrase This Document
Need a fresh take? Get an instant paraphrase of this document with our AI Paraphraser

Financial Statement Analysis 7

Financial Statement Analysis 8
References
Arkan, T. (2016). The importance of financial ratios in predicting stock price trends: A case
study in emerging markets. Finanse, Rynki Finansowe, Ubezpieczenia, 79(1), 13-26.
Kanapickienė, R., & Grundienė, Ž. (2015). The model of fraud detection in financial statements
by means of financial ratios. Procedia-Social and Behavioral Sciences, 213, 321-327.
Liang, D., Lu, C. C., Tsai, C. F., & Shih, G. A. (2016). Financial ratios and corporate governance
indicators in bankruptcy prediction: A comprehensive study. European Journal of
Operational Research, 252(2), 561-572.
Neal, R. S., & Trzcinka, C. (2017). Financial markets 2018: P/E ratios are great again. Indiana
Business Review, 92(4), 1-4.
Penman, S. H. (2015). Financial Ratios and Equity Valuation. Wiley Encyclopedia of
Management, 1-7.
1 out of 9
Related Documents

Your All-in-One AI-Powered Toolkit for Academic Success.
+13062052269
info@desklib.com
Available 24*7 on WhatsApp / Email
Unlock your academic potential
© 2024 | Zucol Services PVT LTD | All rights reserved.