Analysis of Financial Statements, Ratios, and Investment Appraisal
VerifiedAdded on 2023/06/04
|18
|3778
|433
Report
AI Summary
This report provides a detailed analysis of financial statements, including the calculation and interpretation of various financial ratios such as gross profit ratio, asset usage ratio, current ratio, acid test ratio, inventory holding period, and debt-equity ratio. The report further explores the importance of financial statement analysis for organizations, investors, and government bodies. It includes a cash budget forecast for six months, along with explanations of additional expenditures and strategies to improve financial performance. The report also covers break-even point calculations, margin of safety analysis, and a discussion of a new business strategy. Additionally, it provides a calculation of payback period, net present value, and average rate of return for different investment appraisal scenarios, concluding with a critical analysis of the investment appraisal techniques.

Finance
Paraphrase This Document
Need a fresh take? Get an instant paraphrase of this document with our AI Paraphraser

Table of Contents
INTRODUCTION...........................................................................................................................3
QUESTION 1...................................................................................................................................3
1. Calculations of financial ratios are as follows:.......................................................................3
2. Importance of financial statement analysis:............................................................................5
QUESTION 2...................................................................................................................................5
1. Opening statement of financial position at the start of July 2015:..........................................5
2. Computation of forecast cash budget for next 6 months.........................................................6
3. Explanation of additional expenditures:..................................................................................7
QUESTION 3...................................................................................................................................7
1. Calculation of break-even point..............................................................................................7
2. Calculation of Margin of safety for the year ended 2019 and 2020:......................................8
3.Discussion of the new strategy that has been formed by Jessica.............................................9
(a) calculation of payback period, Net present value and average rate of return:.......................9
Discuss the best method of appraisal technique........................................................................12
Critical Analysis of Investment Appraisal Techniques:............................................................12
CONCLUSION .............................................................................................................................14
REFERENCES..............................................................................................................................15
⊘ This is a preview!⊘
Do you want full access?
Subscribe today to unlock all pages.
Trusted by 1+ million students worldwide
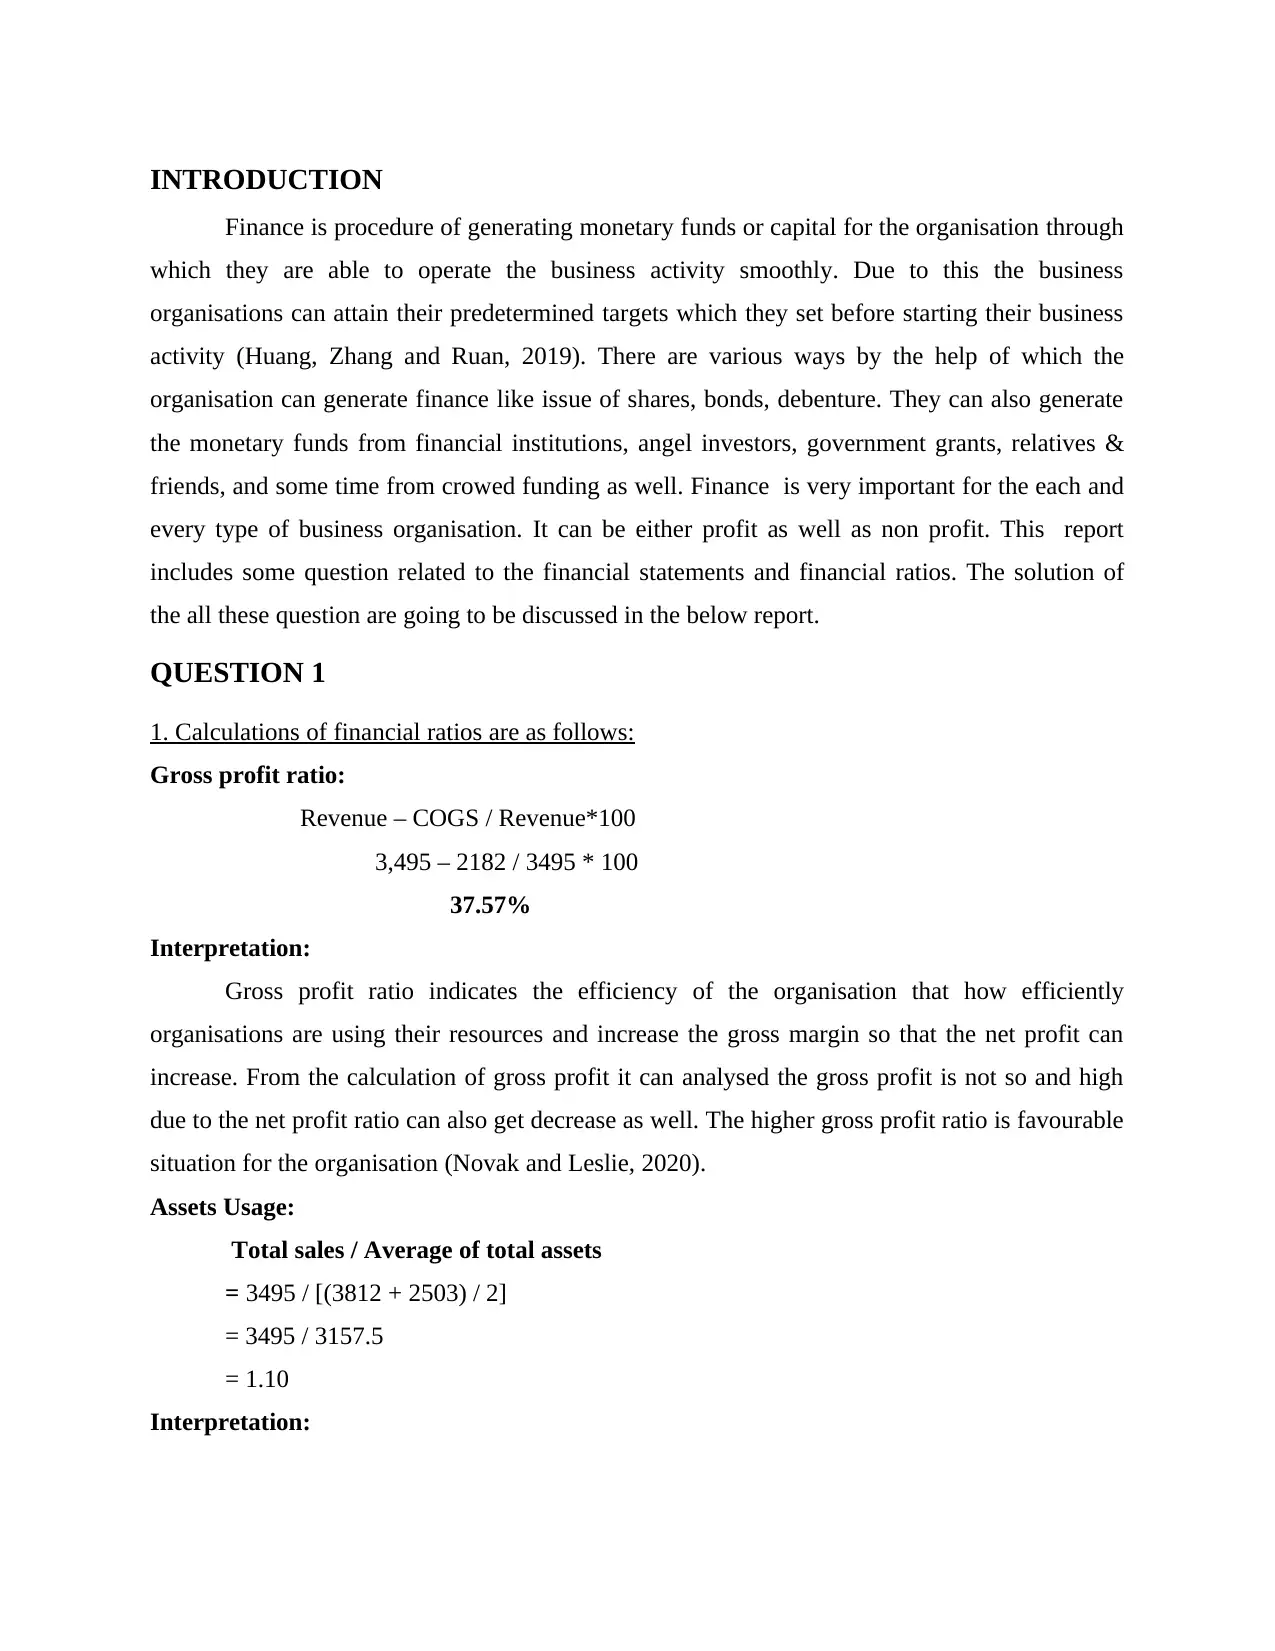
INTRODUCTION
Finance is procedure of generating monetary funds or capital for the organisation through
which they are able to operate the business activity smoothly. Due to this the business
organisations can attain their predetermined targets which they set before starting their business
activity (Huang, Zhang and Ruan, 2019). There are various ways by the help of which the
organisation can generate finance like issue of shares, bonds, debenture. They can also generate
the monetary funds from financial institutions, angel investors, government grants, relatives &
friends, and some time from crowed funding as well. Finance is very important for the each and
every type of business organisation. It can be either profit as well as non profit. This report
includes some question related to the financial statements and financial ratios. The solution of
the all these question are going to be discussed in the below report.
QUESTION 1
1. Calculations of financial ratios are as follows:
Gross profit ratio:
Revenue – COGS / Revenue*100
3,495 – 2182 / 3495 * 100
37.57%
Interpretation:
Gross profit ratio indicates the efficiency of the organisation that how efficiently
organisations are using their resources and increase the gross margin so that the net profit can
increase. From the calculation of gross profit it can analysed the gross profit is not so and high
due to the net profit ratio can also get decrease as well. The higher gross profit ratio is favourable
situation for the organisation (Novak and Leslie, 2020).
Assets Usage:
Total sales / Average of total assets
= 3495 / [(3812 + 2503) / 2]
= 3495 / 3157.5
= 1.10
Interpretation:
Paraphrase This Document
Need a fresh take? Get an instant paraphrase of this document with our AI Paraphraser
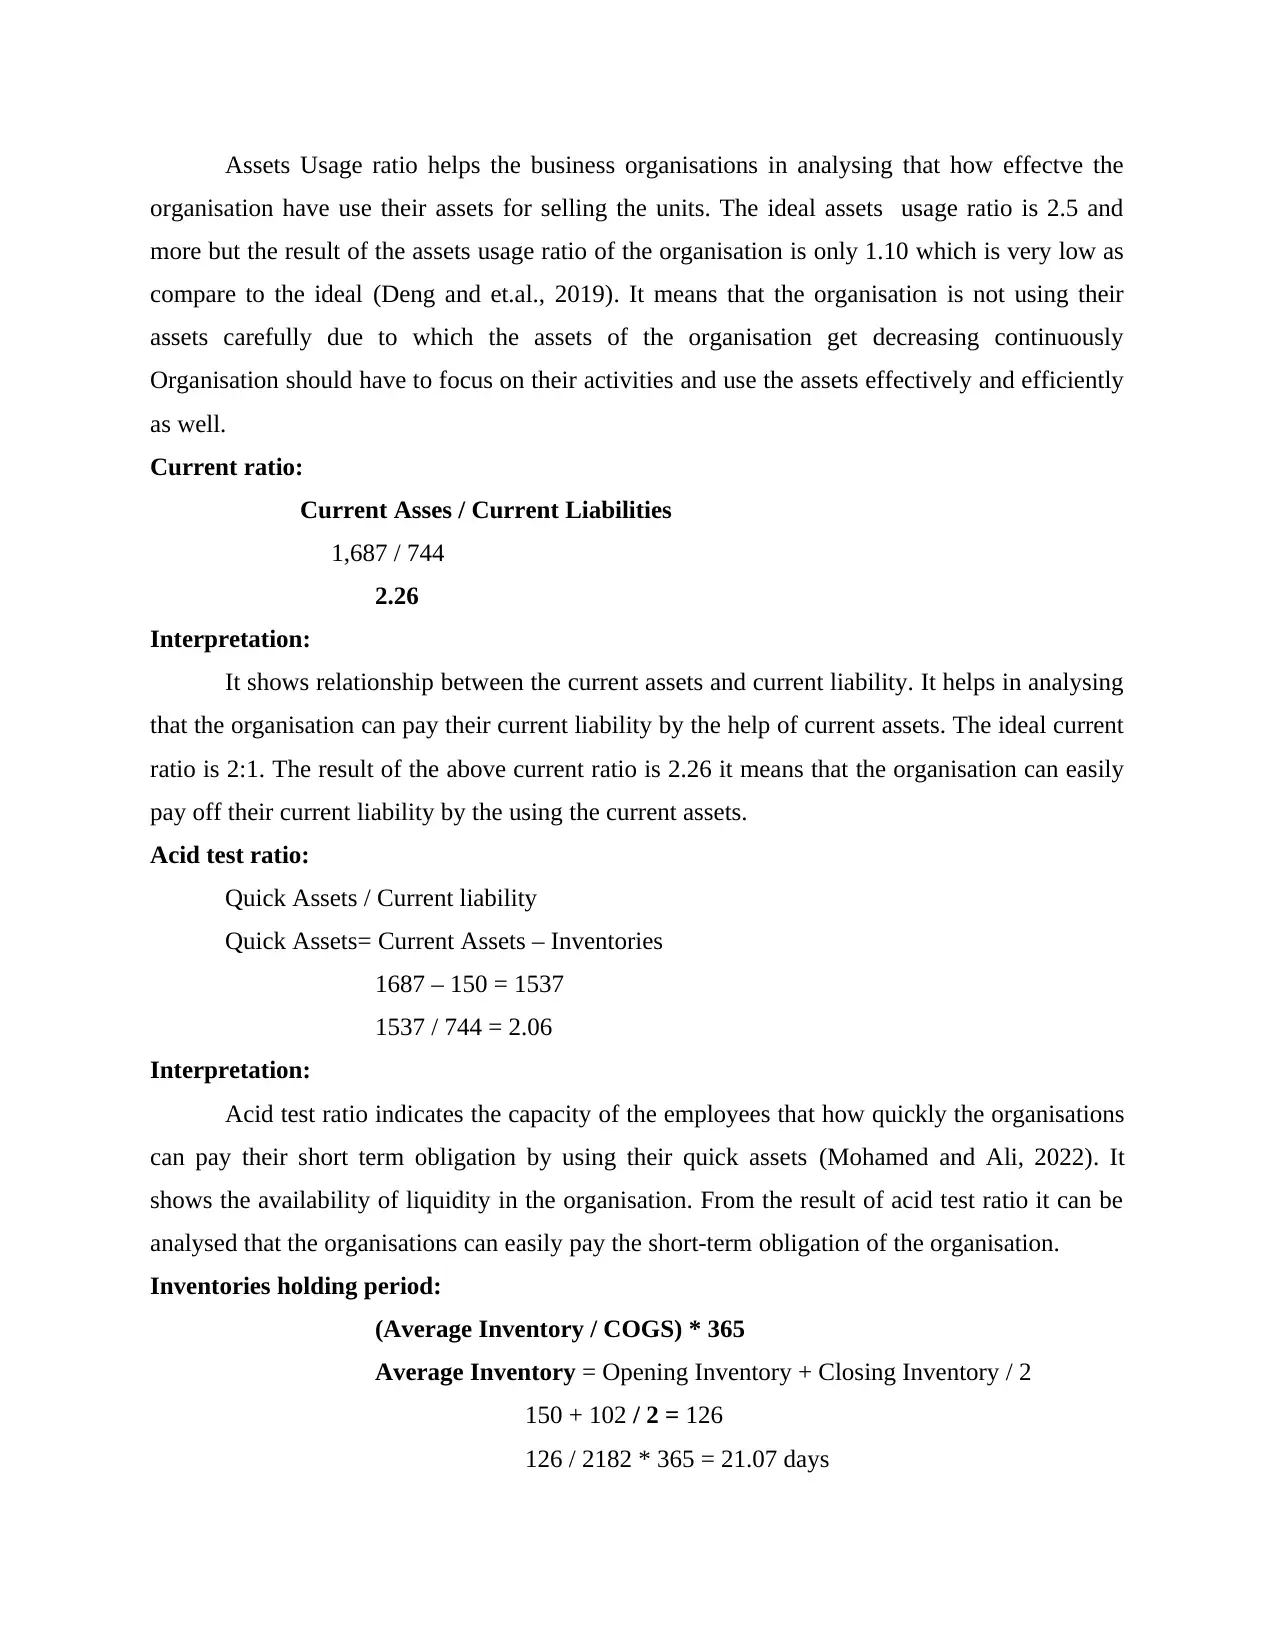
Assets Usage ratio helps the business organisations in analysing that how effectve the
organisation have use their assets for selling the units. The ideal assets usage ratio is 2.5 and
more but the result of the assets usage ratio of the organisation is only 1.10 which is very low as
compare to the ideal (Deng and et.al., 2019). It means that the organisation is not using their
assets carefully due to which the assets of the organisation get decreasing continuously
Organisation should have to focus on their activities and use the assets effectively and efficiently
as well.
Current ratio:
Current Asses / Current Liabilities
1,687 / 744
2.26
Interpretation:
It shows relationship between the current assets and current liability. It helps in analysing
that the organisation can pay their current liability by the help of current assets. The ideal current
ratio is 2:1. The result of the above current ratio is 2.26 it means that the organisation can easily
pay off their current liability by the using the current assets.
Acid test ratio:
Quick Assets / Current liability
Quick Assets= Current Assets – Inventories
1687 – 150 = 1537
1537 / 744 = 2.06
Interpretation:
Acid test ratio indicates the capacity of the employees that how quickly the organisations
can pay their short term obligation by using their quick assets (Mohamed and Ali, 2022). It
shows the availability of liquidity in the organisation. From the result of acid test ratio it can be
analysed that the organisations can easily pay the short-term obligation of the organisation.
Inventories holding period:
(Average Inventory / COGS) * 365
Average Inventory = Opening Inventory + Closing Inventory / 2
150 + 102 / 2 = 126
126 / 2182 * 365 = 21.07 days
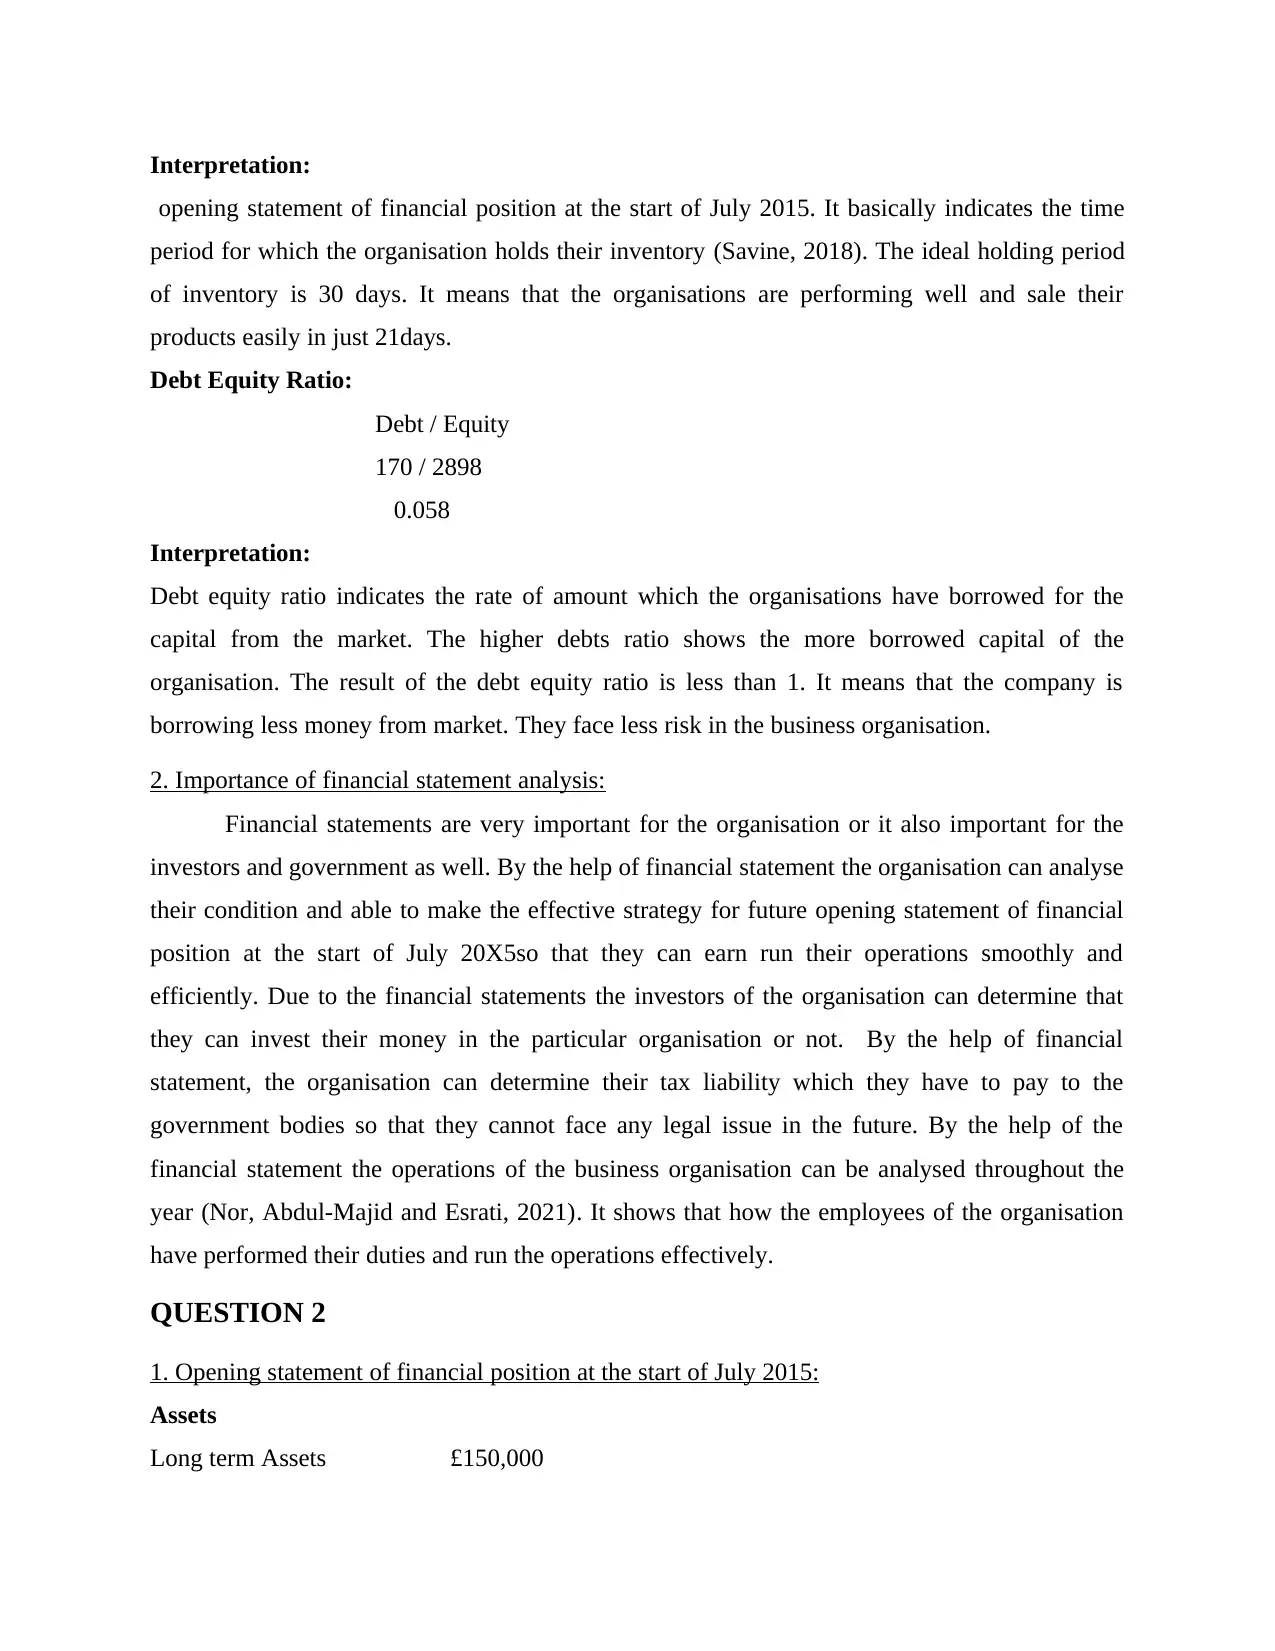
Interpretation:
opening statement of financial position at the start of July 2015. It basically indicates the time
period for which the organisation holds their inventory (Savine, 2018). The ideal holding period
of inventory is 30 days. It means that the organisations are performing well and sale their
products easily in just 21days.
Debt Equity Ratio:
Debt / Equity
170 / 2898
0.058
Interpretation:
Debt equity ratio indicates the rate of amount which the organisations have borrowed for the
capital from the market. The higher debts ratio shows the more borrowed capital of the
organisation. The result of the debt equity ratio is less than 1. It means that the company is
borrowing less money from market. They face less risk in the business organisation.
2. Importance of financial statement analysis:
Financial statements are very important for the organisation or it also important for the
investors and government as well. By the help of financial statement the organisation can analyse
their condition and able to make the effective strategy for future opening statement of financial
position at the start of July 20X5so that they can earn run their operations smoothly and
efficiently. Due to the financial statements the investors of the organisation can determine that
they can invest their money in the particular organisation or not. By the help of financial
statement, the organisation can determine their tax liability which they have to pay to the
government bodies so that they cannot face any legal issue in the future. By the help of the
financial statement the operations of the business organisation can be analysed throughout the
year (Nor, Abdul-Majid and Esrati, 2021). It shows that how the employees of the organisation
have performed their duties and run the operations effectively.
QUESTION 2
1. Opening statement of financial position at the start of July 2015:
Assets
Long term Assets £150,000
⊘ This is a preview!⊘
Do you want full access?
Subscribe today to unlock all pages.
Trusted by 1+ million students worldwide
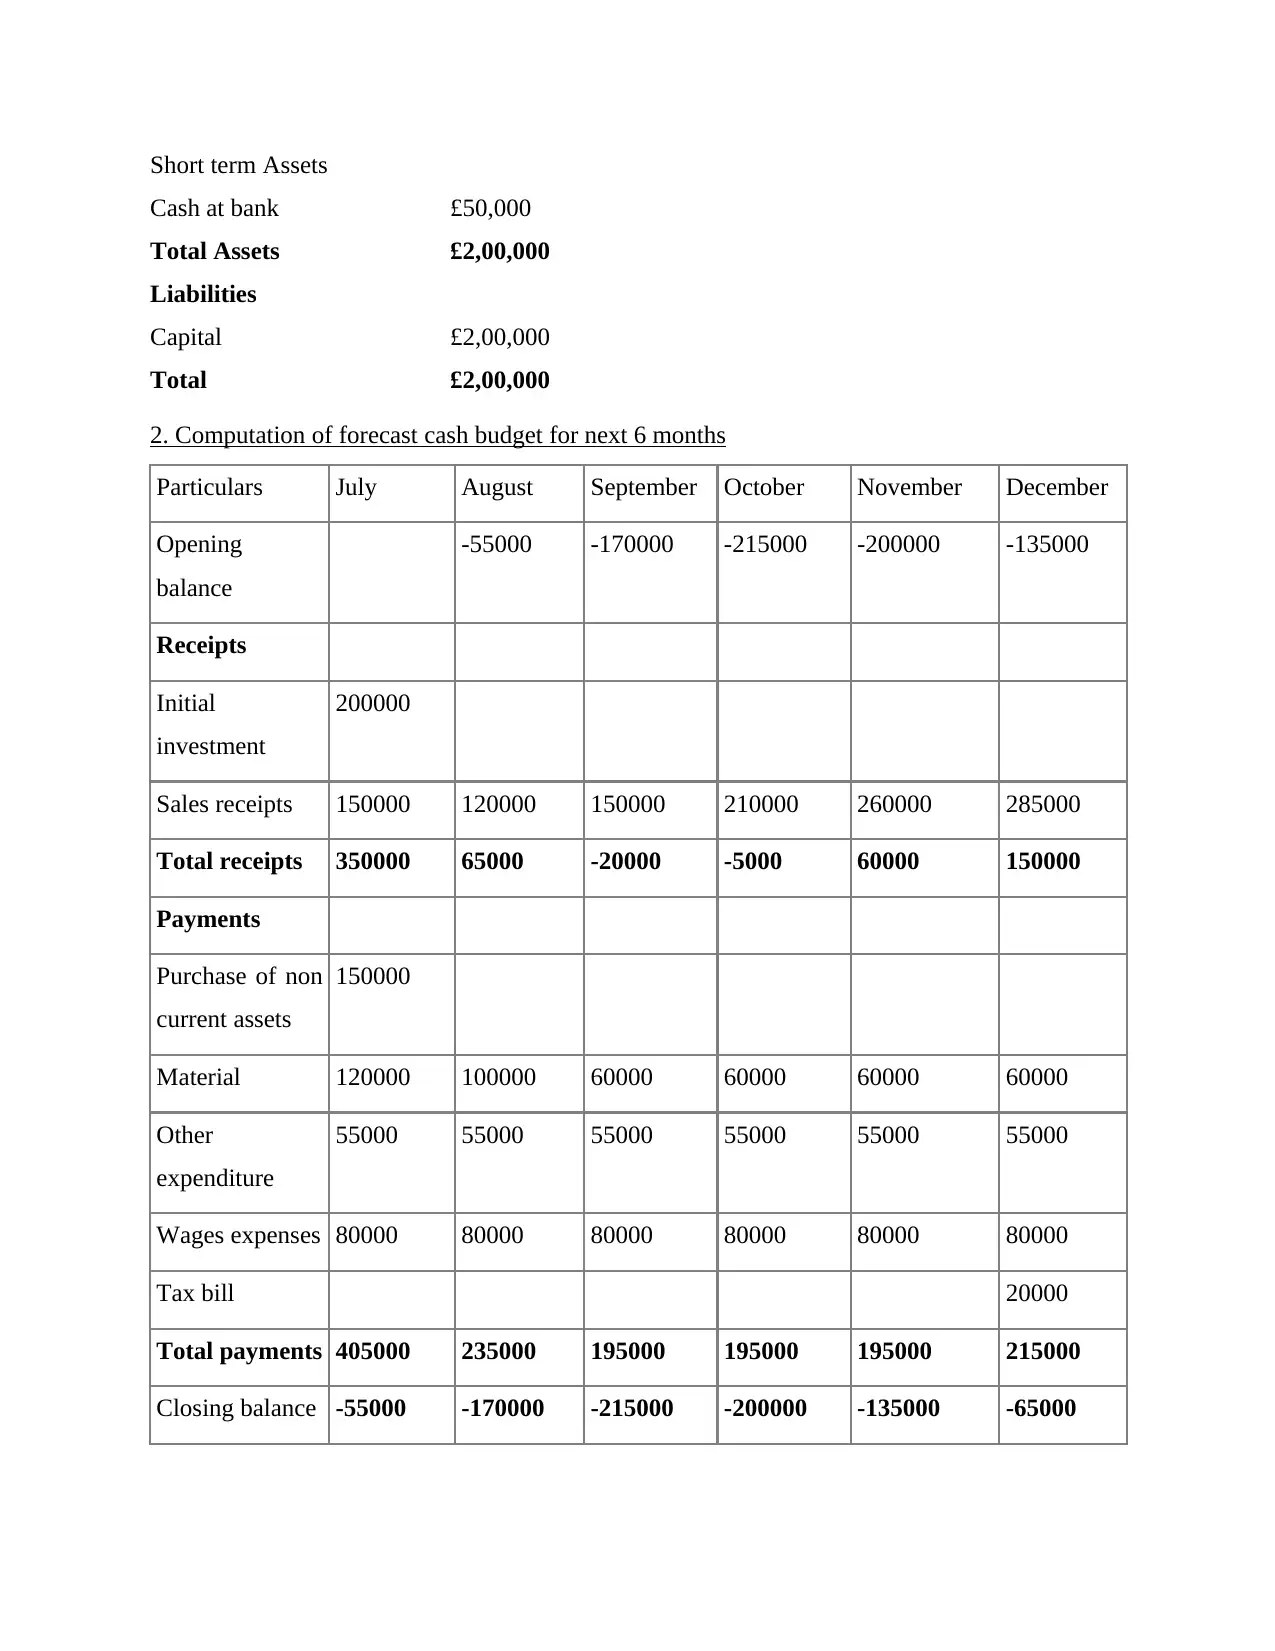
Short term Assets
Cash at bank £50,000
Total Assets £2,00,000
Liabilities
Capital £2,00,000
Total £2,00,000
2. Computation of forecast cash budget for next 6 months
Particulars July August September October November December
Opening
balance
-55000 -170000 -215000 -200000 -135000
Receipts
Initial
investment
200000
Sales receipts 150000 120000 150000 210000 260000 285000
Total receipts 350000 65000 -20000 -5000 60000 150000
Payments
Purchase of non
current assets
150000
Material 120000 100000 60000 60000 60000 60000
Other
expenditure
55000 55000 55000 55000 55000 55000
Wages expenses 80000 80000 80000 80000 80000 80000
Tax bill 20000
Total payments 405000 235000 195000 195000 195000 215000
Closing balance -55000 -170000 -215000 -200000 -135000 -65000
Paraphrase This Document
Need a fresh take? Get an instant paraphrase of this document with our AI Paraphraser
From the above cash budget, it can be analysed the total payment in all six month are
higher than the total receipts. That the reason the closing balance is shown as negative (Zhang,
Mohsin and Taghizadeh-Hesary, 2022). The Sassy Clothing organisation have to reduce their
expenditure and increase the incomes of the organisation as well. By the help of these they are
able to turn their negative balance of cash budget into the positive one. It can also be done if the
organisation brings the effective and efficient strategy.
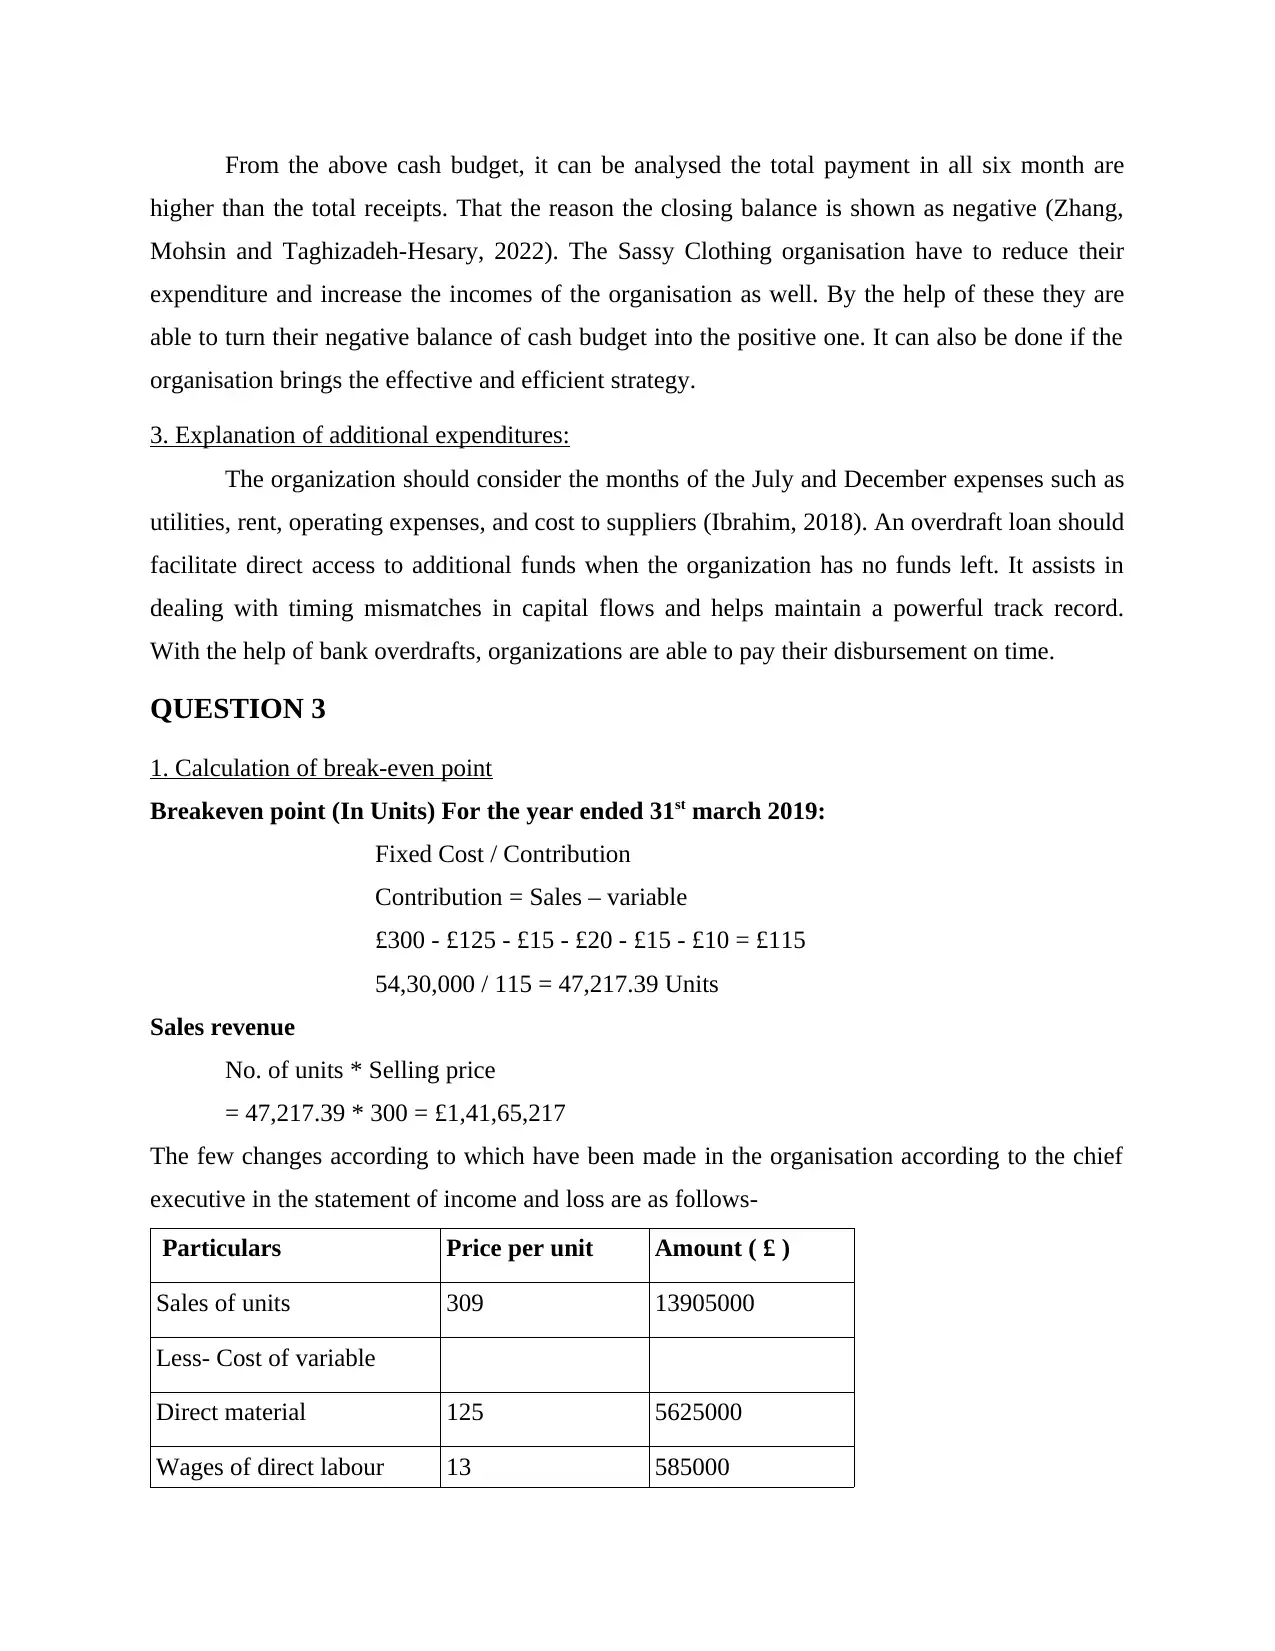
3. Explanation of additional expenditures:
The organization should consider the months of the July and December expenses such as
utilities, rent, operating expenses, and cost to suppliers (Ibrahim, 2018). An overdraft loan should
facilitate direct access to additional funds when the organization has no funds left. It assists in
dealing with timing mismatches in capital flows and helps maintain a powerful track record.
With the help of bank overdrafts, organizations are able to pay their disbursement on time.
QUESTION 3
1. Calculation of break-even point
Breakeven point (In Units) For the year ended 31st march 2019:
Fixed Cost / Contribution
Contribution = Sales – variable
£300 - £125 - £15 - £20 - £15 - £10 = £115
54,30,000 / 115 = 47,217.39 Units
Sales revenue
No. of units * Selling price
= 47,217.39 * 300 = £1,41,65,217
The few changes according to which have been made in the organisation according to the chief
executive in the statement of income and loss are as follows-
Particulars Price per unit Amount ( £ )
Sales of units 309 13905000
Less- Cost of variable
Direct material 125 5625000
Wages of direct labour 13 585000
higher than the total receipts. That the reason the closing balance is shown as negative (Zhang,
Mohsin and Taghizadeh-Hesary, 2022). The Sassy Clothing organisation have to reduce their
expenditure and increase the incomes of the organisation as well. By the help of these they are
able to turn their negative balance of cash budget into the positive one. It can also be done if the
organisation brings the effective and efficient strategy.
3. Explanation of additional expenditures:
The organization should consider the months of the July and December expenses such as
utilities, rent, operating expenses, and cost to suppliers (Ibrahim, 2018). An overdraft loan should
facilitate direct access to additional funds when the organization has no funds left. It assists in
dealing with timing mismatches in capital flows and helps maintain a powerful track record.
With the help of bank overdrafts, organizations are able to pay their disbursement on time.
QUESTION 3
1. Calculation of break-even point
Breakeven point (In Units) For the year ended 31st march 2019:
Fixed Cost / Contribution
Contribution = Sales – variable
£300 - £125 - £15 - £20 - £15 - £10 = £115
54,30,000 / 115 = 47,217.39 Units
Sales revenue
No. of units * Selling price
= 47,217.39 * 300 = £1,41,65,217
The few changes according to which have been made in the organisation according to the chief
executive in the statement of income and loss are as follows-
Particulars Price per unit Amount ( £ )
Sales of units 309 13905000
Less- Cost of variable
Direct material 125 5625000
Wages of direct labour 13 585000
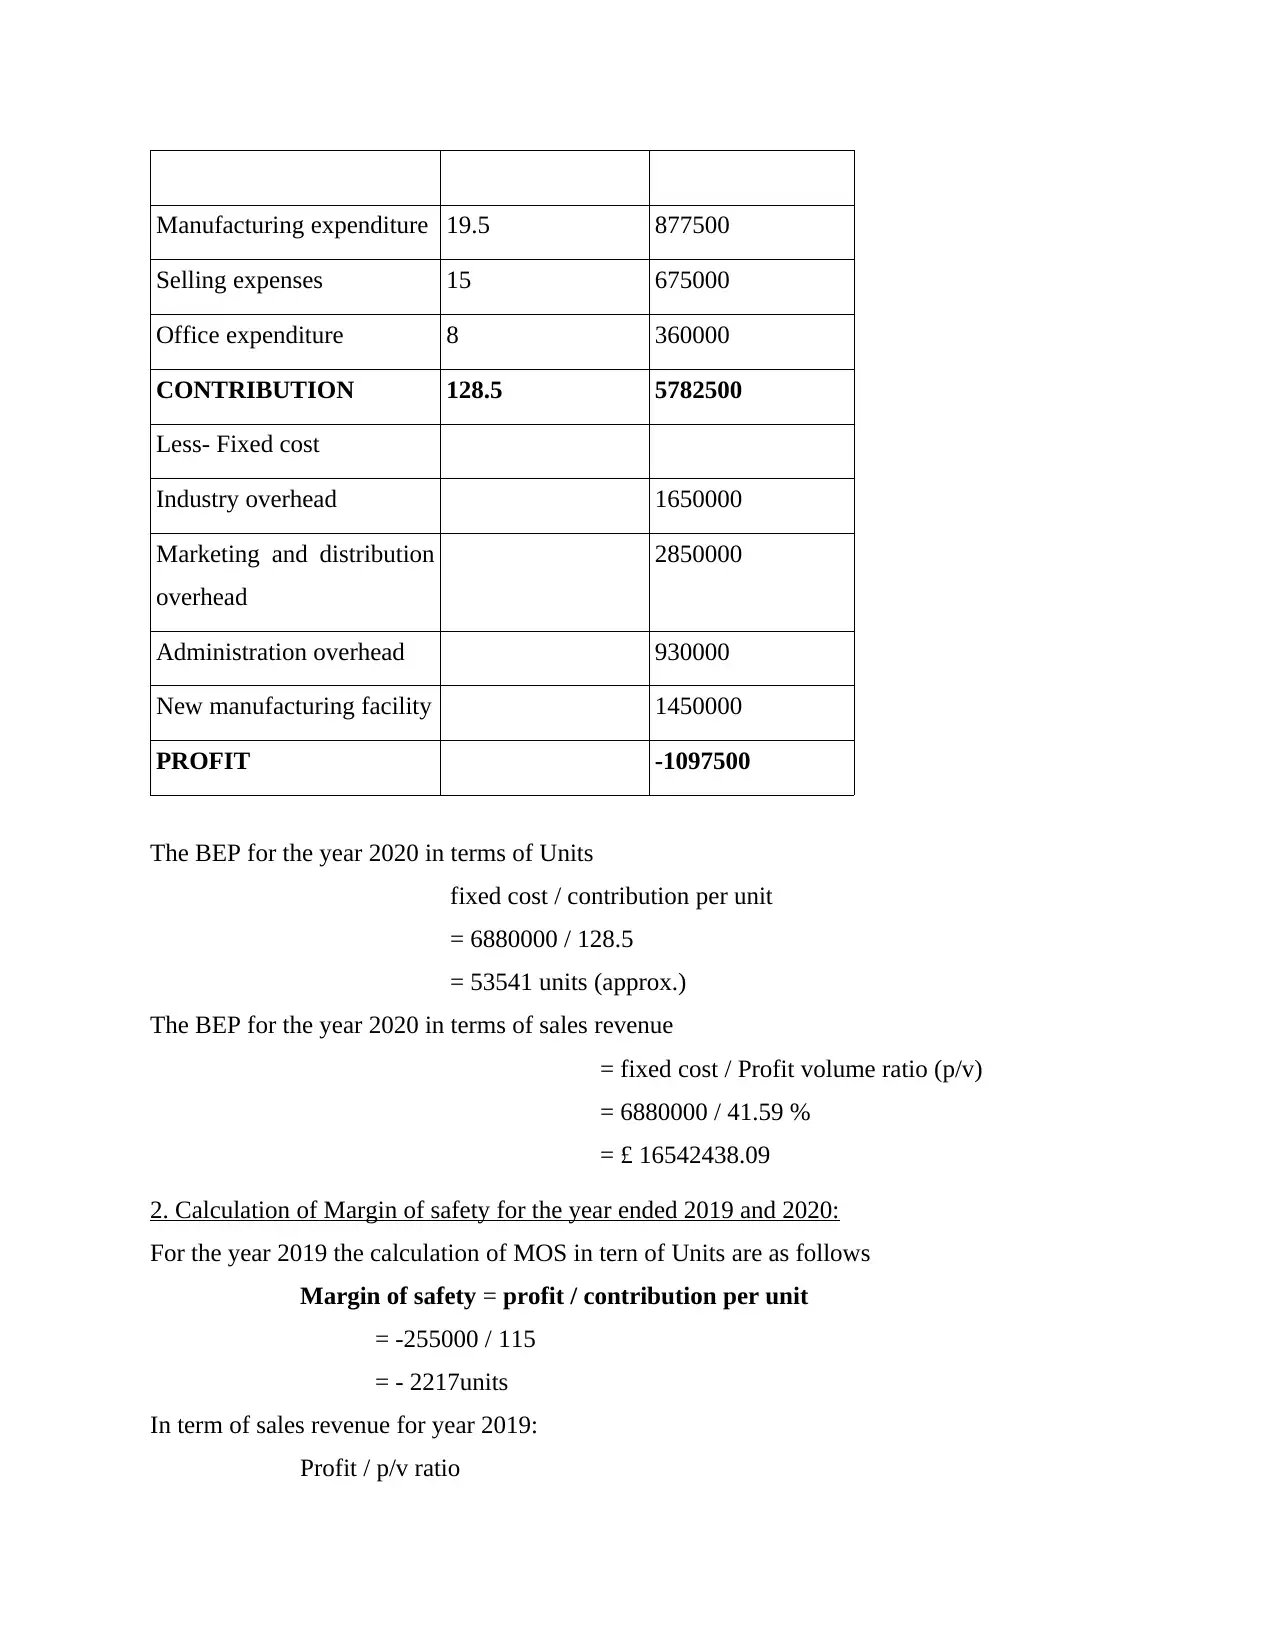
Manufacturing expenditure 19.5 877500
Selling expenses 15 675000
Office expenditure 8 360000
CONTRIBUTION 128.5 5782500
Less- Fixed cost
Industry overhead 1650000
Marketing and distribution
overhead
2850000
Administration overhead 930000
New manufacturing facility 1450000
PROFIT -1097500
The BEP for the year 2020 in terms of Units
fixed cost / contribution per unit
= 6880000 / 128.5
= 53541 units (approx.)
The BEP for the year 2020 in terms of sales revenue
= fixed cost / Profit volume ratio (p/v)
= 6880000 / 41.59 %
= £ 16542438.09
2. Calculation of Margin of safety for the year ended 2019 and 2020:
For the year 2019 the calculation of MOS in tern of Units are as follows
Margin of safety = profit / contribution per unit
= -255000 / 115
= - 2217units
In term of sales revenue for year 2019:
Profit / p/v ratio
⊘ This is a preview!⊘
Do you want full access?
Subscribe today to unlock all pages.
Trusted by 1+ million students worldwide
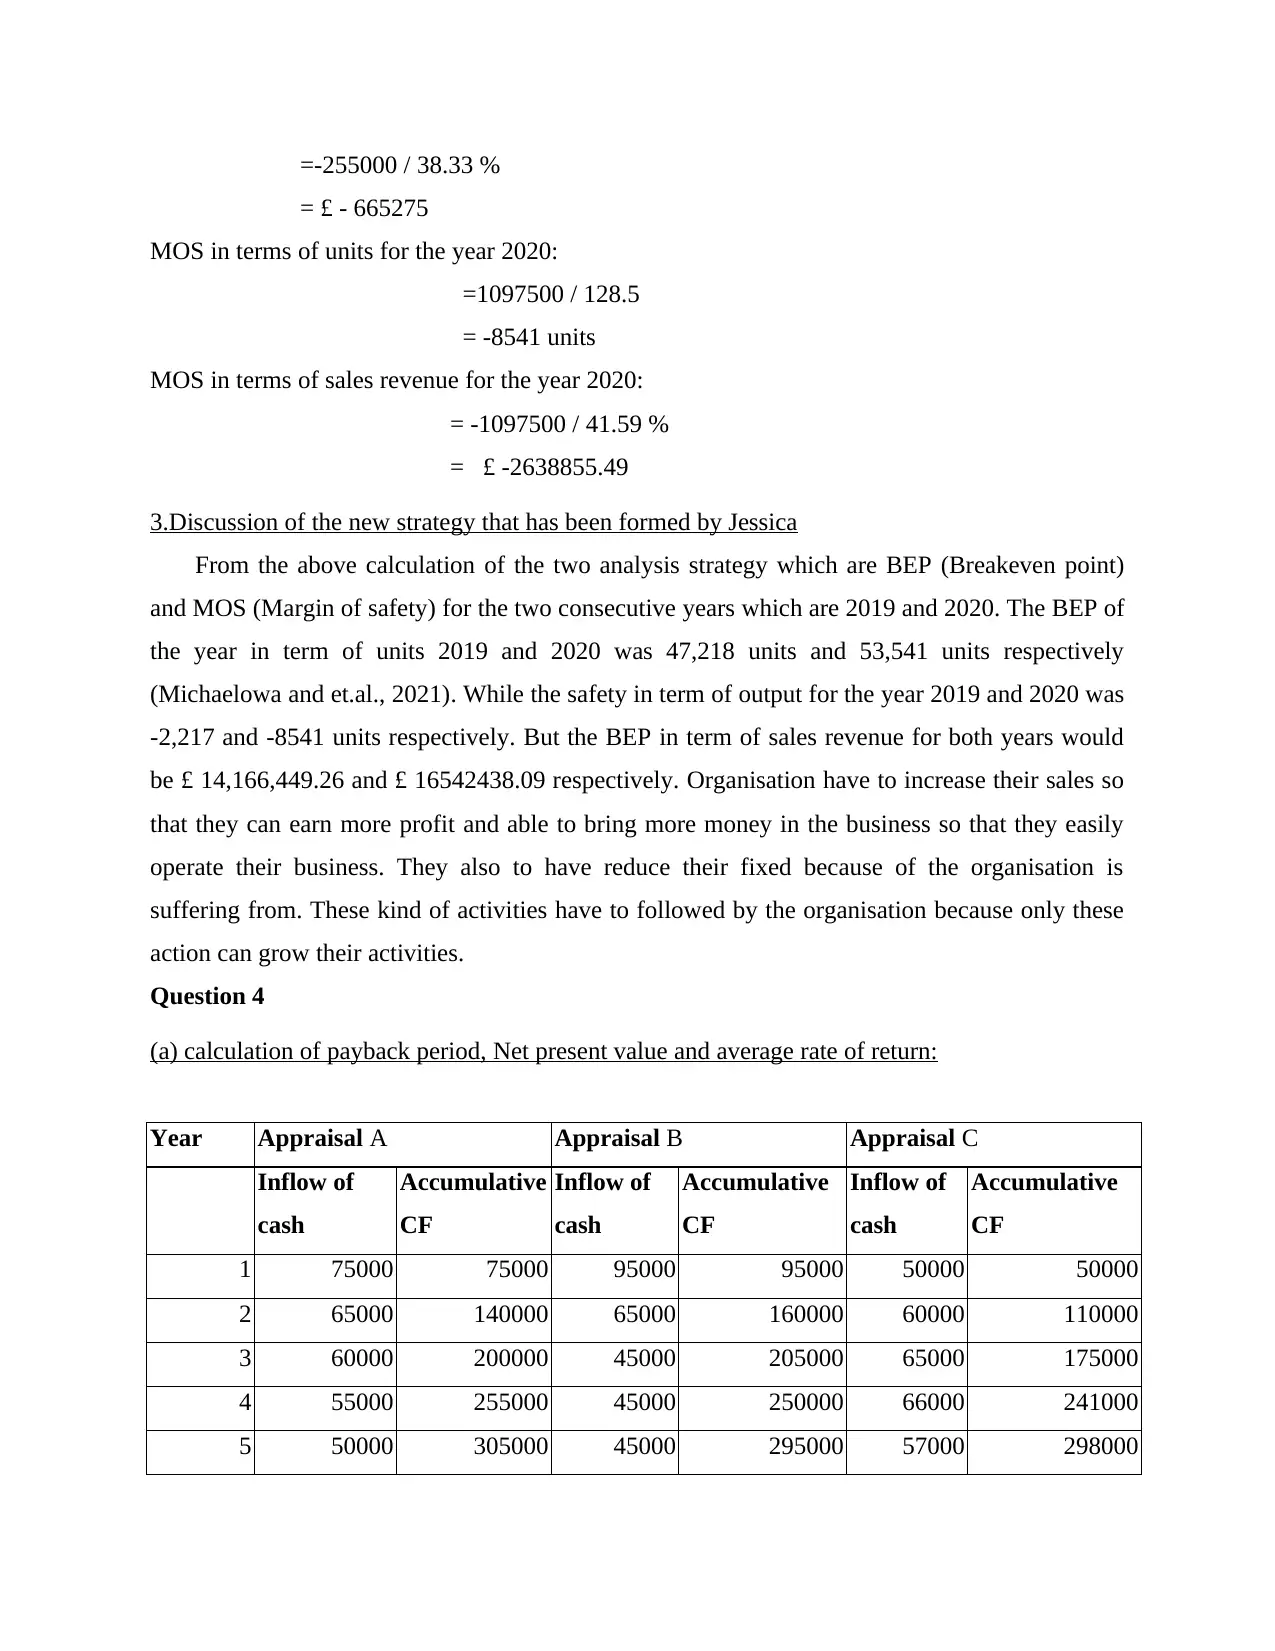
=-255000 / 38.33 %
= £ - 665275
MOS in terms of units for the year 2020:
=1097500 / 128.5
= -8541 units
MOS in terms of sales revenue for the year 2020:
= -1097500 / 41.59 %
= £ -2638855.49
3.Discussion of the new strategy that has been formed by Jessica
From the above calculation of the two analysis strategy which are BEP (Breakeven point)
and MOS (Margin of safety) for the two consecutive years which are 2019 and 2020. The BEP of
the year in term of units 2019 and 2020 was 47,218 units and 53,541 units respectively
(Michaelowa and et.al., 2021). While the safety in term of output for the year 2019 and 2020 was
-2,217 and -8541 units respectively. But the BEP in term of sales revenue for both years would
be £ 14,166,449.26 and £ 16542438.09 respectively. Organisation have to increase their sales so
that they can earn more profit and able to bring more money in the business so that they easily
operate their business. They also to have reduce their fixed because of the organisation is
suffering from. These kind of activities have to followed by the organisation because only these
action can grow their activities.
Question 4
(a) calculation of payback period, Net present value and average rate of return:
Year Appraisal A Appraisal B Appraisal C
Inflow of
cash
Accumulative
CF
Inflow of
cash
Accumulative
CF
Inflow of
cash
Accumulative
CF
1 75000 75000 95000 95000 50000 50000
2 65000 140000 65000 160000 60000 110000
3 60000 200000 45000 205000 65000 175000
4 55000 255000 45000 250000 66000 241000
5 50000 305000 45000 295000 57000 298000
Paraphrase This Document
Need a fresh take? Get an instant paraphrase of this document with our AI Paraphraser
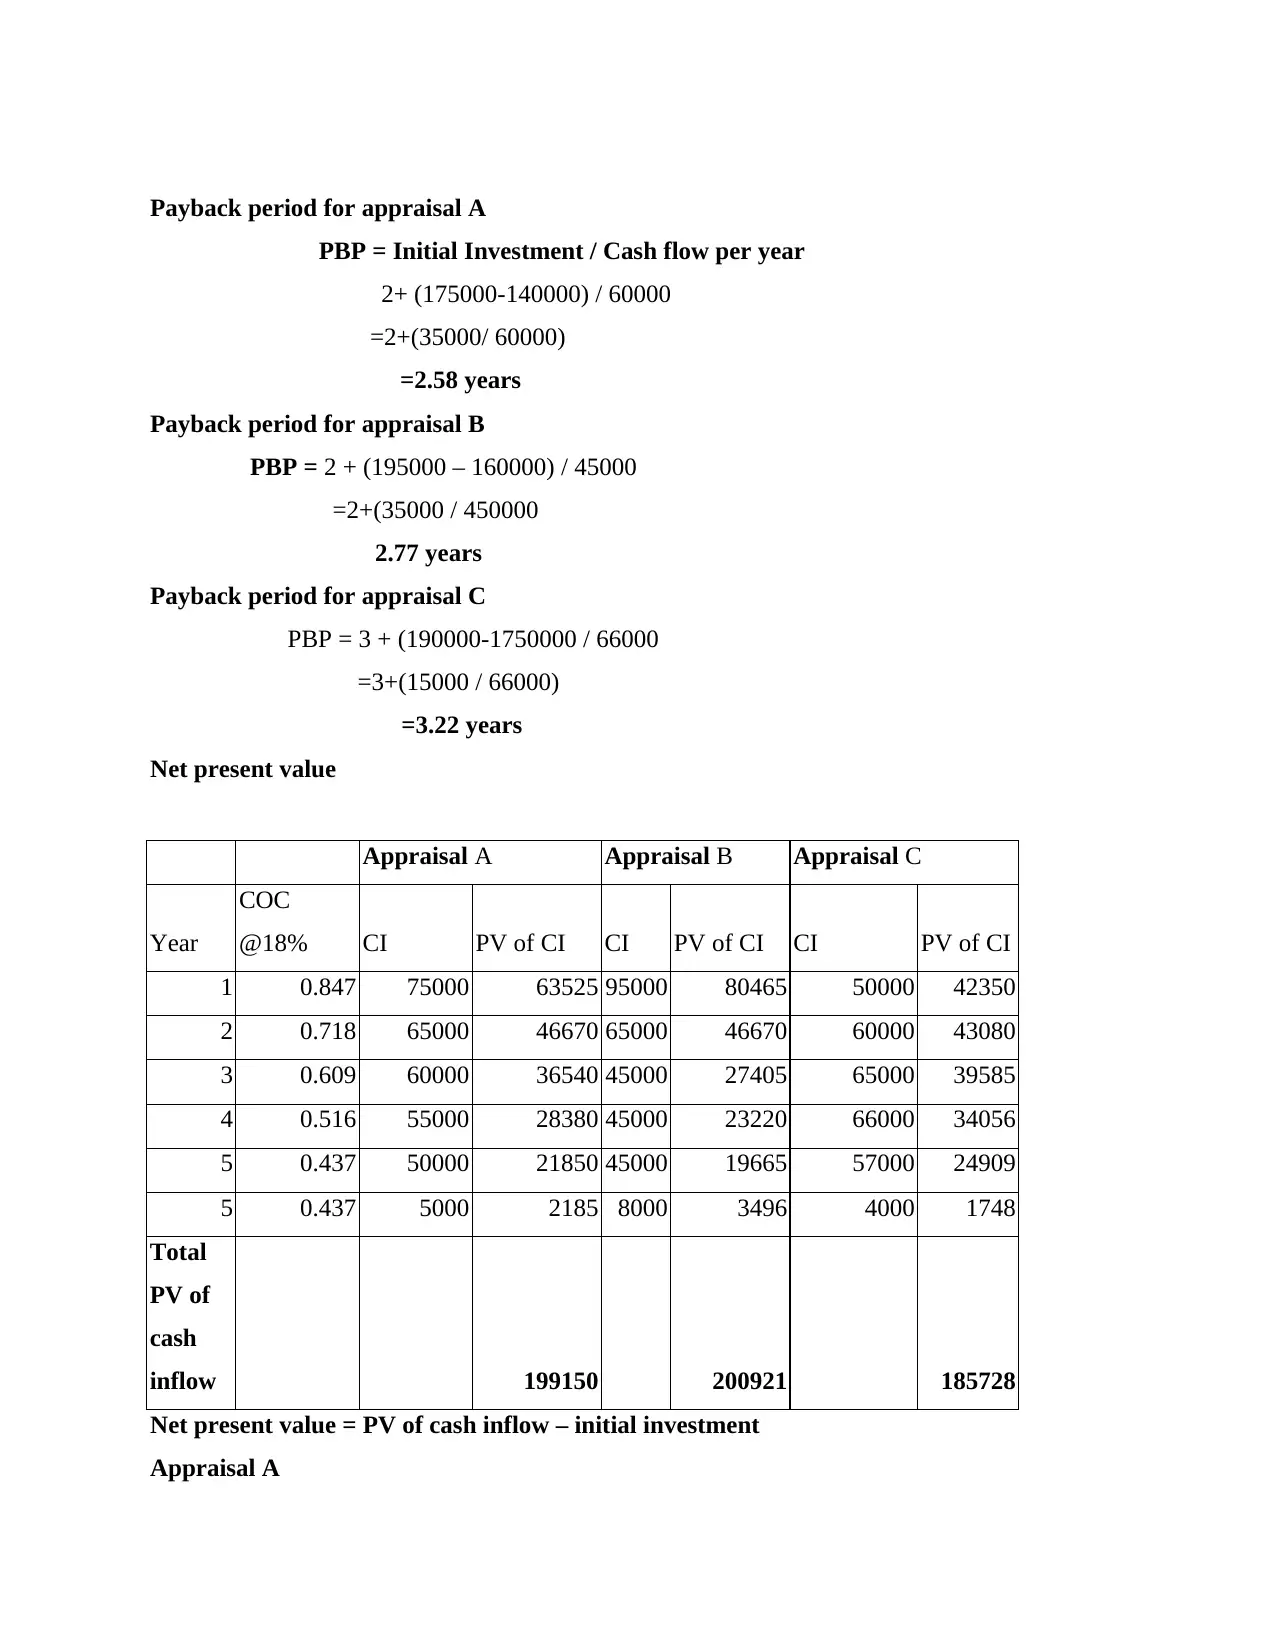
Payback period for appraisal A
PBP = Initial Investment / Cash flow per year
2+ (175000-140000) / 60000
=2+(35000/ 60000)
=2.58 years
Payback period for appraisal B
PBP = 2 + (195000 – 160000) / 45000
=2+(35000 / 450000
2.77 years
Payback period for appraisal C
PBP = 3 + (190000-1750000 / 66000
=3+(15000 / 66000)
=3.22 years
Net present value
Appraisal A Appraisal B Appraisal C
Year
COC
@18% CI PV of CI CI PV of CI CI PV of CI
1 0.847 75000 63525 95000 80465 50000 42350
2 0.718 65000 46670 65000 46670 60000 43080
3 0.609 60000 36540 45000 27405 65000 39585
4 0.516 55000 28380 45000 23220 66000 34056
5 0.437 50000 21850 45000 19665 57000 24909
5 0.437 5000 2185 8000 3496 4000 1748
Total
PV of
cash
inflow 199150 200921 185728
Net present value = PV of cash inflow – initial investment
Appraisal A
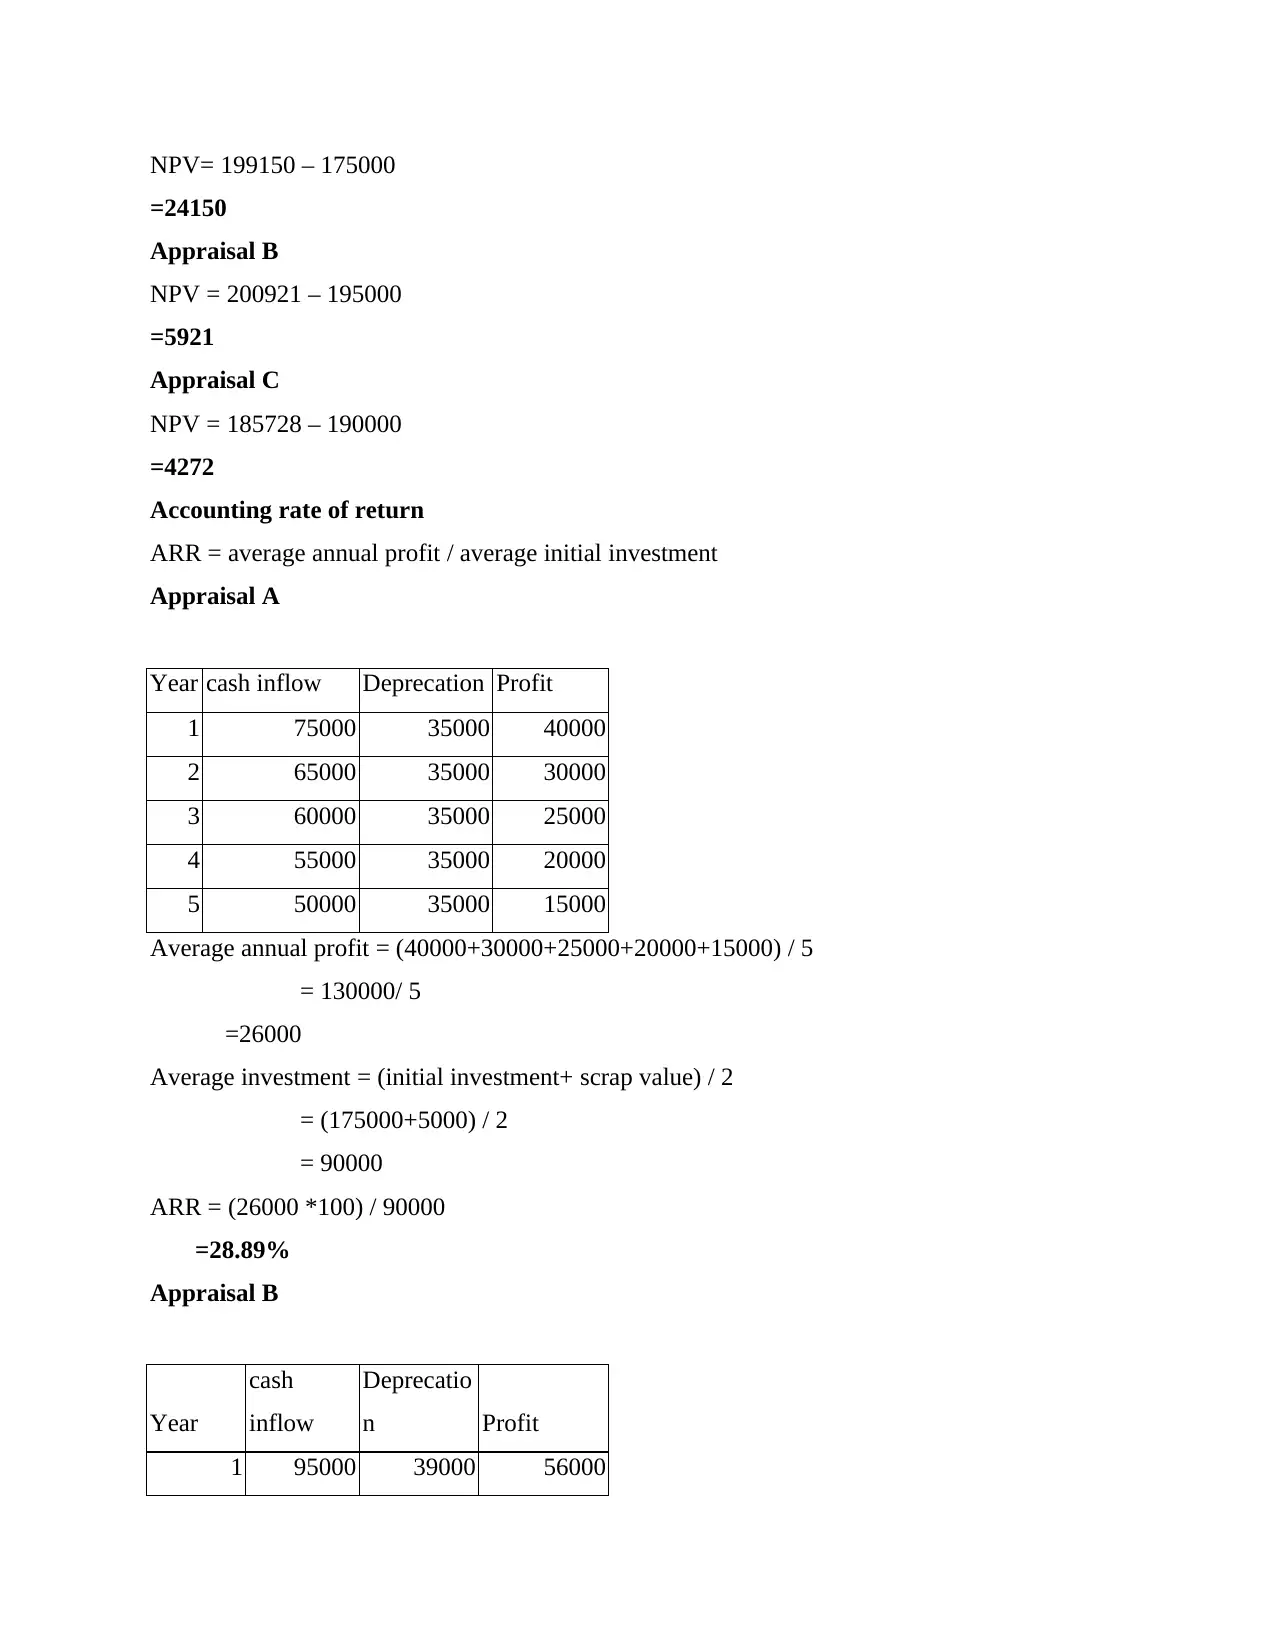
NPV= 199150 – 175000
=24150
Appraisal B
NPV = 200921 – 195000
=5921
Appraisal C
NPV = 185728 – 190000
=4272
Accounting rate of return
ARR = average annual profit / average initial investment
Appraisal A
Year cash inflow Deprecation Profit
1 75000 35000 40000
2 65000 35000 30000
3 60000 35000 25000
4 55000 35000 20000
5 50000 35000 15000
Average annual profit = (40000+30000+25000+20000+15000) / 5
= 130000/ 5
=26000
Average investment = (initial investment+ scrap value) / 2
= (175000+5000) / 2
= 90000
ARR = (26000 *100) / 90000
=28.89%
Appraisal B
Year
cash
inflow
Deprecatio
n Profit
1 95000 39000 56000
⊘ This is a preview!⊘
Do you want full access?
Subscribe today to unlock all pages.
Trusted by 1+ million students worldwide
1 out of 18
Related Documents


Your All-in-One AI-Powered Toolkit for Academic Success.
+13062052269
info@desklib.com
Available 24*7 on WhatsApp / Email
![[object Object]](/_next/static/media/star-bottom.7253800d.svg)
Unlock your academic potential
Copyright © 2020–2026 A2Z Services. All Rights Reserved. Developed and managed by ZUCOL.