Arden University - FIN4001 Financial Statement Analysis Report
VerifiedAdded on 2023/06/04
|17
|3736
|173
Report
AI Summary
This report provides a comprehensive financial analysis, including ratio calculations for 2018 and 2019, assessing profitability, efficiency, and liquidity. It includes a discussion on the significance of financial statement analysis for stakeholders. The report features an opening statement of financial position and a six-month cash budget, along with explanations of additional expenditures. Furthermore, the analysis calculates the break-even point (BEP) and margin of safety (MOS) for 2019 and 2020, discussing a new business strategy. Finally, the report evaluates investment appraisal techniques, including payback period, net present value (NPV), and average rate of return, to determine the best investment option. This student-contributed document is available on Desklib, a platform offering a wealth of study resources.

Introduction to Finance
Paraphrase This Document
Need a fresh take? Get an instant paraphrase of this document with our AI Paraphraser
Contents
INTRODUCTION...........................................................................................................................1
Question 1........................................................................................................................................1
Calculation of ratios for year 2019 and year 2018 ......................................................................1
Significance of financial statements analysis .............................................................................3
Question 2........................................................................................................................................3
a) opening statement of financial position .................................................................................3
b ) monthly cash budget for 6 months ........................................................................................4
c ) Explanation of additional expenditures..................................................................................4
Question 3 .......................................................................................................................................5
a ) Calculation of Break even point (BEP)..................................................................................5
b) Margin of safety ( MOS ) for the year ended 2019 and 2020.................................................6
c) Discussion of the new strategy that has been formed by Jessica.............................................6
Question 4........................................................................................................................................7
(a) calculation of pay back period, Net present value and average rate of return........................7
Discuss the best method of appraisal technique..........................................................................9
Capital investment appraisal techniques....................................................................................10
CONCLUSION..............................................................................................................................11
REFERENCES..............................................................................................................................13

⊘ This is a preview!⊘
Do you want full access?
Subscribe today to unlock all pages.
Trusted by 1+ million students worldwide
INTRODUCTION
Finance is general term which tells about various activities attached like banking services,
leverage debt or credit, money market, and other monetary investments. It represents
management of money and the procedure to required necessary funds. Finance word is used in
day to day operating life of any enterprise which should be managed with financial statement. It
are written document which signifies different economic activities and financial performance of
an organisation. They are usually audited by group of professional and government agencies to
ensure optimum reliability and utilize for many purposes by organisation (Elijido‐Ten and
Dumay, 2019). Financial statement most often consists of statement of profit and loss, statement
of financial position and statement of cash flow. This written report includes calculation of few
ratios and their analysis, NPV analysis which implies to choose most profitable project and it
also consider cash budget which analyse their cost which would occur in future.
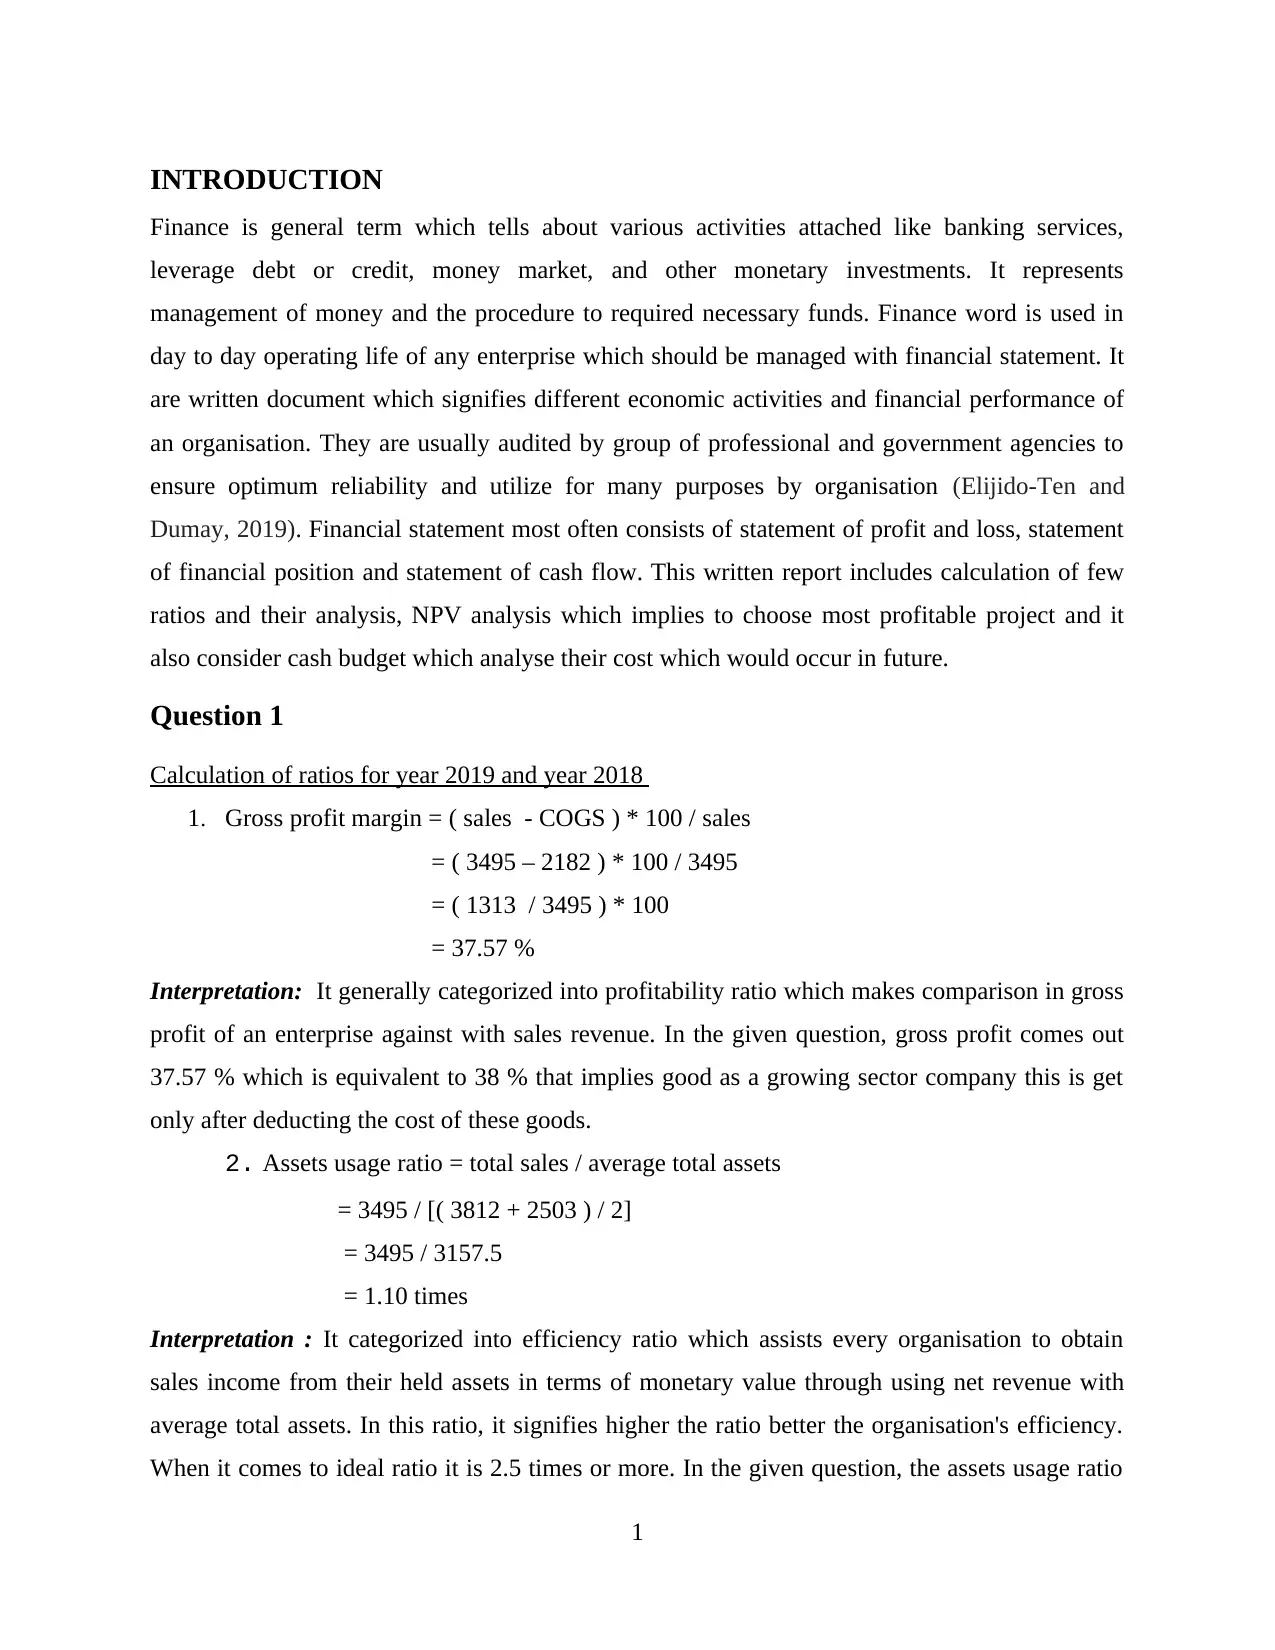
Question 1
Calculation of ratios for year 2019 and year 2018
1. Gross profit margin = ( sales - COGS ) * 100 / sales
= ( 3495 – 2182 ) * 100 / 3495
= ( 1313 / 3495 ) * 100
= 37.57 %
Interpretation: It generally categorized into profitability ratio which makes comparison in gross
profit of an enterprise against with sales revenue. In the given question, gross profit comes out
37.57 % which is equivalent to 38 % that implies good as a growing sector company this is get
only after deducting the cost of these goods.
2. Assets usage ratio = total sales / average total assets
= 3495 / [( 3812 + 2503 ) / 2]
= 3495 / 3157.5
= 1.10 times
Interpretation : It categorized into efficiency ratio which assists every organisation to obtain
sales income from their held assets in terms of monetary value through using net revenue with
average total assets. In this ratio, it signifies higher the ratio better the organisation's efficiency.
When it comes to ideal ratio it is 2.5 times or more. In the given question, the assets usage ratio
1
Finance is general term which tells about various activities attached like banking services,
leverage debt or credit, money market, and other monetary investments. It represents
management of money and the procedure to required necessary funds. Finance word is used in
day to day operating life of any enterprise which should be managed with financial statement. It
are written document which signifies different economic activities and financial performance of
an organisation. They are usually audited by group of professional and government agencies to
ensure optimum reliability and utilize for many purposes by organisation (Elijido‐Ten and
Dumay, 2019). Financial statement most often consists of statement of profit and loss, statement
of financial position and statement of cash flow. This written report includes calculation of few
ratios and their analysis, NPV analysis which implies to choose most profitable project and it
also consider cash budget which analyse their cost which would occur in future.
Question 1
Calculation of ratios for year 2019 and year 2018
1. Gross profit margin = ( sales - COGS ) * 100 / sales
= ( 3495 – 2182 ) * 100 / 3495
= ( 1313 / 3495 ) * 100
= 37.57 %
Interpretation: It generally categorized into profitability ratio which makes comparison in gross
profit of an enterprise against with sales revenue. In the given question, gross profit comes out
37.57 % which is equivalent to 38 % that implies good as a growing sector company this is get
only after deducting the cost of these goods.
2. Assets usage ratio = total sales / average total assets
= 3495 / [( 3812 + 2503 ) / 2]
= 3495 / 3157.5
= 1.10 times
Interpretation : It categorized into efficiency ratio which assists every organisation to obtain
sales income from their held assets in terms of monetary value through using net revenue with
average total assets. In this ratio, it signifies higher the ratio better the organisation's efficiency.
When it comes to ideal ratio it is 2.5 times or more. In the given question, the assets usage ratio
1
Paraphrase This Document
Need a fresh take? Get an instant paraphrase of this document with our AI Paraphraser
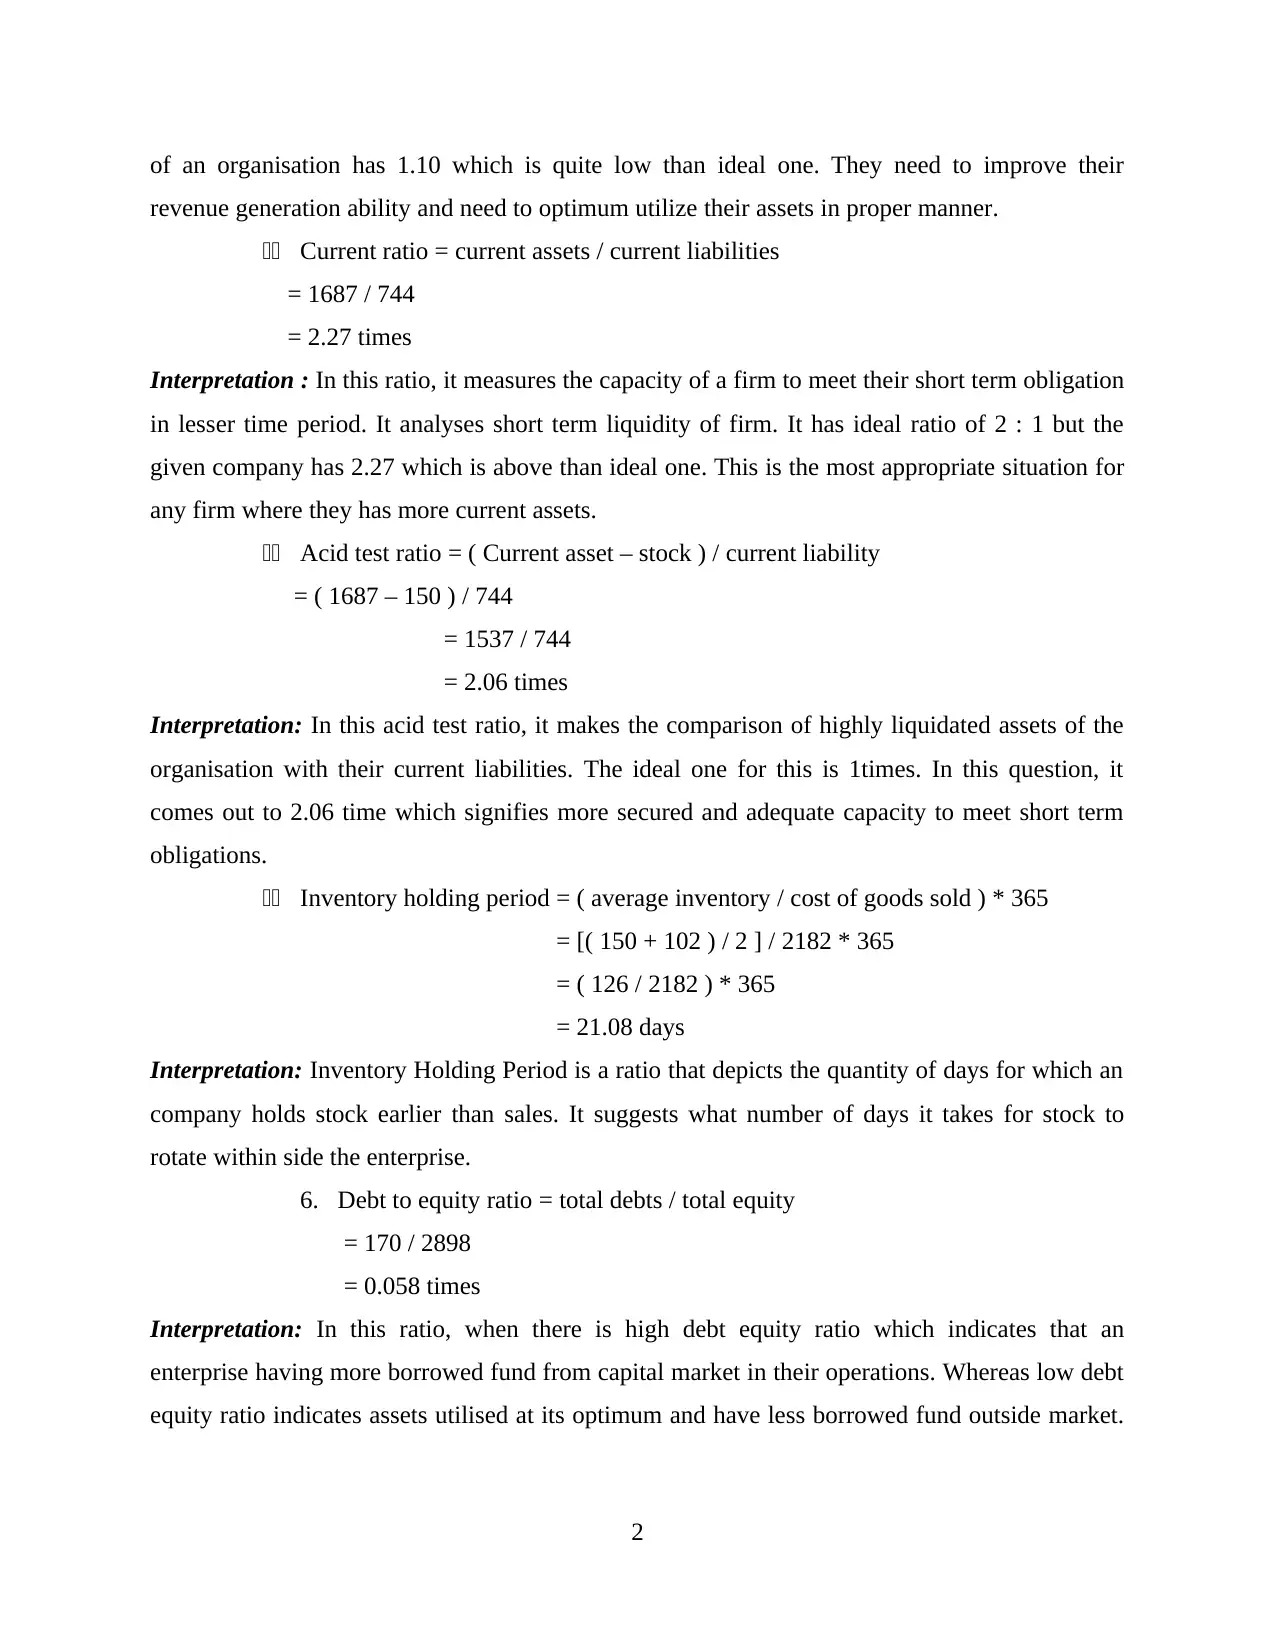
of an organisation has 1.10 which is quite low than ideal one. They need to improve their
revenue generation ability and need to optimum utilize their assets in proper manner.
33 Current ratio = current assets / current liabilities
= 1687 / 744
= 2.27 times
Interpretation : In this ratio, it measures the capacity of a firm to meet their short term obligation
in lesser time period. It analyses short term liquidity of firm. It has ideal ratio of 2 : 1 but the
given company has 2.27 which is above than ideal one. This is the most appropriate situation for
any firm where they has more current assets.
33 Acid test ratio = ( Current asset – stock ) / current liability
= ( 1687 – 150 ) / 744
= 1537 / 744
= 2.06 times
Interpretation: In this acid test ratio, it makes the comparison of highly liquidated assets of the
organisation with their current liabilities. The ideal one for this is 1times. In this question, it
comes out to 2.06 time which signifies more secured and adequate capacity to meet short term
obligations.
33 Inventory holding period = ( average inventory / cost of goods sold ) * 365
= [( 150 + 102 ) / 2 ] / 2182 * 365
= ( 126 / 2182 ) * 365
= 21.08 days
Interpretation: Inventory Holding Period is a ratio that depicts the quantity of days for which an
company holds stock earlier than sales. It suggests what number of days it takes for stock to
rotate within side the enterprise.
6. Debt to equity ratio = total debts / total equity
= 170 / 2898
= 0.058 times
Interpretation: In this ratio, when there is high debt equity ratio which indicates that an
enterprise having more borrowed fund from capital market in their operations. Whereas low debt
equity ratio indicates assets utilised at its optimum and have less borrowed fund outside market.
2
In this given question, it have 0.058 which denotes they have less borrowed fund and less risk at
hand.
Significance of financial statements analysis
It is an annual statement of a financial year which broke down into expenditures and incomes. It
furnishes stakeholder of inner and outside as nicely along side opportunities to make counselled
choices that relate with the investing( Arnold and Sutton, 2022). It additionally enables in
presenting the lending establishments with an unbiased view of monetary fitness of business
enterprise this is beneficial for taking the choice concerning lending. This evaluation consists of
reviewing the statements of monetary of the commercial enterprise company to gain know-how
in their monetary function. These statements is composed the profits statements, stability sheets
and coins flow. The evaluation of inner is completed through the workers, corporations of
authorities, executives and different humans with the assist of accounting information of
commercial enterprise firm. On the opposite aspect the outside evaluation is held through
outsiders with accession to posted monetary statements. It includes investors, credit score and
authorities corporations, creditors. It enables in taking the proper and suitable choice for enhance
the monetary role of the company.
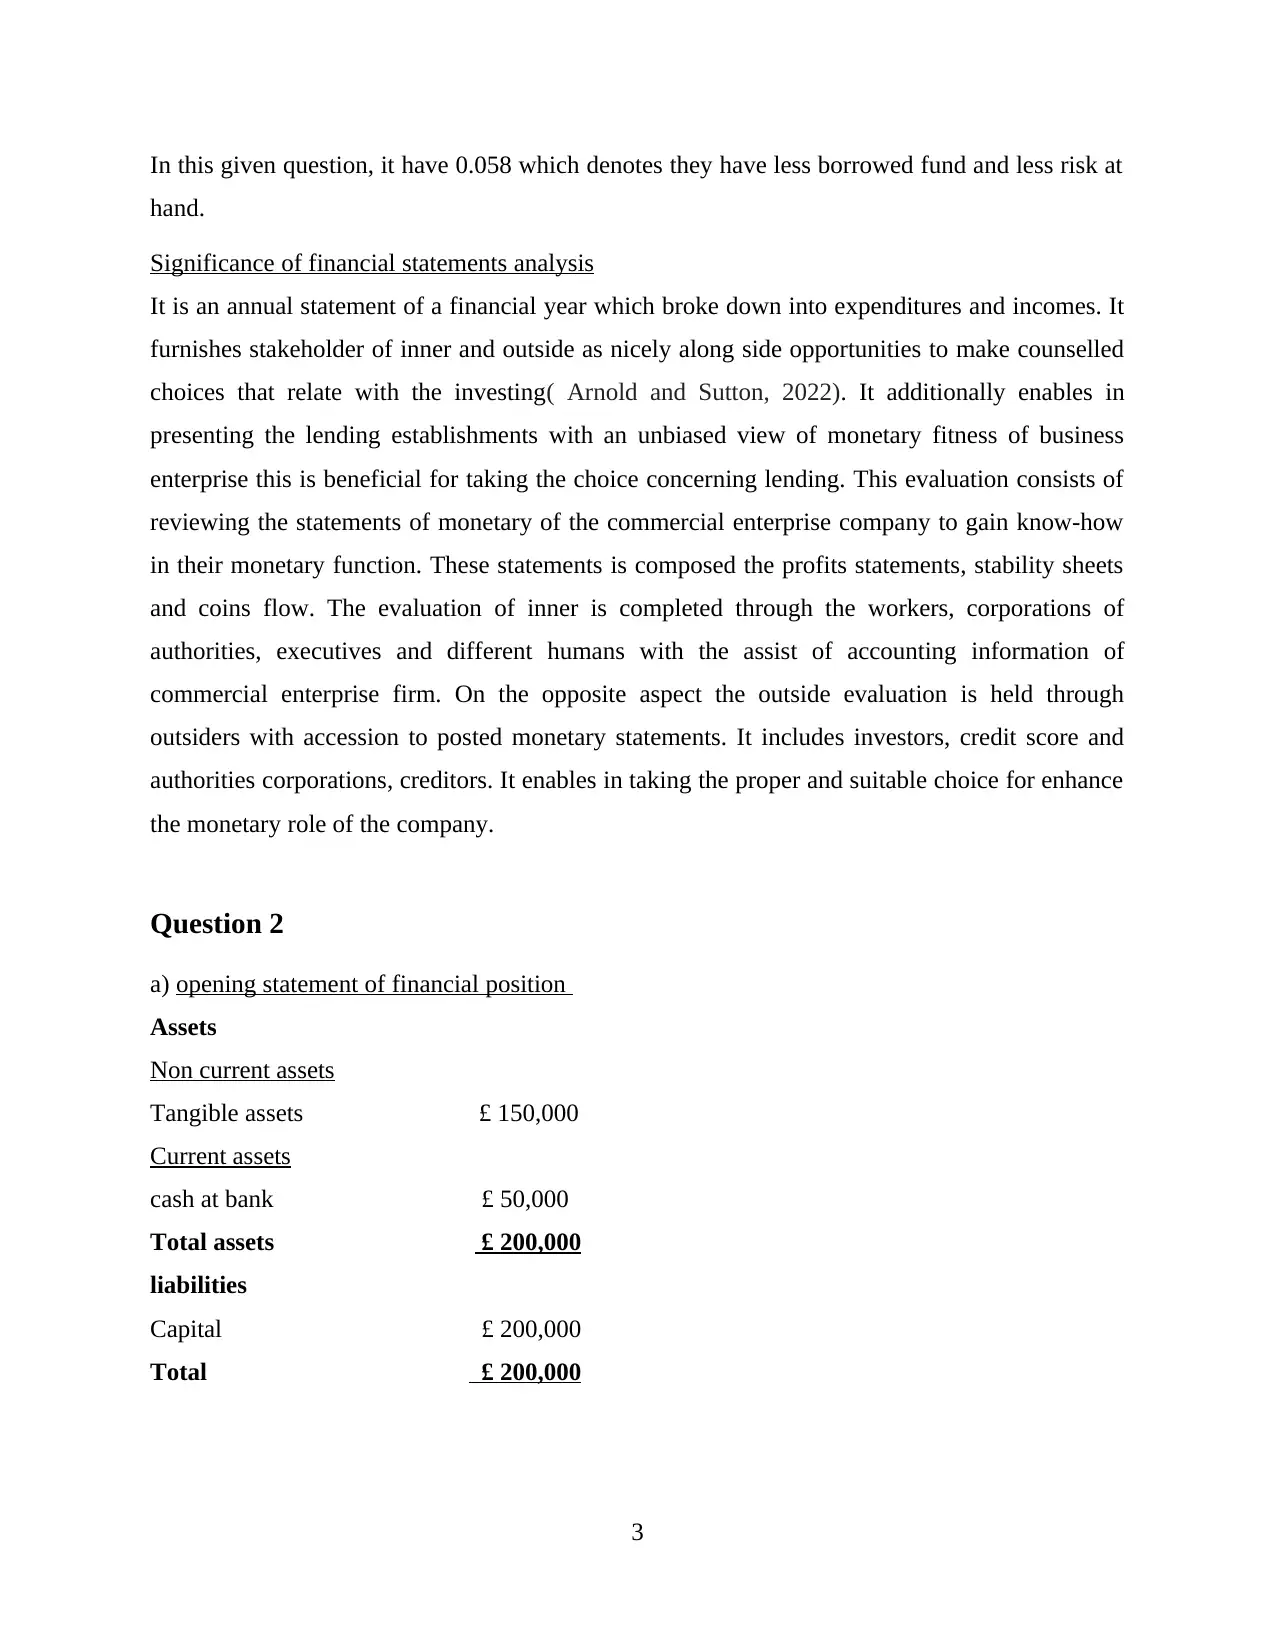
Question 2
a) opening statement of financial position
Assets
Non current assets
Tangible assets £ 150,000
Current assets
cash at bank £ 50,000
Total assets £ 200,000
liabilities
Capital £ 200,000
Total £ 200,000
3
hand.
Significance of financial statements analysis
It is an annual statement of a financial year which broke down into expenditures and incomes. It
furnishes stakeholder of inner and outside as nicely along side opportunities to make counselled
choices that relate with the investing( Arnold and Sutton, 2022). It additionally enables in
presenting the lending establishments with an unbiased view of monetary fitness of business
enterprise this is beneficial for taking the choice concerning lending. This evaluation consists of
reviewing the statements of monetary of the commercial enterprise company to gain know-how
in their monetary function. These statements is composed the profits statements, stability sheets
and coins flow. The evaluation of inner is completed through the workers, corporations of
authorities, executives and different humans with the assist of accounting information of
commercial enterprise firm. On the opposite aspect the outside evaluation is held through
outsiders with accession to posted monetary statements. It includes investors, credit score and
authorities corporations, creditors. It enables in taking the proper and suitable choice for enhance
the monetary role of the company.
Question 2
a) opening statement of financial position
Assets
Non current assets
Tangible assets £ 150,000
Current assets
cash at bank £ 50,000
Total assets £ 200,000
liabilities
Capital £ 200,000
Total £ 200,000
3
⊘ This is a preview!⊘
Do you want full access?
Subscribe today to unlock all pages.
Trusted by 1+ million students worldwide
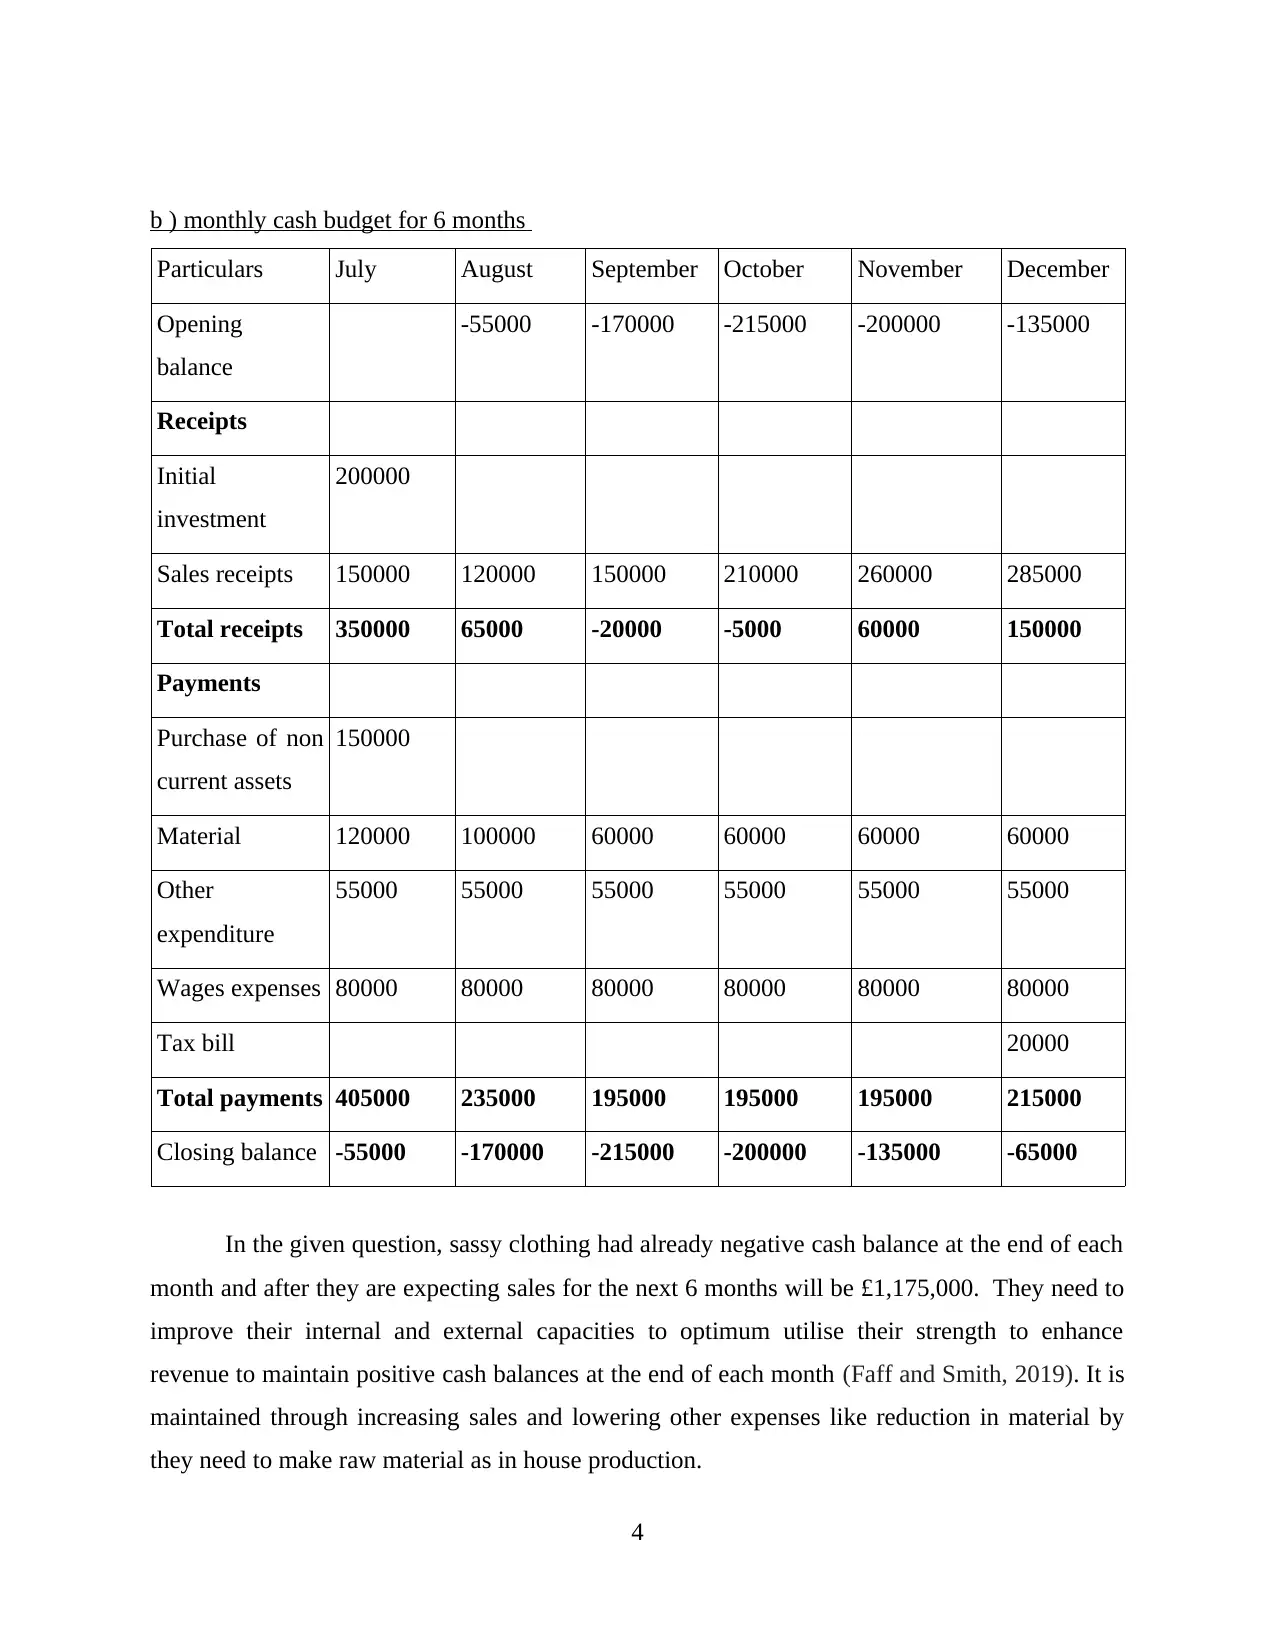
b ) monthly cash budget for 6 months
Particulars July August September October November December
Opening
balance
-55000 -170000 -215000 -200000 -135000
Receipts
Initial
investment
200000
Sales receipts 150000 120000 150000 210000 260000 285000
Total receipts 350000 65000 -20000 -5000 60000 150000
Payments
Purchase of non
current assets
150000
Material 120000 100000 60000 60000 60000 60000
Other
expenditure
55000 55000 55000 55000 55000 55000
Wages expenses 80000 80000 80000 80000 80000 80000
Tax bill 20000
Total payments 405000 235000 195000 195000 195000 215000
Closing balance -55000 -170000 -215000 -200000 -135000 -65000
In the given question, sassy clothing had already negative cash balance at the end of each
month and after they are expecting sales for the next 6 months will be £1,175,000. They need to
improve their internal and external capacities to optimum utilise their strength to enhance
revenue to maintain positive cash balances at the end of each month (Faff and Smith, 2019). It is
maintained through increasing sales and lowering other expenses like reduction in material by
they need to make raw material as in house production.
4
Paraphrase This Document
Need a fresh take? Get an instant paraphrase of this document with our AI Paraphraser
c ) Explanation of additional expenditures
This business enterprise need to encompass the costs within side the month of July and
December which include software bills, rent, running fees and charge to the suppliers. Overdraft
mortgage presents to business enterprise on the spot admittance to more price range after they do
now no longer have any remain (Borghei, 2021)(Li and Wee, 2021). It allows in dealing with the
timing mismatch of price range waft and aids in keeping the good track record. With assist of the
financial institution overdraft the business enterprise is capable of do the bills in their costs on
time.
Question 3
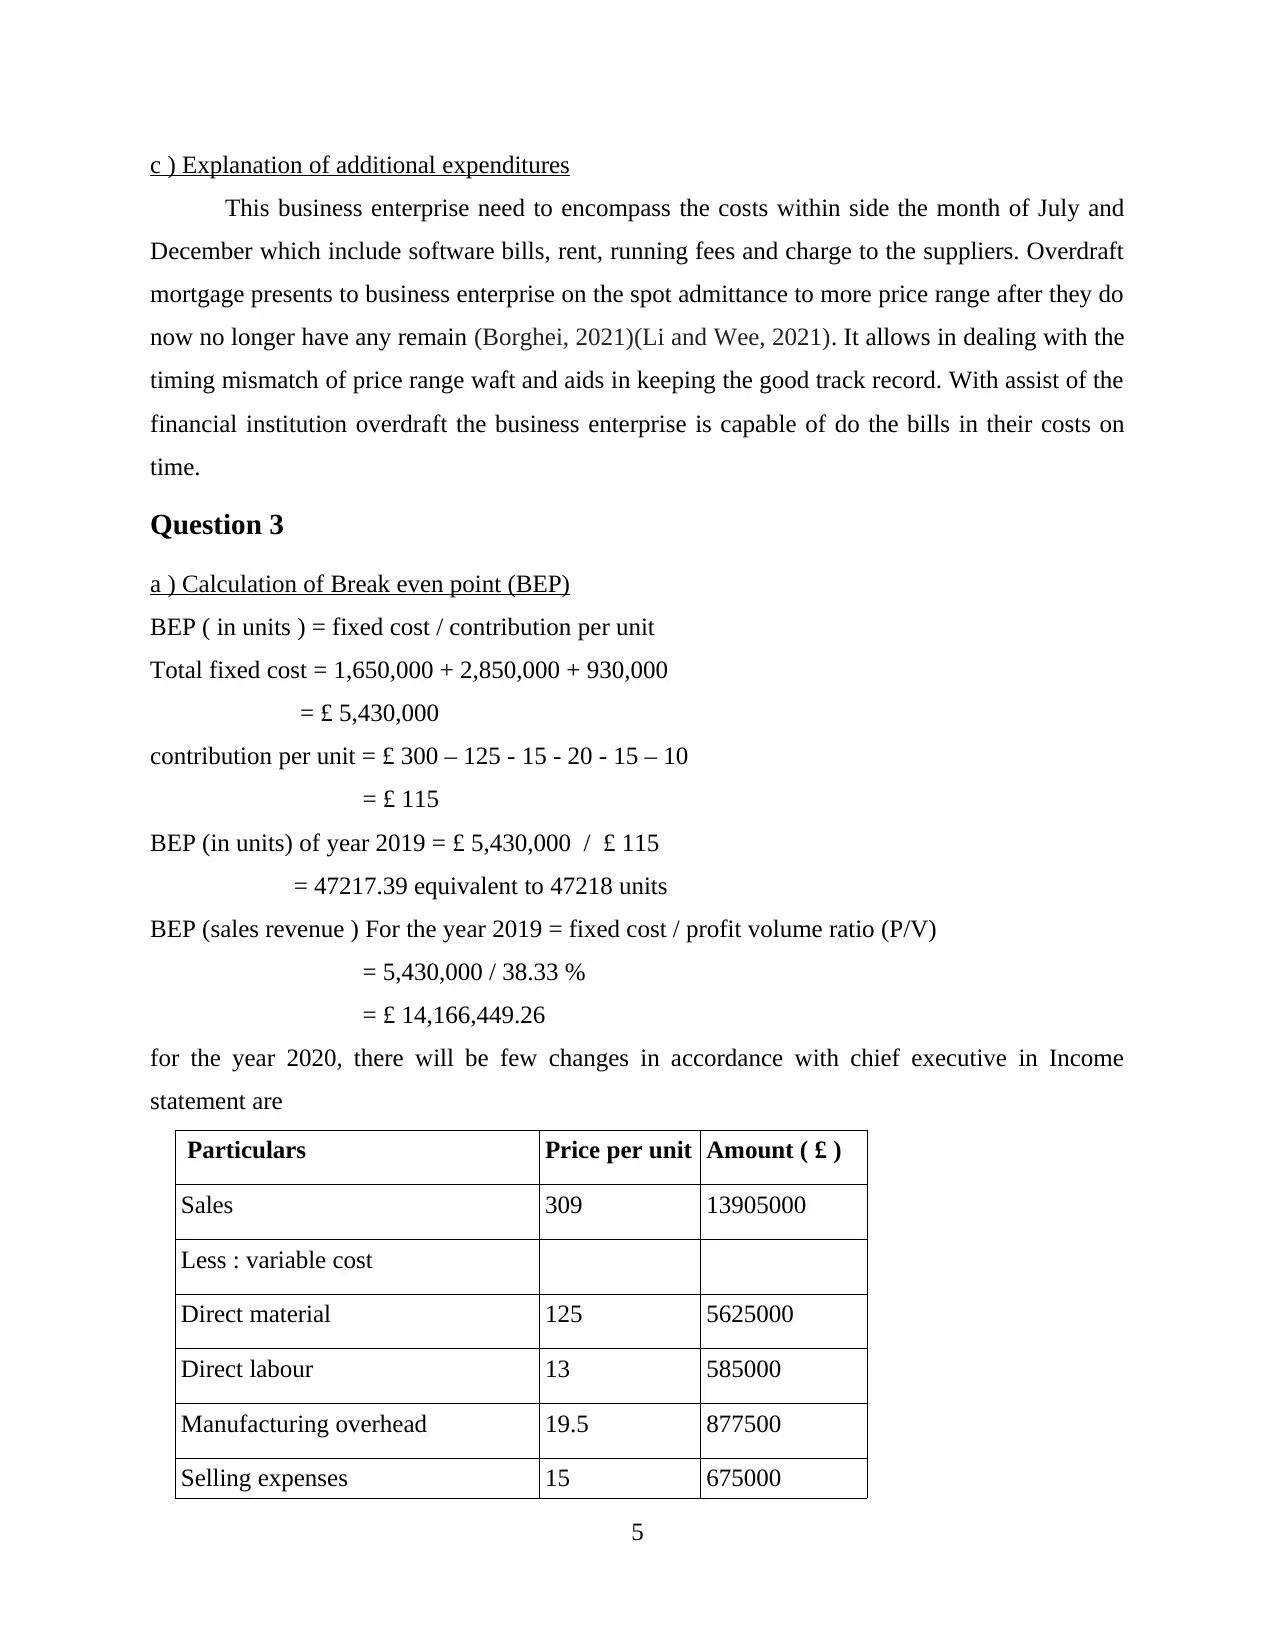
a ) Calculation of Break even point (BEP)
BEP ( in units ) = fixed cost / contribution per unit
Total fixed cost = 1,650,000 + 2,850,000 + 930,000
= £ 5,430,000
contribution per unit = £ 300 – 125 - 15 - 20 - 15 – 10
= £ 115
BEP (in units) of year 2019 = £ 5,430,000 / £ 115
= 47217.39 equivalent to 47218 units
BEP (sales revenue ) For the year 2019 = fixed cost / profit volume ratio (P/V)
= 5,430,000 / 38.33 %
= £ 14,166,449.26
for the year 2020, there will be few changes in accordance with chief executive in Income
statement are
Particulars Price per unit Amount ( £ )
Sales 309 13905000
Less : variable cost
Direct material 125 5625000
Direct labour 13 585000
Manufacturing overhead 19.5 877500
Selling expenses 15 675000
5
This business enterprise need to encompass the costs within side the month of July and
December which include software bills, rent, running fees and charge to the suppliers. Overdraft
mortgage presents to business enterprise on the spot admittance to more price range after they do
now no longer have any remain (Borghei, 2021)(Li and Wee, 2021). It allows in dealing with the
timing mismatch of price range waft and aids in keeping the good track record. With assist of the
financial institution overdraft the business enterprise is capable of do the bills in their costs on
time.
Question 3
a ) Calculation of Break even point (BEP)
BEP ( in units ) = fixed cost / contribution per unit
Total fixed cost = 1,650,000 + 2,850,000 + 930,000
= £ 5,430,000
contribution per unit = £ 300 – 125 - 15 - 20 - 15 – 10
= £ 115
BEP (in units) of year 2019 = £ 5,430,000 / £ 115
= 47217.39 equivalent to 47218 units
BEP (sales revenue ) For the year 2019 = fixed cost / profit volume ratio (P/V)
= 5,430,000 / 38.33 %
= £ 14,166,449.26
for the year 2020, there will be few changes in accordance with chief executive in Income
statement are
Particulars Price per unit Amount ( £ )
Sales 309 13905000
Less : variable cost
Direct material 125 5625000
Direct labour 13 585000
Manufacturing overhead 19.5 877500
Selling expenses 15 675000
5
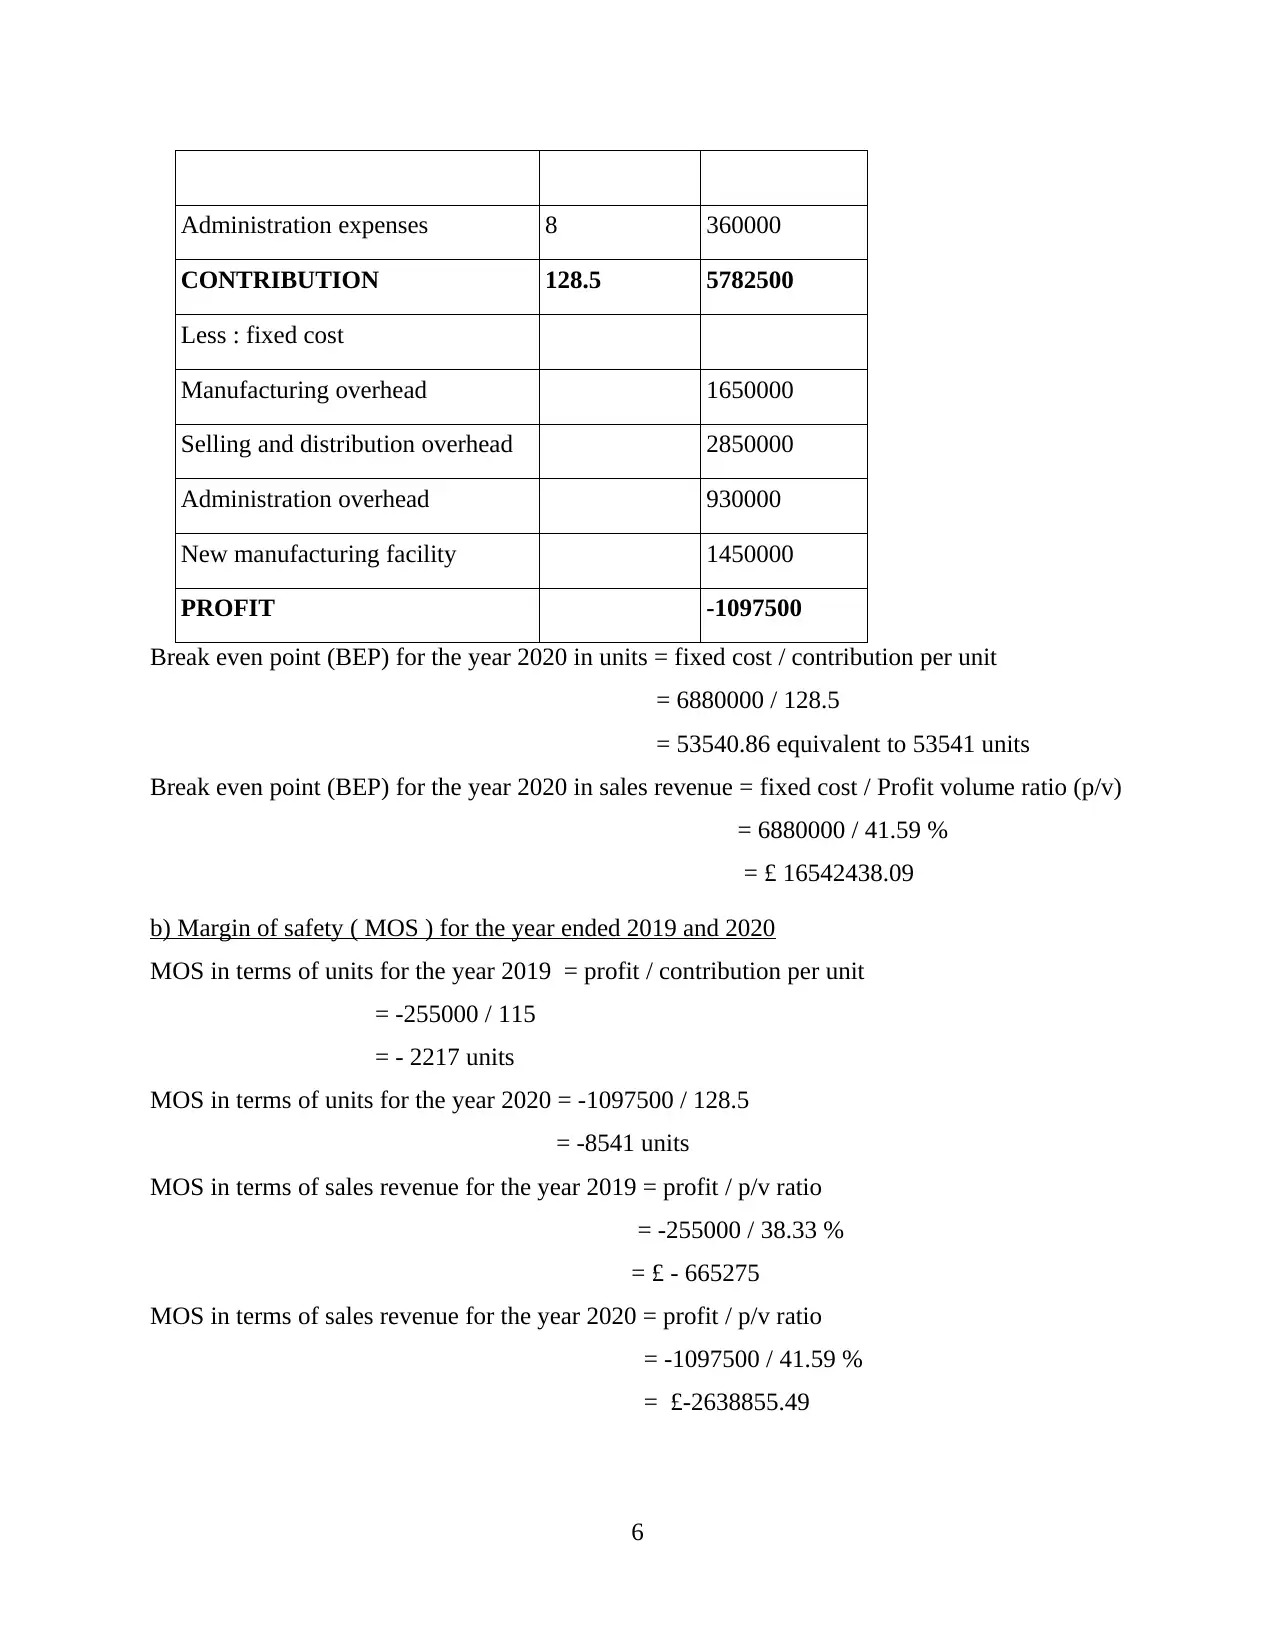
Administration expenses 8 360000
CONTRIBUTION 128.5 5782500
Less : fixed cost
Manufacturing overhead 1650000
Selling and distribution overhead 2850000
Administration overhead 930000
New manufacturing facility 1450000
PROFIT -1097500
Break even point (BEP) for the year 2020 in units = fixed cost / contribution per unit
= 6880000 / 128.5
= 53540.86 equivalent to 53541 units
Break even point (BEP) for the year 2020 in sales revenue = fixed cost / Profit volume ratio (p/v)
= 6880000 / 41.59 %
= £ 16542438.09
b) Margin of safety ( MOS ) for the year ended 2019 and 2020
MOS in terms of units for the year 2019 = profit / contribution per unit
= -255000 / 115
= - 2217 units
MOS in terms of units for the year 2020 = -1097500 / 128.5
= -8541 units
MOS in terms of sales revenue for the year 2019 = profit / p/v ratio
= -255000 / 38.33 %
= £ - 665275
MOS in terms of sales revenue for the year 2020 = profit / p/v ratio
= -1097500 / 41.59 %
= £-2638855.49
6
⊘ This is a preview!⊘
Do you want full access?
Subscribe today to unlock all pages.
Trusted by 1+ million students worldwide
c) Discussion of the new strategy that has been formed by Jessica
From the above computations, there conducted analysis of two strategy first BEP and
second is MOS for the two years 2019 and 2020. The BEP of old strategy and new strategy in
terms of output produced 47218 units and 53541 units approximately. When it comes to Margin
of safety in terms of output for both the years 2019 and 2020 are -2217 units and -8541 units
respectively. And when in term of sales revenue the Break even point would be £ 14,166,449.26
and £ 16542438.09 respectively. In Margin of safety in term of sales revenue for both year would
be £ - 665275 and £-2638855.49 respectively. They need to enhance their sales and need to
boost their growth through sales promotion and other promoting tools (Daugaard, 2020). For
achieving additional growth, they already spent 1,450,000 on fixed cost which is very high
mainly this the reason of occurring loss.
Question 4
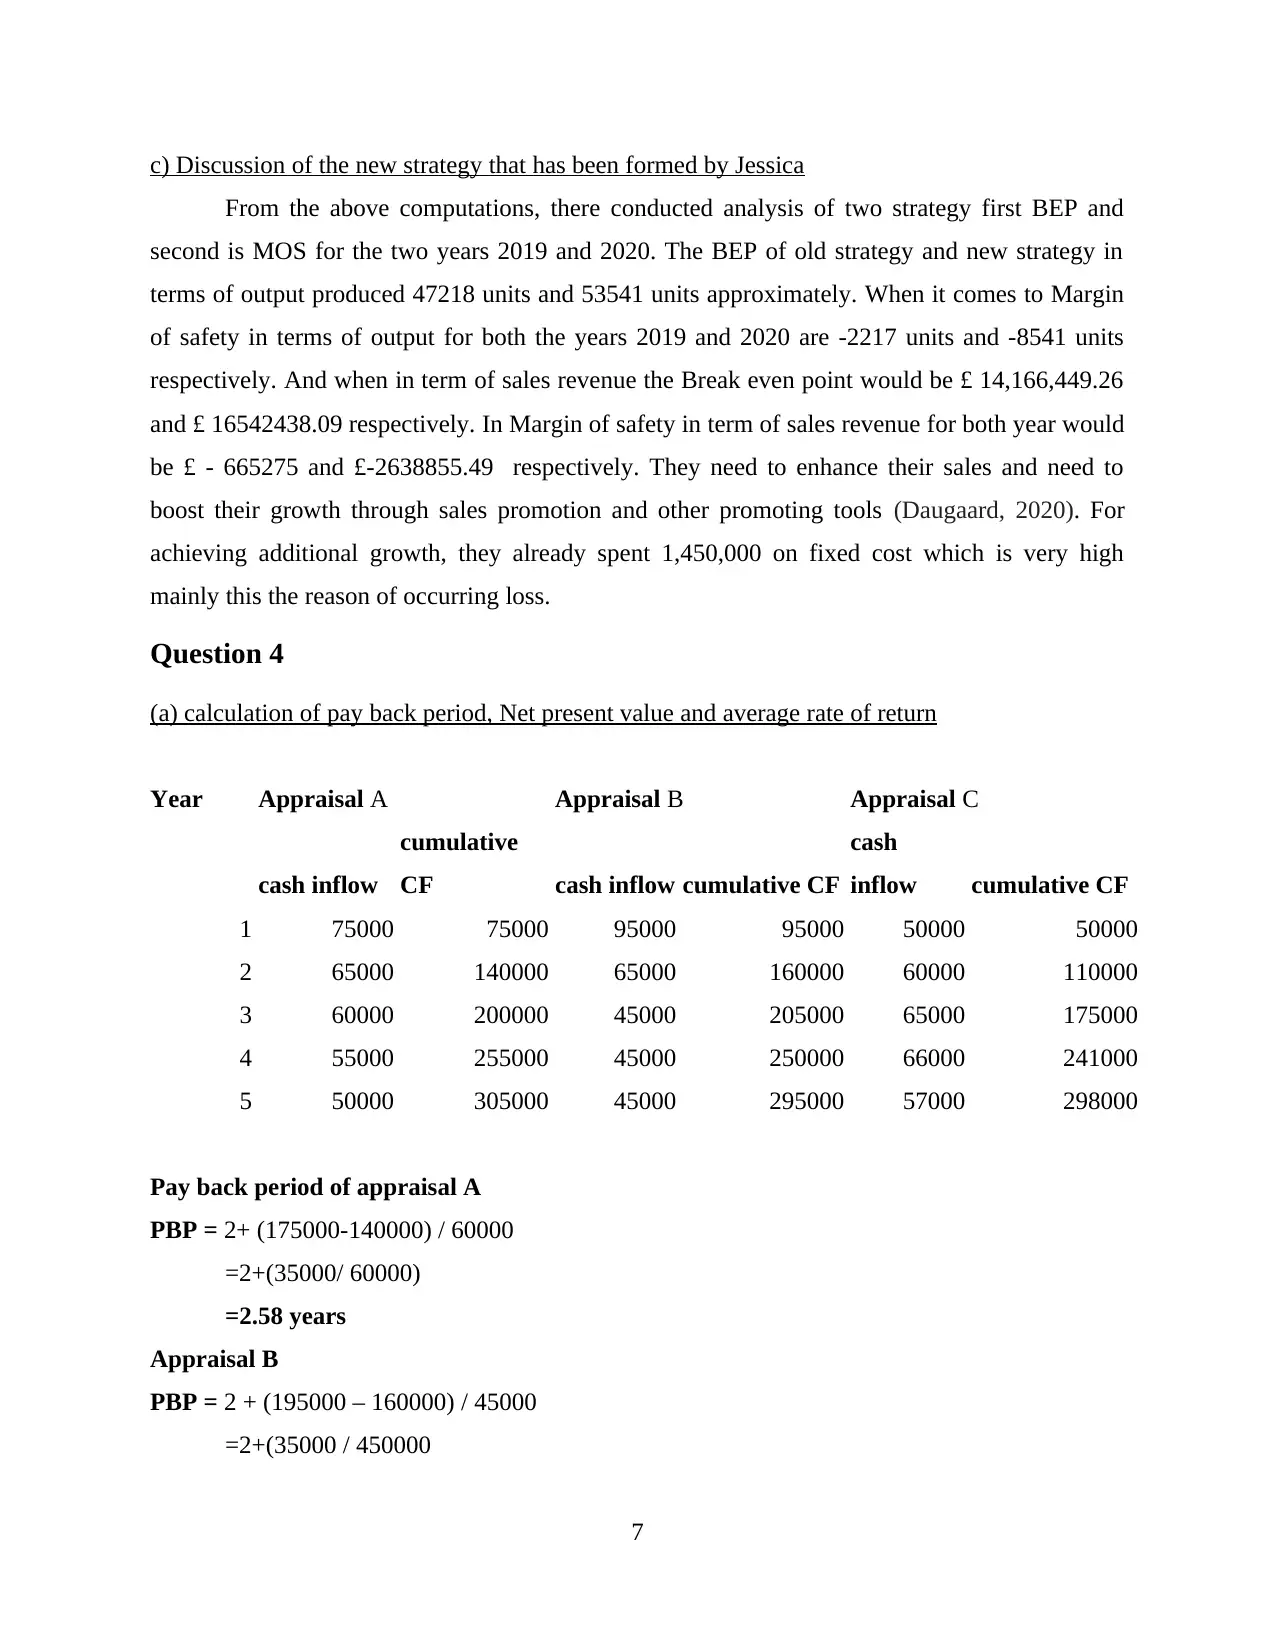
(a) calculation of pay back period, Net present value and average rate of return
Year Appraisal A Appraisal B Appraisal C
cash inflow
cumulative
CF cash inflow cumulative CF
cash
inflow cumulative CF
1 75000 75000 95000 95000 50000 50000
2 65000 140000 65000 160000 60000 110000
3 60000 200000 45000 205000 65000 175000
4 55000 255000 45000 250000 66000 241000
5 50000 305000 45000 295000 57000 298000
Pay back period of appraisal A
PBP = 2+ (175000-140000) / 60000
=2+(35000/ 60000)
=2.58 years
Appraisal B
PBP = 2 + (195000 – 160000) / 45000
=2+(35000 / 450000
7
From the above computations, there conducted analysis of two strategy first BEP and
second is MOS for the two years 2019 and 2020. The BEP of old strategy and new strategy in
terms of output produced 47218 units and 53541 units approximately. When it comes to Margin
of safety in terms of output for both the years 2019 and 2020 are -2217 units and -8541 units
respectively. And when in term of sales revenue the Break even point would be £ 14,166,449.26
and £ 16542438.09 respectively. In Margin of safety in term of sales revenue for both year would
be £ - 665275 and £-2638855.49 respectively. They need to enhance their sales and need to
boost their growth through sales promotion and other promoting tools (Daugaard, 2020). For
achieving additional growth, they already spent 1,450,000 on fixed cost which is very high
mainly this the reason of occurring loss.
Question 4
(a) calculation of pay back period, Net present value and average rate of return
Year Appraisal A Appraisal B Appraisal C
cash inflow
cumulative
CF cash inflow cumulative CF
cash
inflow cumulative CF
1 75000 75000 95000 95000 50000 50000
2 65000 140000 65000 160000 60000 110000
3 60000 200000 45000 205000 65000 175000
4 55000 255000 45000 250000 66000 241000
5 50000 305000 45000 295000 57000 298000
Pay back period of appraisal A
PBP = 2+ (175000-140000) / 60000
=2+(35000/ 60000)
=2.58 years
Appraisal B
PBP = 2 + (195000 – 160000) / 45000
=2+(35000 / 450000
7
Paraphrase This Document
Need a fresh take? Get an instant paraphrase of this document with our AI Paraphraser
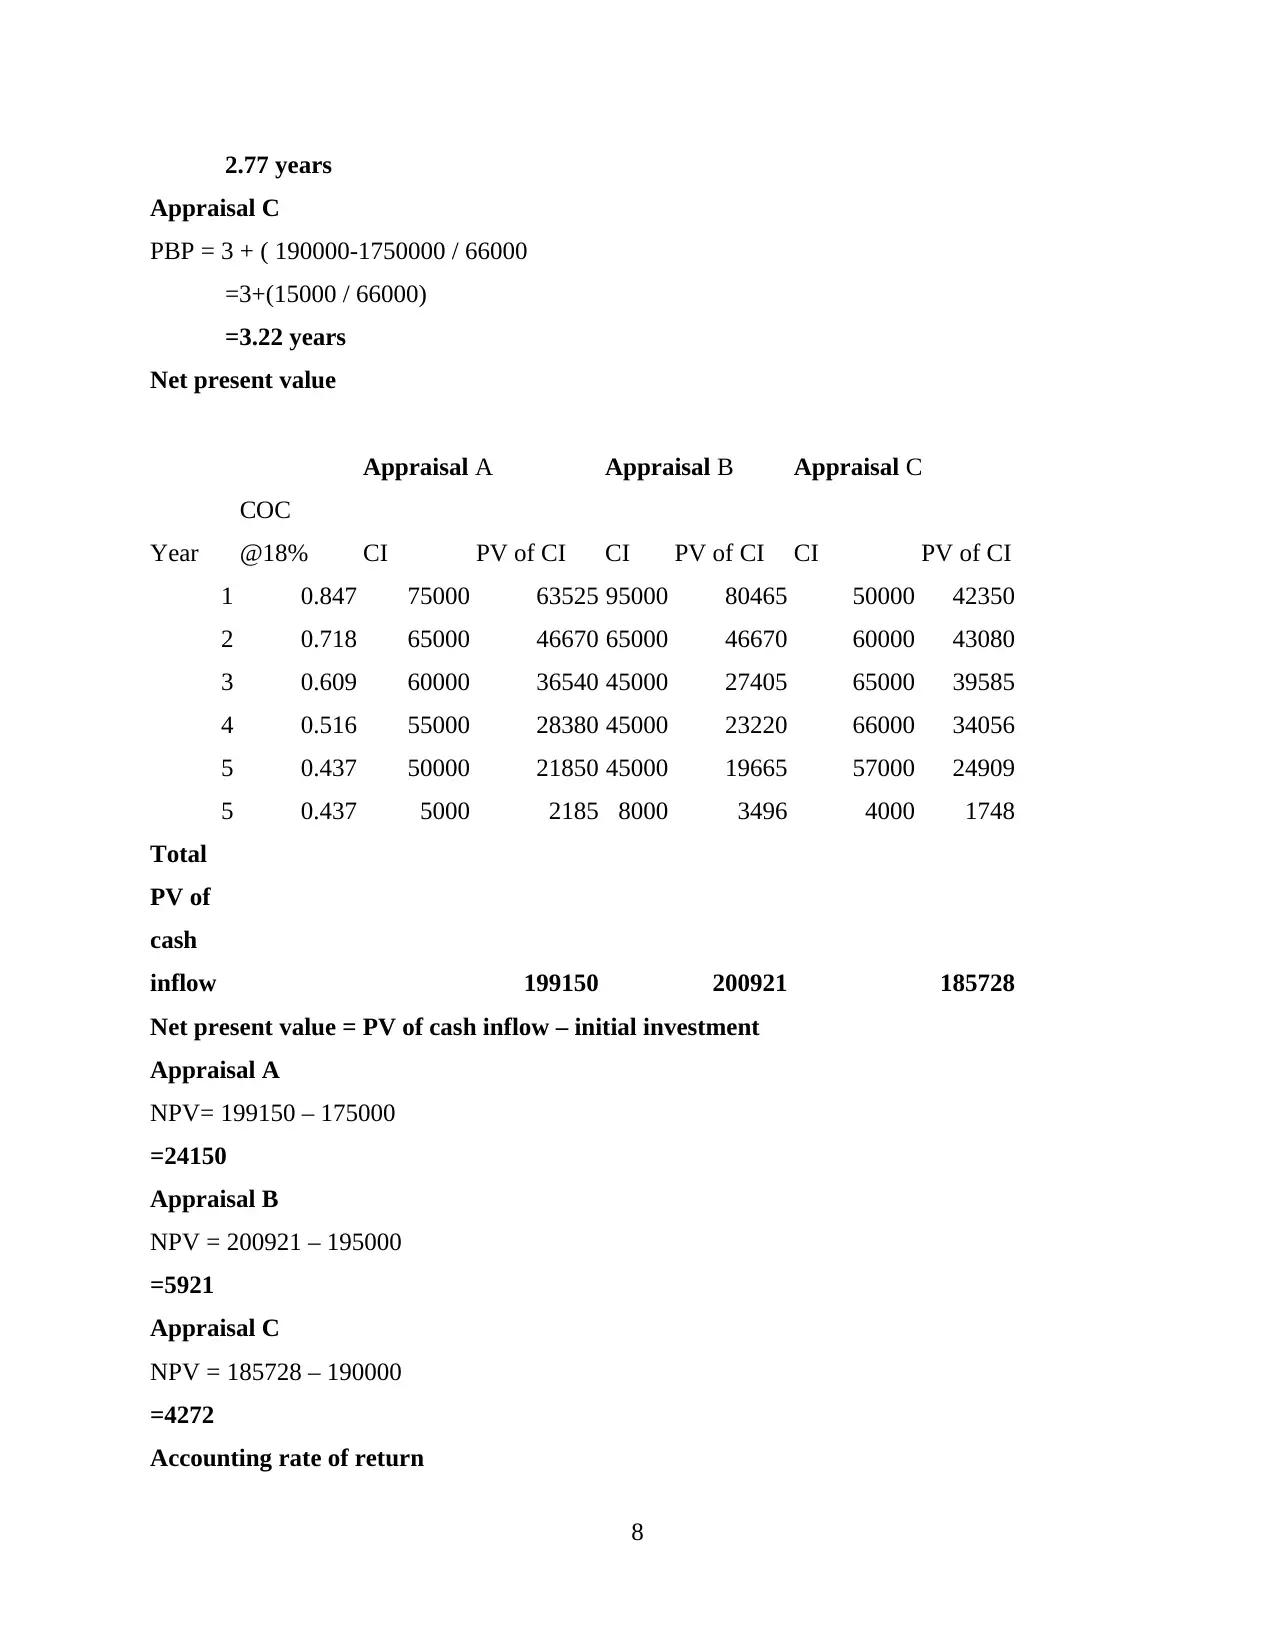
2.77 years
Appraisal C
PBP = 3 + ( 190000-1750000 / 66000
=3+(15000 / 66000)
=3.22 years
Net present value
Appraisal A Appraisal B Appraisal C
Year
COC
@18% CI PV of CI CI PV of CI CI PV of CI
1 0.847 75000 63525 95000 80465 50000 42350
2 0.718 65000 46670 65000 46670 60000 43080
3 0.609 60000 36540 45000 27405 65000 39585
4 0.516 55000 28380 45000 23220 66000 34056
5 0.437 50000 21850 45000 19665 57000 24909
5 0.437 5000 2185 8000 3496 4000 1748
Total
PV of
cash
inflow 199150 200921 185728
Net present value = PV of cash inflow – initial investment
Appraisal A
NPV= 199150 – 175000
=24150
Appraisal B
NPV = 200921 – 195000
=5921
Appraisal C
NPV = 185728 – 190000
=4272
Accounting rate of return
8
Appraisal C
PBP = 3 + ( 190000-1750000 / 66000
=3+(15000 / 66000)
=3.22 years
Net present value
Appraisal A Appraisal B Appraisal C
Year
COC
@18% CI PV of CI CI PV of CI CI PV of CI
1 0.847 75000 63525 95000 80465 50000 42350
2 0.718 65000 46670 65000 46670 60000 43080
3 0.609 60000 36540 45000 27405 65000 39585
4 0.516 55000 28380 45000 23220 66000 34056
5 0.437 50000 21850 45000 19665 57000 24909
5 0.437 5000 2185 8000 3496 4000 1748
Total
PV of
cash
inflow 199150 200921 185728
Net present value = PV of cash inflow – initial investment
Appraisal A
NPV= 199150 – 175000
=24150
Appraisal B
NPV = 200921 – 195000
=5921
Appraisal C
NPV = 185728 – 190000
=4272
Accounting rate of return
8
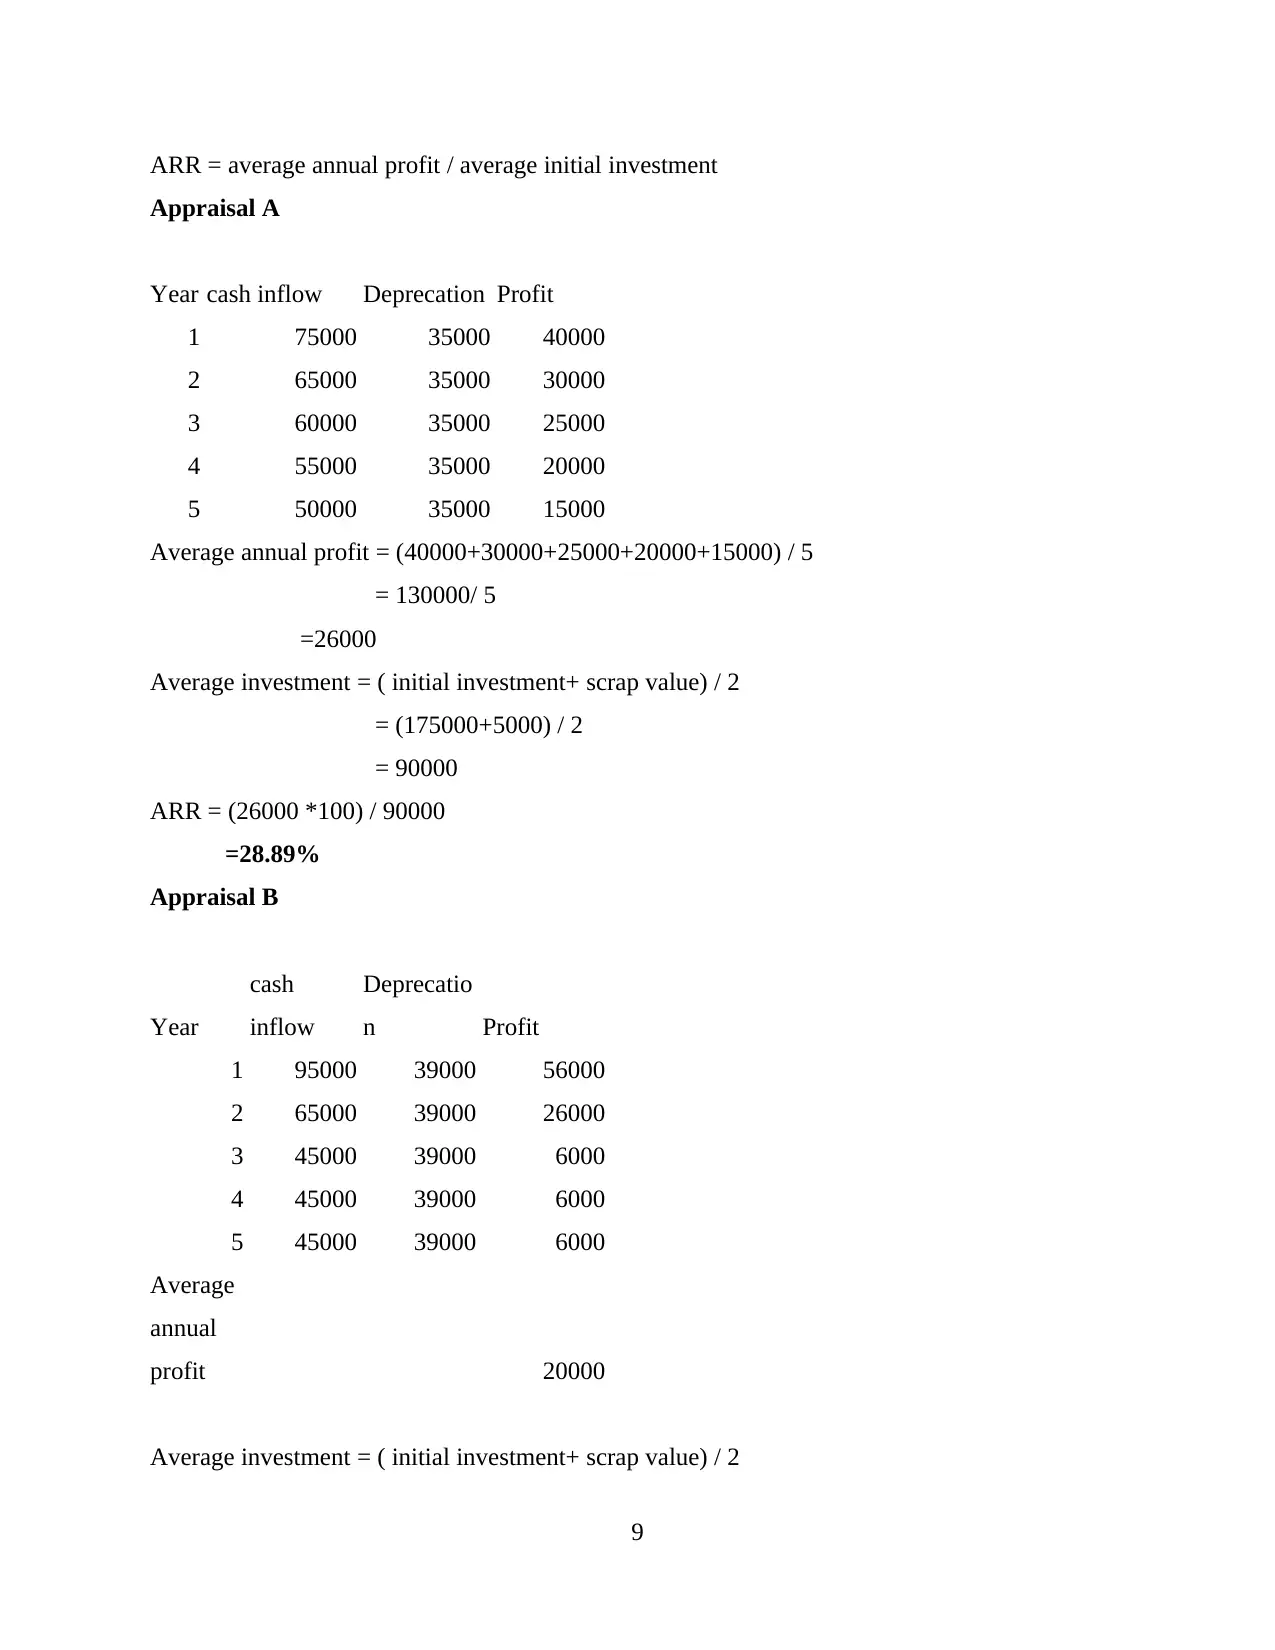
ARR = average annual profit / average initial investment
Appraisal A
Year cash inflow Deprecation Profit
1 75000 35000 40000
2 65000 35000 30000
3 60000 35000 25000
4 55000 35000 20000
5 50000 35000 15000
Average annual profit = (40000+30000+25000+20000+15000) / 5
= 130000/ 5
=26000
Average investment = ( initial investment+ scrap value) / 2
= (175000+5000) / 2
= 90000
ARR = (26000 *100) / 90000
=28.89%
Appraisal B
Year
cash
inflow
Deprecatio
n Profit
1 95000 39000 56000
2 65000 39000 26000
3 45000 39000 6000
4 45000 39000 6000
5 45000 39000 6000
Average
annual
profit 20000
Average investment = ( initial investment+ scrap value) / 2
9
⊘ This is a preview!⊘
Do you want full access?
Subscribe today to unlock all pages.
Trusted by 1+ million students worldwide
1 out of 17
Related Documents


Your All-in-One AI-Powered Toolkit for Academic Success.
+13062052269
info@desklib.com
Available 24*7 on WhatsApp / Email
![[object Object]](/_next/static/media/star-bottom.7253800d.svg)
Unlock your academic potential
Copyright © 2020–2026 A2Z Services. All Rights Reserved. Developed and managed by ZUCOL.