Financial Statement Analysis & Report: Care Pharmacy Group Berhad
VerifiedAdded on 2023/04/19
|12
|2139
|152
Report
AI Summary
This report provides a comprehensive financial analysis of Care Pharmacy Group Berhad for the years 2017 and 2018, utilizing ratio analysis to assess the company's financial health. It begins with an introduction to the company and the significance of financial statements, followed by a detailed examination of profitability, liquidity, efficiency, and solvency through various financial ratios. Comparative graphs illustrate the changes in the company's financial position, highlighting improvements in liquidity and margin ratios, alongside declines in efficiency ratios. The analysis concludes with a recommendation to invest in Care Pharmacy Group Berhad, based on its overall financial stability and positive trends. The report references relevant financial literature and includes an appendix with key financial data.

BUSINESS MANAGEMENT
Paraphrase This Document
Need a fresh take? Get an instant paraphrase of this document with our AI Paraphraser
REPORT 1
EXECUTIVE SUMMARY
The following work is aimed at exploring the financial statements of the Malaysian entity
Care Pharmacy Group Berhad. The significance of the financial statements lies in the fact
that these assist various stakeholders in various decisions such as investing, regulating,
business, and others. The work introduces the company and the concept of preparation of
financial statements. The ratio analysis, its various forms are highlighted in relation to the
company. The comparative graphs for the years 2018 and 2017 represent that overall
financial position of the Care Pharmacy Group Berhad has improved from last year. The
liquidity position of the entity is extremely satisfactory. The declines in efficiency ratios and
the increment in the margin ratios back the financial stability of the company. Therefore, it is
recommended to invest in the company.
REPORT 2
Contents
INTRODUCTION......................................................................................................................3
ANALYSIS OF FINANCIAL STATEMENTS: PRACTICAL APPLICATION.....................4
Ratio Analysis.......................................................................................................................4
Profitability.......................................................................................................................4
Liquidity or the Working Capital Management...........................................................5
Efficiency...........................................................................................................................6
Solvency.............................................................................................................................7
CONCLUSION AND RECOMMENDATION.........................................................................7
⊘ This is a preview!⊘
Do you want full access?
Subscribe today to unlock all pages.
Trusted by 1+ million students worldwide
REPORT 3
INTRODUCTION
The company Care Pharmacy Group Berhad is a popular Malaysian company and is a
investment holding company. The entity was founded in the year 1994 and the headquarters
are located at Petaling Jaya, Malaysia. The chief operation of the company is management
and operation of the community pharmacies (Care Pharmacy Group Berhad, 2018). The
company carries on its objectives under the brand name of CARiNG in Malaysia. The
business includes the retail of products namely the healthcare, pharmaceutical and the
personal care. The following report is aimed at analysing the financial performance of the
company for the year 2017 and 2018. The analysis would be done with the help of
computation of the various financial ratios and evaluating the results thereof. In addition, the
report will include a conclusion as to whether one should invest in the chosen company based
on the various financial vitals.
FINANCIAL ANALYSIS OF THE COMPANY USING THE FINANCIAL RATIOS
Financial statements render the base to take a number of strategic, business and investing
decisions (Fabozzi and Drake, 2009). Various stakeholders are looking for various kinds of
information. While the long terms lenders are keen to know the lending, buying capacity and
the capital structure, the regulators are interested to know the compliance of the applicable
accounting framework and industrial statutes. Thus, before making the business decisions, the
stakeholders must analyse the statements according to their needs and present economic,
industrial scenario. It is significant to note that the various accounting frameworks prescribe
the use of the comparative format while presenting results, to enable evaluation.
A number of techniques have been devised for performing financial analysis of the entities.
One such technique is the computation of ratios. The ratio analysis aids the stakeholders and
experts to gain an insight of the efficiency, liquidity, profitability, and solvency positions of a
company (Fridson and Alvarez, 2011).
Paraphrase This Document
Need a fresh take? Get an instant paraphrase of this document with our AI Paraphraser
REPORT 4
ANALYSIS OF FINANCIAL STATEMENTS: PRACTICAL
APPLICATION
Ratio Analysis
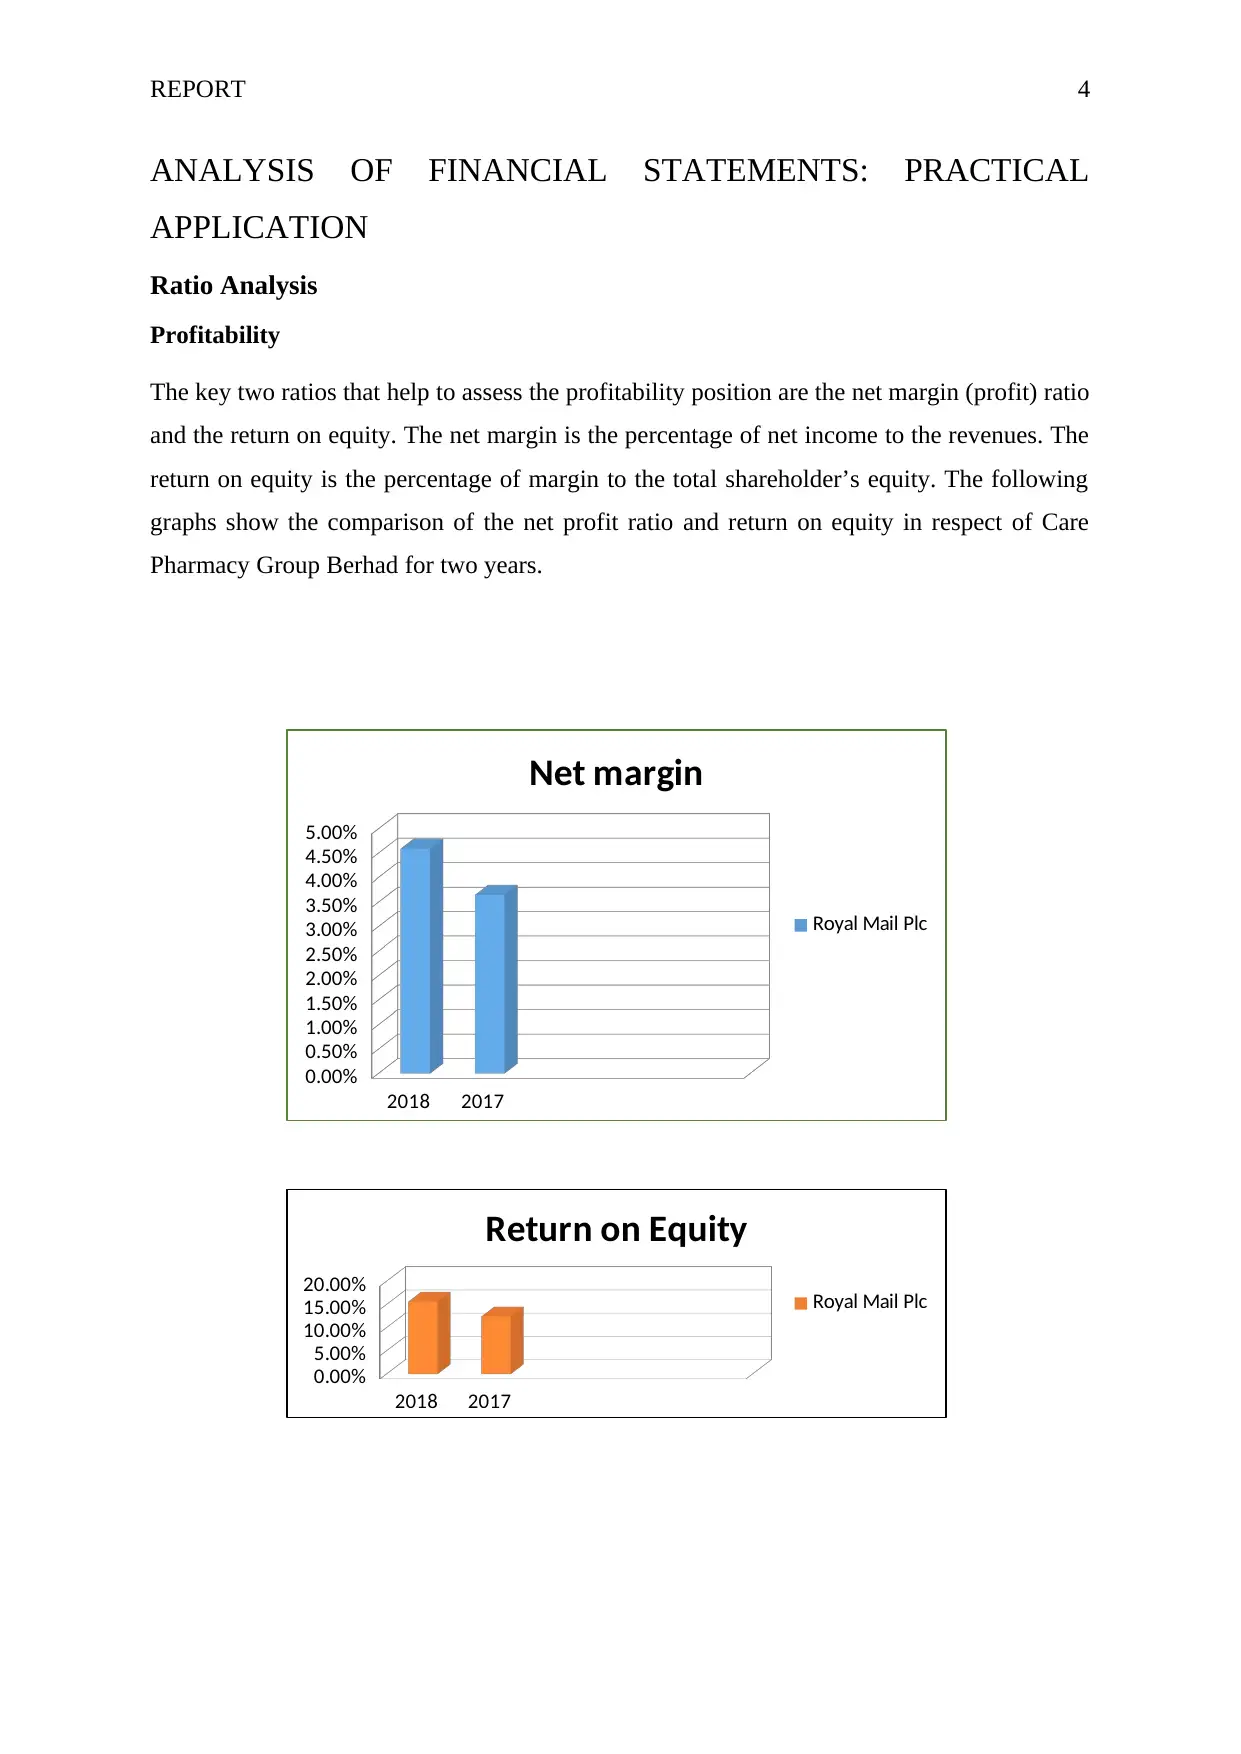
Profitability
The key two ratios that help to assess the profitability position are the net margin (profit) ratio
and the return on equity. The net margin is the percentage of net income to the revenues. The
return on equity is the percentage of margin to the total shareholder’s equity. The following
graphs show the comparison of the net profit ratio and return on equity in respect of Care
Pharmacy Group Berhad for two years.
2018 2017
0.00%
0.50%
1.00%
1.50%
2.00%
2.50%
3.00%
3.50%
4.00%
4.50%
5.00%
Net margin
Royal Mail Plc
2018 2017
0.00%
5.00%
10.00%
15.00%
20.00%
Return on Equity
Royal Mail Plc
ANALYSIS OF FINANCIAL STATEMENTS: PRACTICAL
APPLICATION
Ratio Analysis
Profitability
The key two ratios that help to assess the profitability position are the net margin (profit) ratio
and the return on equity. The net margin is the percentage of net income to the revenues. The
return on equity is the percentage of margin to the total shareholder’s equity. The following
graphs show the comparison of the net profit ratio and return on equity in respect of Care
Pharmacy Group Berhad for two years.
2018 2017
0.00%
0.50%
1.00%
1.50%
2.00%
2.50%
3.00%
3.50%
4.00%
4.50%
5.00%
Net margin
Royal Mail Plc
2018 2017
0.00%
5.00%
10.00%
15.00%
20.00%
Return on Equity
Royal Mail Plc
REPORT 5
As depicted in the graphs, the entity’s net margin has improved. The margin was 3.65 percent
in the year 2017 and it increased to 4.59 percent in 2018. The reason for the same can be
stated to be the increased revenues and the simultaneous decrease in the finance costs for the
entity. In addition, it must be noted that with the increase in revenue, the administrative,
selling and other expenses also increased but at a marginally slower pace. The benefit of
which is visible in the net margin ration and the return on equity as well. The return on equity
increased from 12.39 percent to 15.60 percent in the year 2018.
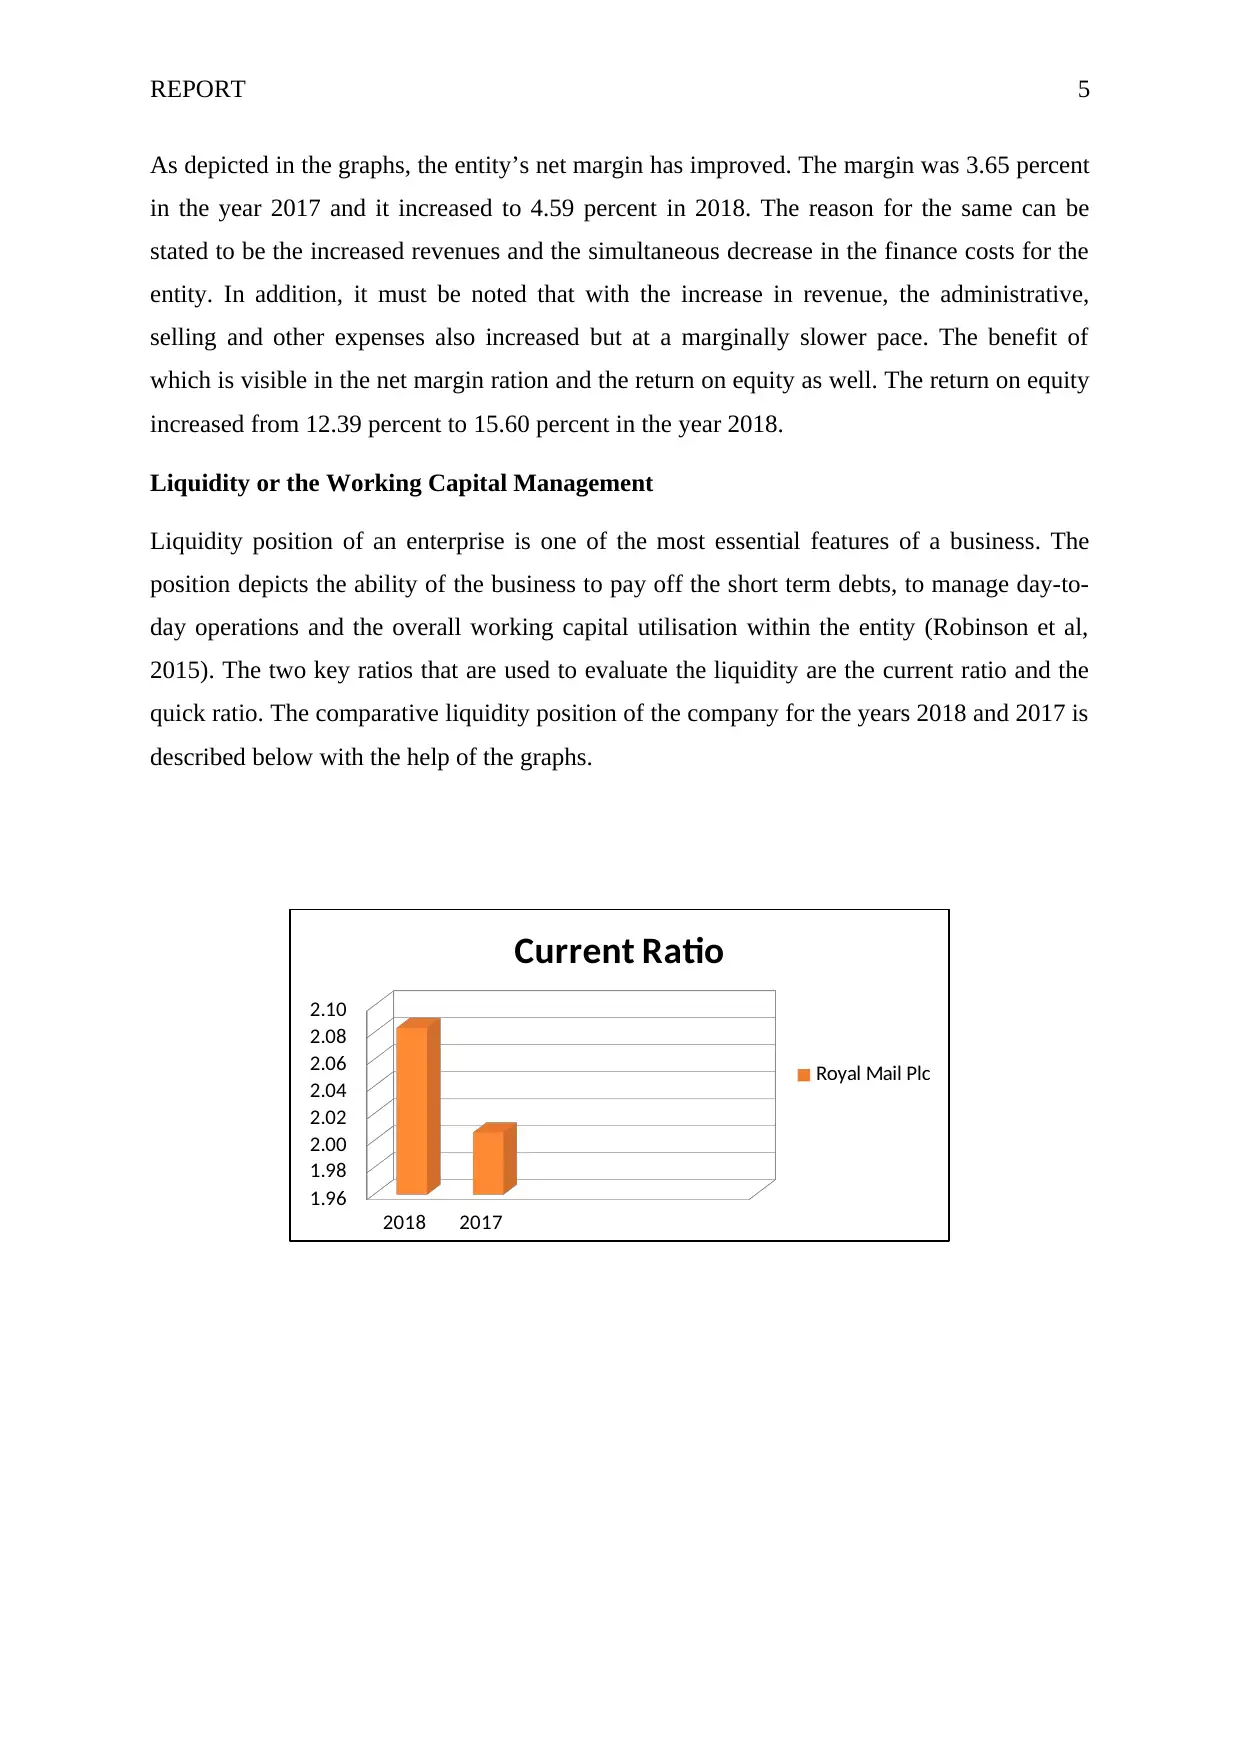
Liquidity or the Working Capital Management
Liquidity position of an enterprise is one of the most essential features of a business. The
position depicts the ability of the business to pay off the short term debts, to manage day-to-
day operations and the overall working capital utilisation within the entity (Robinson et al,
2015). The two key ratios that are used to evaluate the liquidity are the current ratio and the
quick ratio. The comparative liquidity position of the company for the years 2018 and 2017 is
described below with the help of the graphs.
2018 2017
1.96
1.98
2.00
2.02
2.04
2.06
2.08
2.10
Current Ratio
Royal Mail Plc
As depicted in the graphs, the entity’s net margin has improved. The margin was 3.65 percent
in the year 2017 and it increased to 4.59 percent in 2018. The reason for the same can be
stated to be the increased revenues and the simultaneous decrease in the finance costs for the
entity. In addition, it must be noted that with the increase in revenue, the administrative,
selling and other expenses also increased but at a marginally slower pace. The benefit of
which is visible in the net margin ration and the return on equity as well. The return on equity
increased from 12.39 percent to 15.60 percent in the year 2018.
Liquidity or the Working Capital Management
Liquidity position of an enterprise is one of the most essential features of a business. The
position depicts the ability of the business to pay off the short term debts, to manage day-to-
day operations and the overall working capital utilisation within the entity (Robinson et al,
2015). The two key ratios that are used to evaluate the liquidity are the current ratio and the
quick ratio. The comparative liquidity position of the company for the years 2018 and 2017 is
described below with the help of the graphs.
2018 2017
1.96
1.98
2.00
2.02
2.04
2.06
2.08
2.10
Current Ratio
Royal Mail Plc
⊘ This is a preview!⊘
Do you want full access?
Subscribe today to unlock all pages.
Trusted by 1+ million students worldwide
REPORT 6
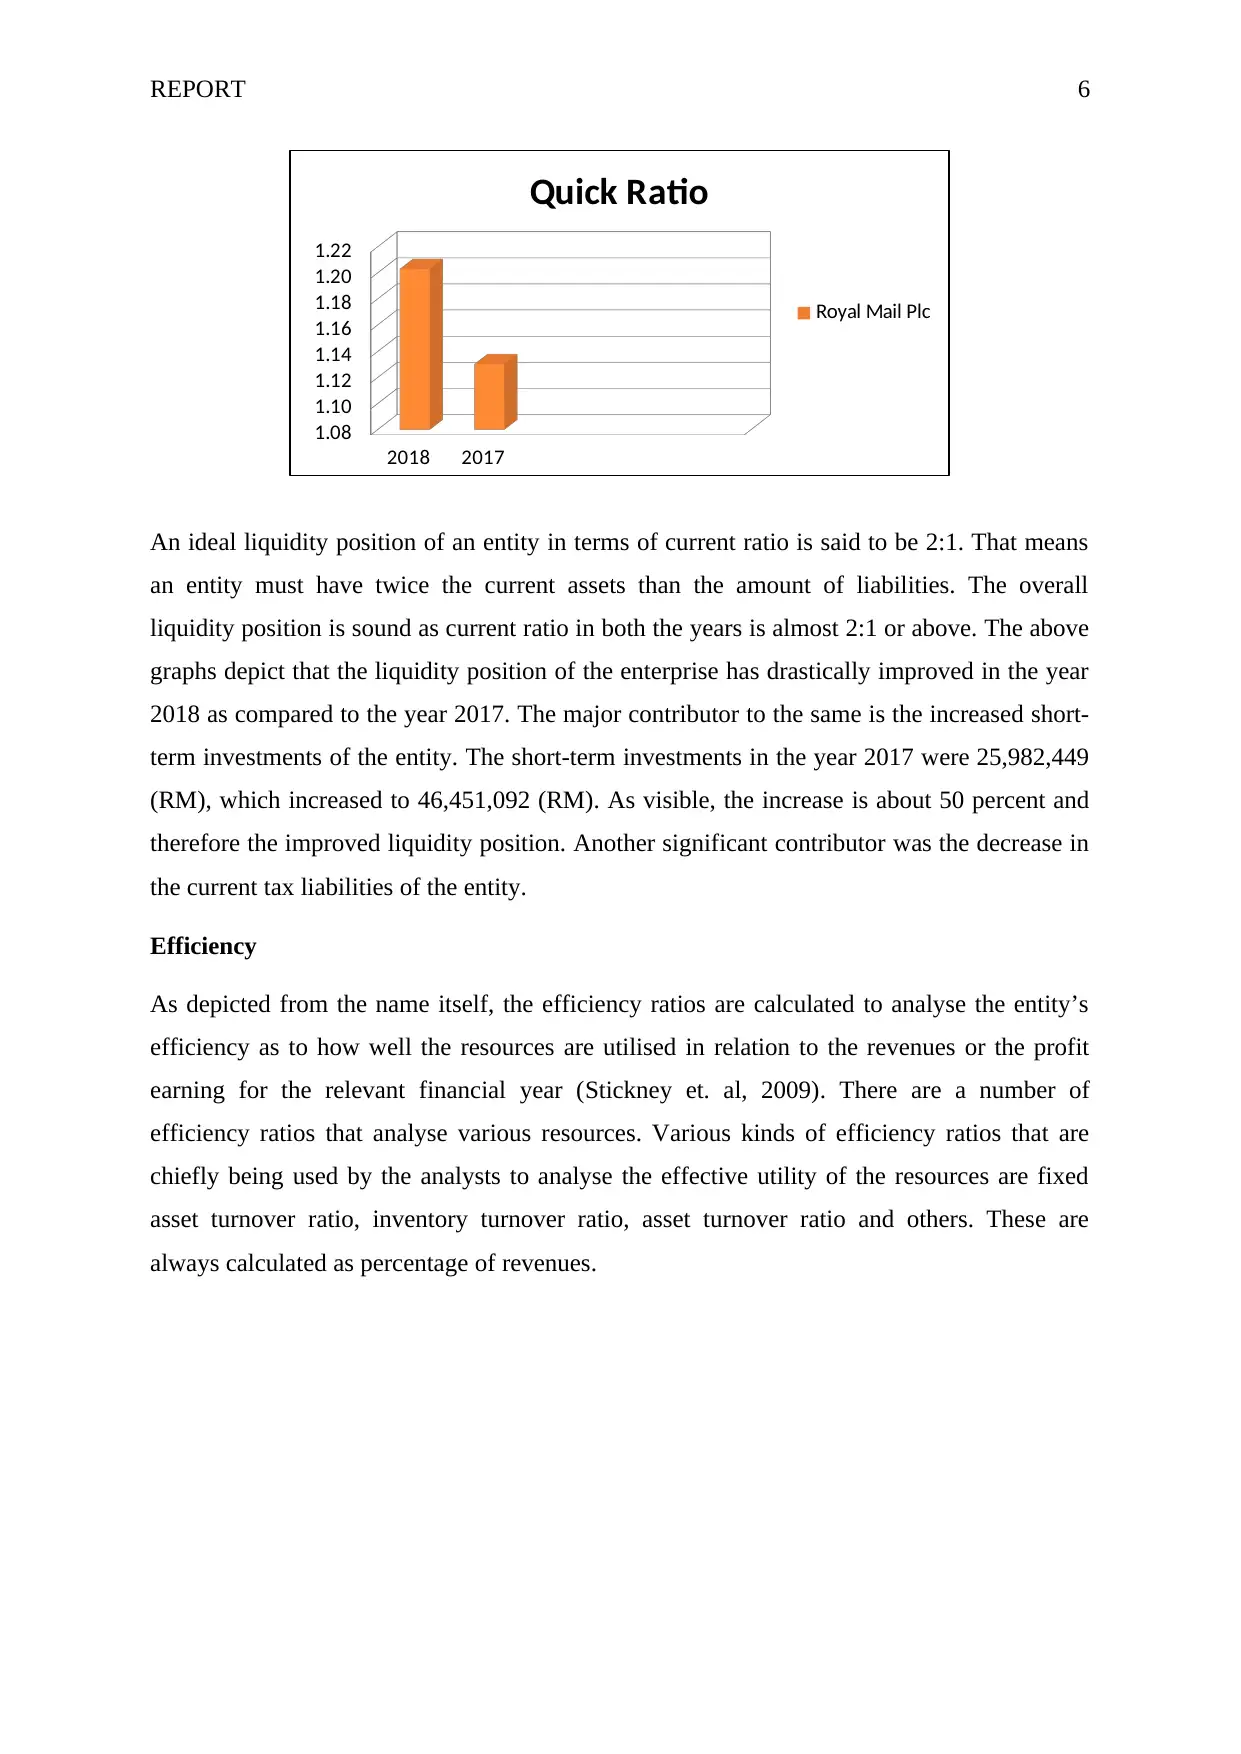
An ideal liquidity position of an entity in terms of current ratio is said to be 2:1. That means
an entity must have twice the current assets than the amount of liabilities. The overall
liquidity position is sound as current ratio in both the years is almost 2:1 or above. The above
graphs depict that the liquidity position of the enterprise has drastically improved in the year
2018 as compared to the year 2017. The major contributor to the same is the increased short-
term investments of the entity. The short-term investments in the year 2017 were 25,982,449
(RM), which increased to 46,451,092 (RM). As visible, the increase is about 50 percent and
therefore the improved liquidity position. Another significant contributor was the decrease in
the current tax liabilities of the entity.
Efficiency
As depicted from the name itself, the efficiency ratios are calculated to analyse the entity’s
efficiency as to how well the resources are utilised in relation to the revenues or the profit
earning for the relevant financial year (Stickney et. al, 2009). There are a number of
efficiency ratios that analyse various resources. Various kinds of efficiency ratios that are
chiefly being used by the analysts to analyse the effective utility of the resources are fixed
asset turnover ratio, inventory turnover ratio, asset turnover ratio and others. These are
always calculated as percentage of revenues.
2018 2017
1.08
1.10
1.12
1.14
1.16
1.18
1.20
1.22
Quick Ratio
Royal Mail Plc
Paraphrase This Document
Need a fresh take? Get an instant paraphrase of this document with our AI Paraphraser
REPORT 7
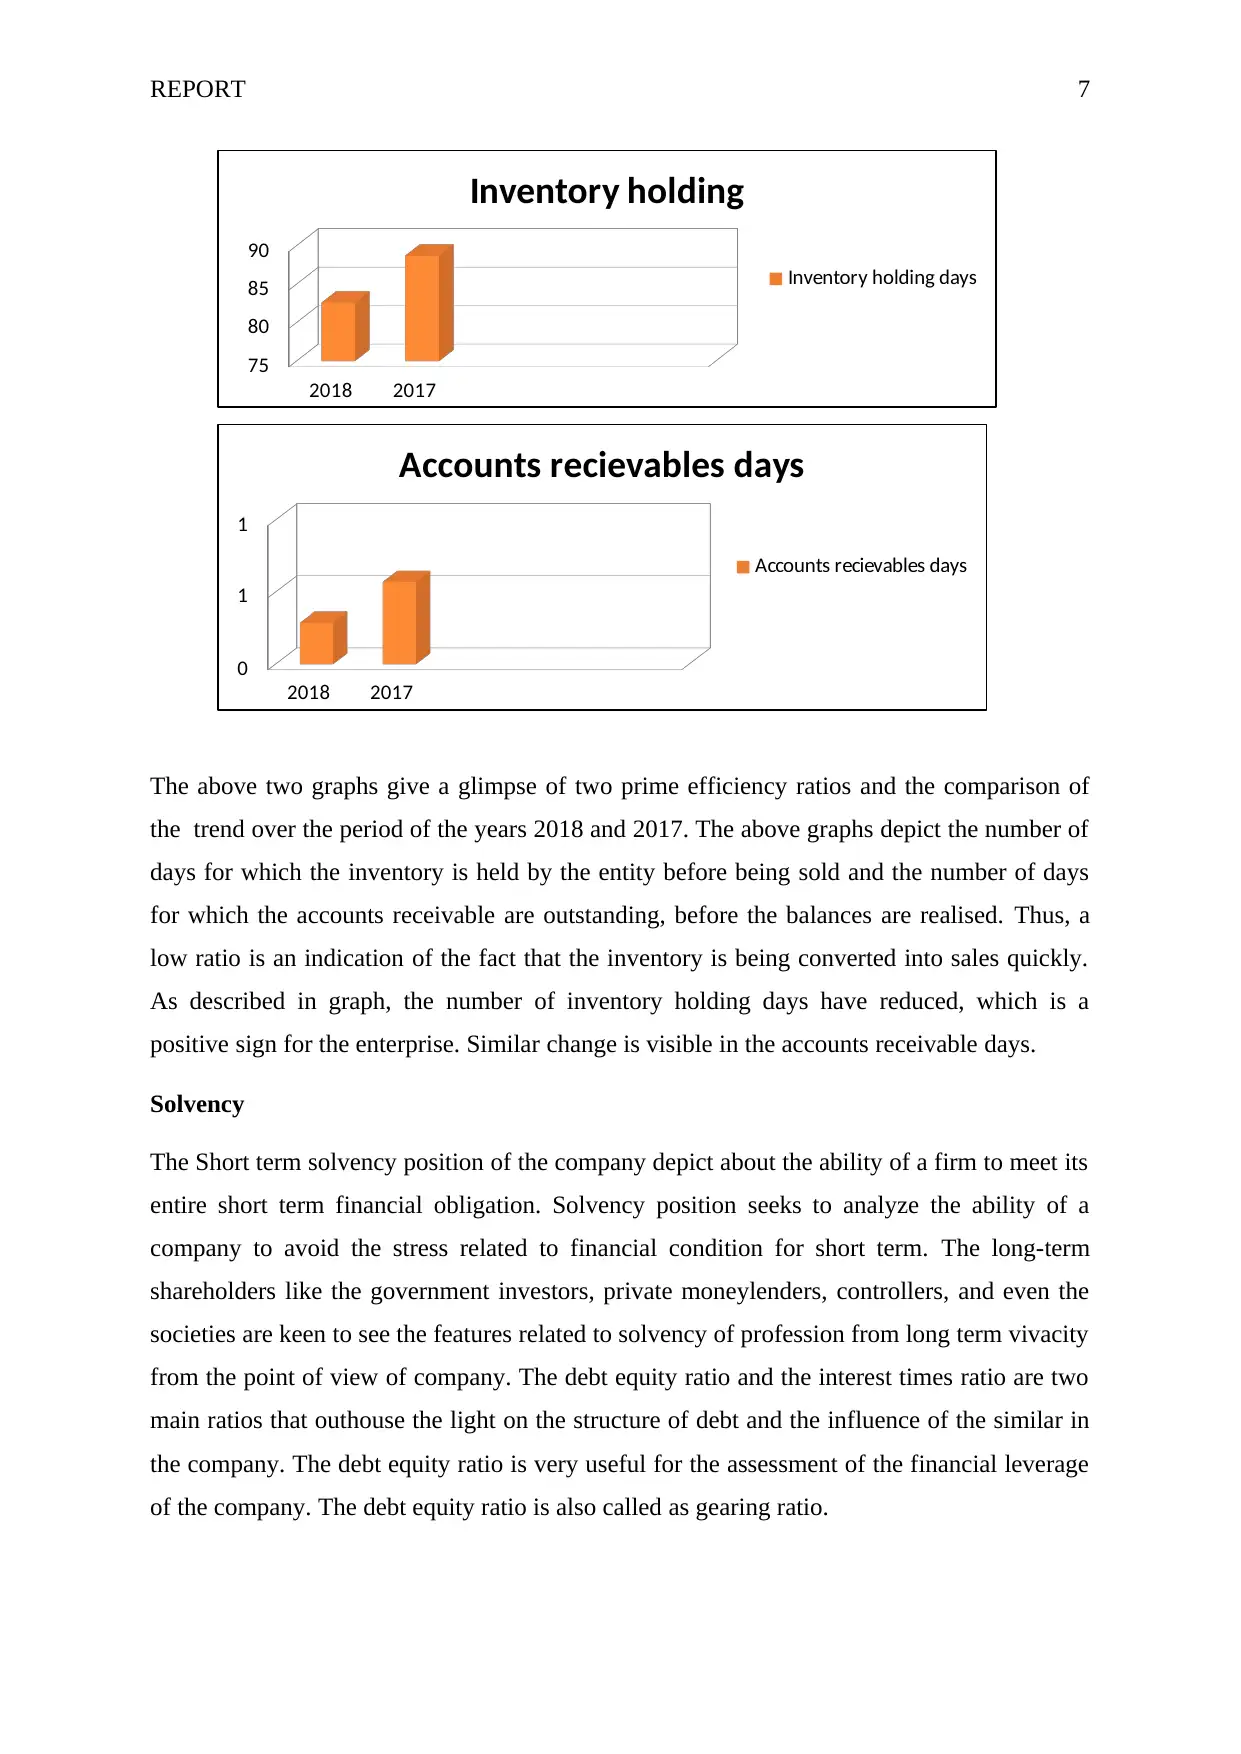
The above two graphs give a glimpse of two prime efficiency ratios and the comparison of
the trend over the period of the years 2018 and 2017. The above graphs depict the number of
days for which the inventory is held by the entity before being sold and the number of days
for which the accounts receivable are outstanding, before the balances are realised. Thus, a
low ratio is an indication of the fact that the inventory is being converted into sales quickly.
As described in graph, the number of inventory holding days have reduced, which is a
positive sign for the enterprise. Similar change is visible in the accounts receivable days.
Solvency
The Short term solvency position of the company depict about the ability of a firm to meet its
entire short term financial obligation. Solvency position seeks to analyze the ability of a
company to avoid the stress related to financial condition for short term. The long-term
shareholders like the government investors, private moneylenders, controllers, and even the
societies are keen to see the features related to solvency of profession from long term vivacity
from the point of view of company. The debt equity ratio and the interest times ratio are two
main ratios that outhouse the light on the structure of debt and the influence of the similar in
the company. The debt equity ratio is very useful for the assessment of the financial leverage
of the company. The debt equity ratio is also called as gearing ratio.
2018 2017
75
80
85
90
Inventory holding
Inventory holding days
2018 2017
0
1
1
Accounts recievables days
Accounts recievables days
REPORT 8
According to the statics in the appendix regarding the company in problem state that there is
the decreasing inclination in the debt equity ratio for the company ever since year 2017. The
reduction in the debt equity ratio is the proof that the corporation is reducing the dependency
on the debt for running of the business. Further, the year 2018 states the extreme decline in
the other obligations of the corporation, and henceforth the reduction. According to the
similar lines, it is required to be noted that the interest time’s ratio has importantly decreased
from the financial year 2017 to the financial year 2018.
CONCLUSION AND RECOMMENDATION
Thus as per the discussions in the previous parts, it can be concluded that preparation and the
presentation of the financial statements is an important aspect of an enterprise. The said
presentation makes the entities and management accountable towards the various
stakeholders. The financial analysis gives insight of various aspects of business operations
and transactions carried on in the relevant financial year. The report analysed the financial
data of the entity Care Pharmacy Group Berhad. The technique that was adopted for the
analysis was the ratio analysis. Further, the graphical representations supported the analysis.
The various ratios such as the liquidity ratios, the efficiency ratios and solvency ratios gave
an understanding of the various aspects. The insight was gained about the capital structure,
the ability to pay off the debts, the effectiveness of the utilisation of the assets and many
more. Thus, it would be right to state that financial analysis of a business serves a number of
purposes for various stakeholders. The comparison of the financial ratios over the years 2018
and 2017 aided in the identification of the areas, which led to the declines and improvements.
Hence, based on the financial position as above, it is recommended to invest in the shares of
the company.
⊘ This is a preview!⊘
Do you want full access?
Subscribe today to unlock all pages.
Trusted by 1+ million students worldwide
REPORT 9
References
Fabozzi, F. J. and Drake, P. P. (2009) Finance: Capital Markets, Financial Management,
and Investment Management. UK: John Wiley & Sons.
Fridson, M. S. and Alvarez, F. (2011) Financial statement analysis: a practitioner's
guide (Vol. 597). UK: John Wiley & Sons.
Robinson, T. R., Henry, E., Pirie, W. L., and Broihahn, M. A. (2015) International Financial
Statement Analysis Workbook. UK: John Wiley & Sons.
Stickney, C. P., Weil, R. L., Schipper, K., Francis, J. (2009) Financial Accounting: An
Introduction to Concepts, Methods and Uses. Boston MA: Cengage Learning.
Care Pharmacy Group Berhad (2018) Annual Report [online] Available from:
https://www.insage.com.my/Upload/Docs/CARING/CARING%20AR%2031-05-
2018.pdf#view=Full&pagemode=bookmarks [Accessed on 24 December 2018].
Paraphrase This Document
Need a fresh take? Get an instant paraphrase of this document with our AI Paraphraser
REPORT 10
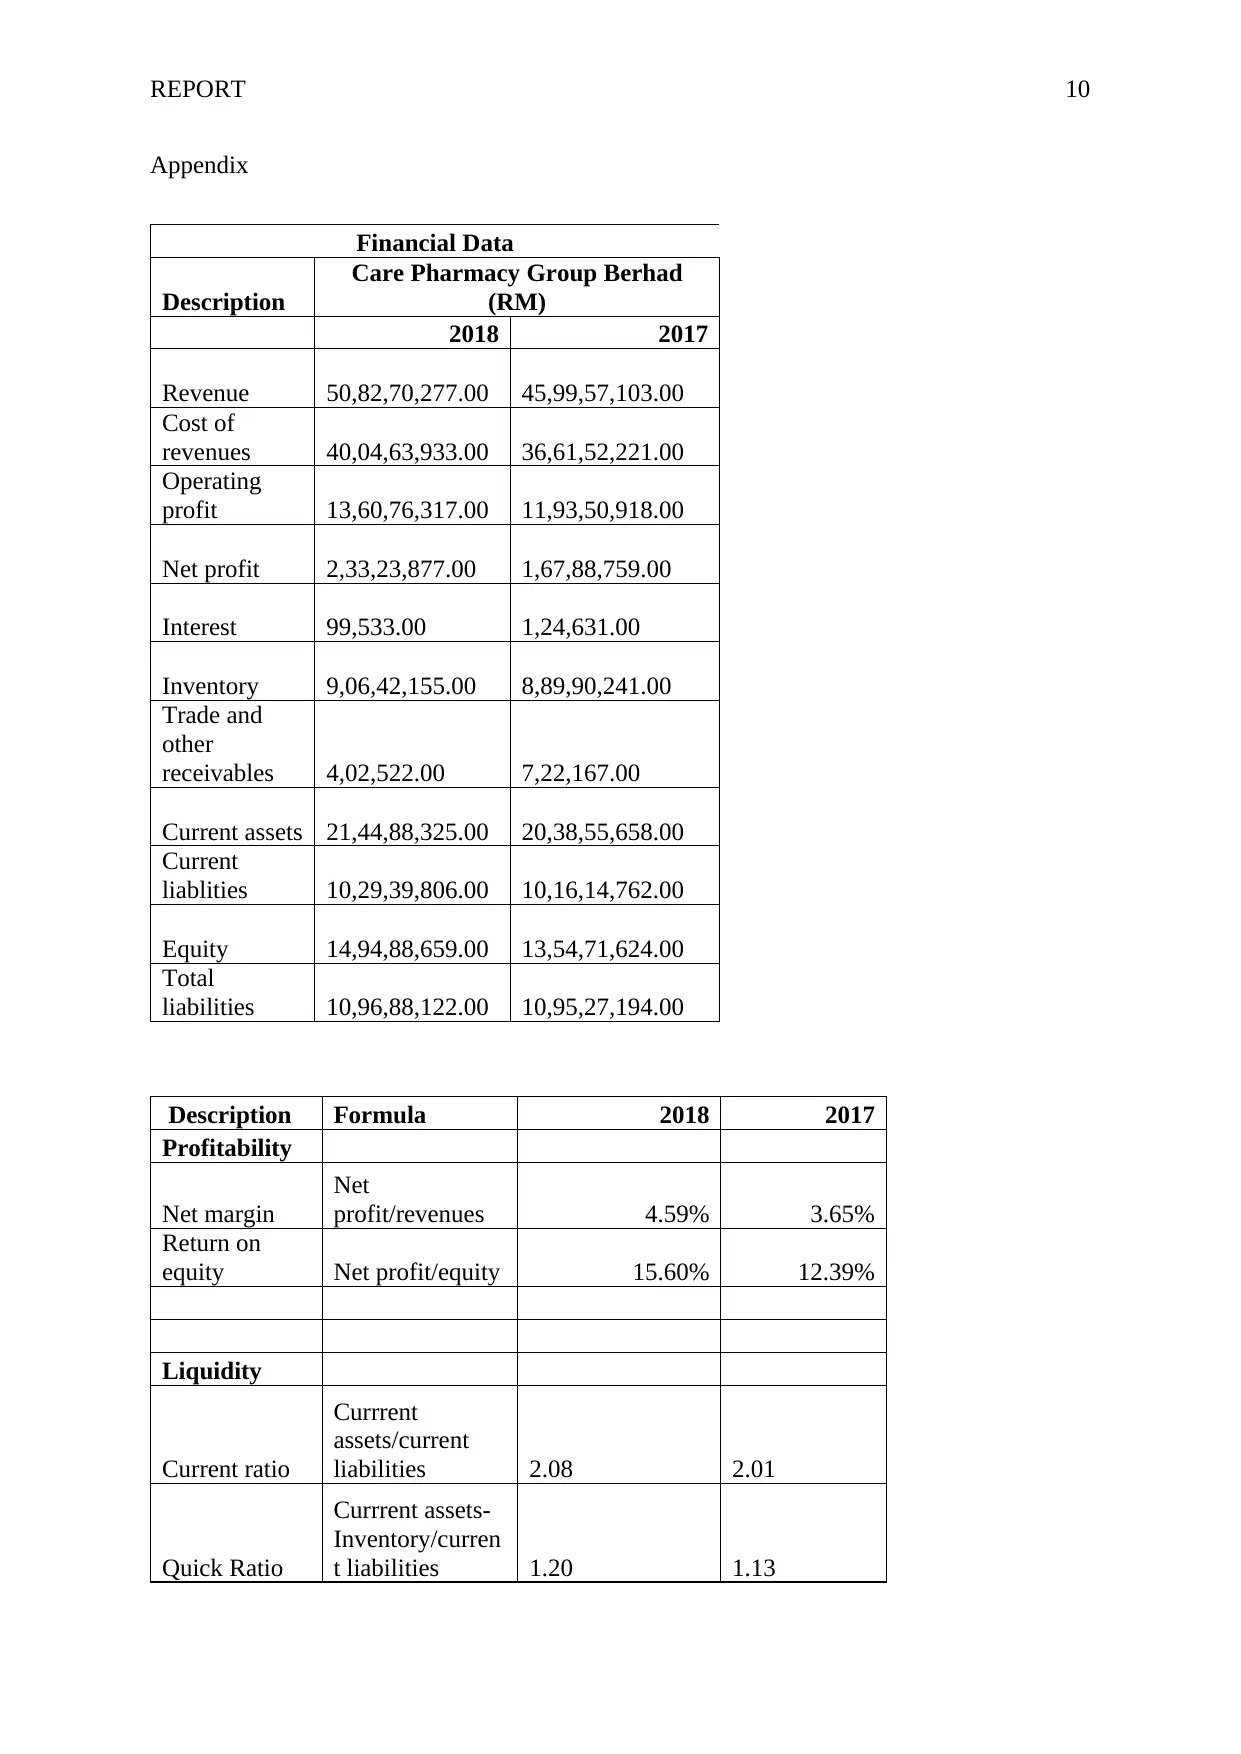
Appendix
Financial Data
Description
Care Pharmacy Group Berhad
(RM)
2018 2017
Revenue 50,82,70,277.00 45,99,57,103.00
Cost of
revenues 40,04,63,933.00 36,61,52,221.00
Operating
profit 13,60,76,317.00 11,93,50,918.00
Net profit 2,33,23,877.00 1,67,88,759.00
Interest 99,533.00 1,24,631.00
Inventory 9,06,42,155.00 8,89,90,241.00
Trade and
other
receivables 4,02,522.00 7,22,167.00
Current assets 21,44,88,325.00 20,38,55,658.00
Current
liablities 10,29,39,806.00 10,16,14,762.00
Equity 14,94,88,659.00 13,54,71,624.00
Total
liabilities 10,96,88,122.00 10,95,27,194.00
Description Formula 2018 2017
Profitability
Net margin
Net
profit/revenues 4.59% 3.65%
Return on
equity Net profit/equity 15.60% 12.39%
Liquidity
Current ratio
Currrent
assets/current
liabilities 2.08 2.01
Quick Ratio
Currrent assets-
Inventory/curren
t liabilities 1.20 1.13
REPORT 11
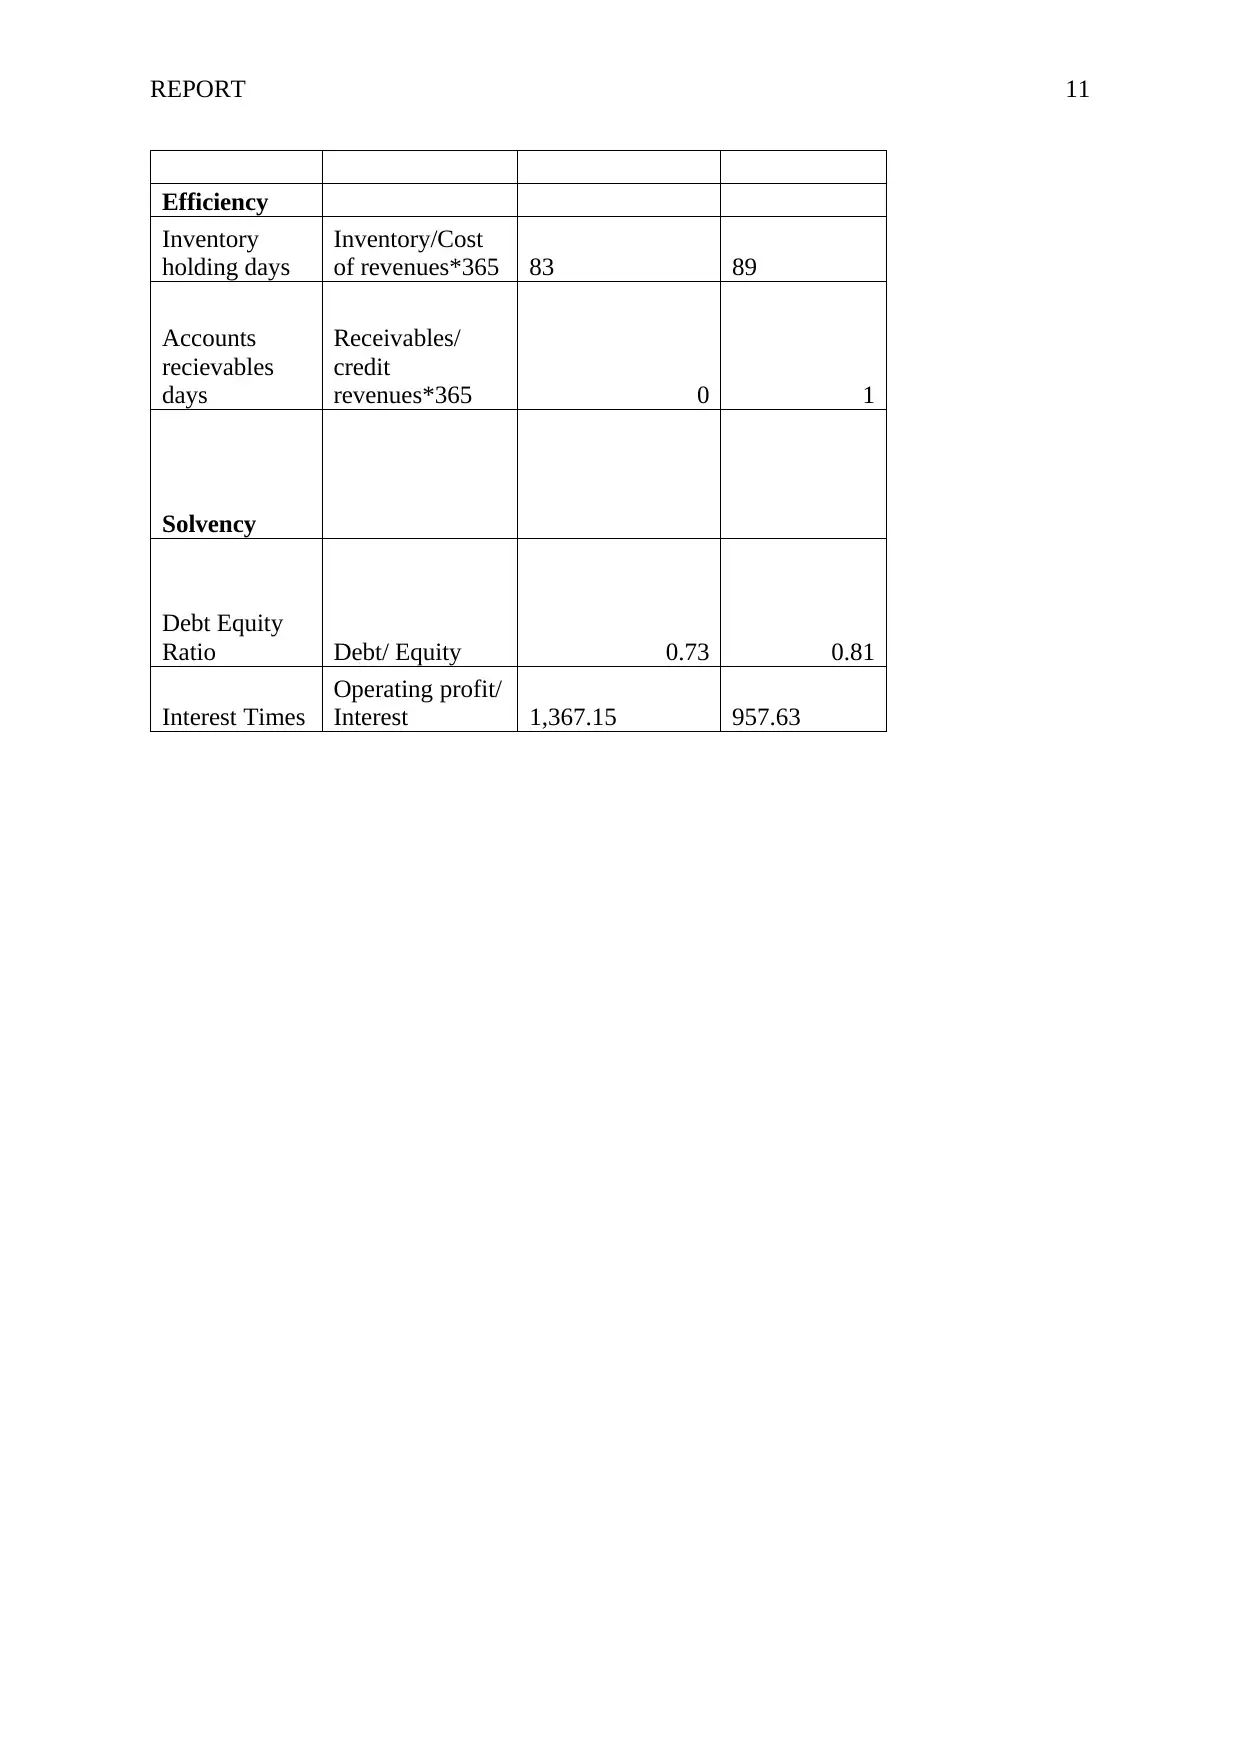
Efficiency
Inventory
holding days
Inventory/Cost
of revenues*365 83 89
Accounts
recievables
days
Receivables/
credit
revenues*365 0 1
Solvency
Debt Equity
Ratio Debt/ Equity 0.73 0.81
Interest Times
Operating profit/
Interest 1,367.15 957.63
Efficiency
Inventory
holding days
Inventory/Cost
of revenues*365 83 89
Accounts
recievables
days
Receivables/
credit
revenues*365 0 1
Solvency
Debt Equity
Ratio Debt/ Equity 0.73 0.81
Interest Times
Operating profit/
Interest 1,367.15 957.63
⊘ This is a preview!⊘
Do you want full access?
Subscribe today to unlock all pages.
Trusted by 1+ million students worldwide
1 out of 12
Related Documents


Your All-in-One AI-Powered Toolkit for Academic Success.
+13062052269
info@desklib.com
Available 24*7 on WhatsApp / Email
![[object Object]](/_next/static/media/star-bottom.7253800d.svg)
Unlock your academic potential
Copyright © 2020–2026 A2Z Services. All Rights Reserved. Developed and managed by ZUCOL.