Financial Statement Analysis Report: Comparative Study of T&L and DCG
VerifiedAdded on 2020/06/05
|22
|3808
|37
Report
AI Summary
This report presents a comprehensive financial statement analysis of Tate & Lyle Plc (T&L) and Dairy Crest Group (DCG) PLC, both operating in the Consumer Goods Food & Beverages sector. The analysis employs ratio analysis, including profitability, efficiency, liquidity, solvency, and investment ratios, to evaluate the companies' financial performance over a three-year period (2016-2017, including interim results for 2017). The report also incorporates SWOT and Porter's Five Forces analyses to provide a broader context. Key findings highlight trends in Return on Equity (ROE), Net Profit margin, Fixed Asset Turnover, Inventory Turnover, Current Ratio, Debt-Equity Ratio, and Earnings Per Share (EPS). The analysis reveals insights into each company's strengths, weaknesses, opportunities, and threats, offering a comparative assessment of their financial health and market position. Common size financial statement analysis and trend analysis are also included to support the financial evaluations.

Financial Statement Analysis
Paraphrase This Document
Need a fresh take? Get an instant paraphrase of this document with our AI Paraphraser
TABLE OF CONTENTS
1. INTRODUCTION.......................................................................................................................1
1.1 Background of the company..................................................................................................1
1.2 Analysis of company’s position in the industry....................................................................1
1.3 Scope of the report.................................................................................................................2
1.4 Methodology..........................................................................................................................2
2. FINANCIAL STATEMENT ANALYSIS..................................................................................2
2.1 Background............................................................................................................................2
2.2 Business analysis...................................................................................................................3
2.3 Analysis of financial performance.........................................................................................4
Common size financial statement analysis................................................................................10
Trend analysis............................................................................................................................11
Altman Z score..........................................................................................................................13
CONCLUSION..............................................................................................................................14
RECOMMENDATIONS...............................................................................................................14
REFERENCES..............................................................................................................................16
APPENDIX....................................................................................................................................18
1. Ratio analysis of Dairy Crest Group PLC.............................................................................18
2. Ratio analysis of Tate & Lyle Plc..........................................................................................19
1. INTRODUCTION
1.1 Background of the company
On the basis of given case situation, two business units have been selected namely Tate &
Lyle Plc (T&L) and Dairy Crest Group (DCG) PLC. Both the companies are operating in the
sector of Consumer Goods Food & Beverages. Brief introduction of both such companies are
enumerated below:
T&L: It is none of the leading British based multinational agribusiness that lays high
level of emphasis on using innovative technology. By using unique technologies firm turns raw
material like corn, tapioca and oats into ingredients (Tate & Lyle plc (TATE), 2017). T&L is the
main constituent of FTSE 250 index and listed on recognized stock exchange of London.
DCG Plc: Such business unit provides customers with wide range of dairy products and
brands like cheese, Country life butter, Vitalite, Clover etc (Dairy Crest Group plc - Company
Profile, 2017). DCG also listed on London stock exchange and recognized as main element of
FTSE 250.
1.2 Analysis of company’s position in the industry
Bargaining power of buyers
Under F&B sector, bargaining power of buyers are
high because they prefer to purchase products or
services from the retailer who charges lower prices
and maintains better quality.
Bargaining power of suppliers
It is low due to the availability of large number of
suppliers. Hence, by purchasing quality product
from the suitable supplier business unit can
generate high margin.
Threat from substitutes
Company is facing threat from the companies
which are offering similar kind of products or
services. Hence, by making focus on the actual
need of customers T&T can cope with such issue
(Tate & Lyle Plc Porter Five Forces Analysis,
2017).
Threat from new entrants
Moderate level of threat exists in F&B sector in
relation to new entrants. Moreover, innovation and
stiff competition imposes threat in front of new
entrants.
⊘ This is a preview!⊘
Do you want full access?
Subscribe today to unlock all pages.
Trusted by 1+ million students worldwide
Competitive rivalry
Intensity of rivalry is high under F&B sector which in turn directly impacts the profit margin of firm.
Moreover, for dealing with the highly competitive situation business unit has to decrease the level of
profit margin.
1.3 Scope of the report
Scope of the present report is wide which in turn provides information to the investors
about the extent to which monetary position of the concerned companies recognized as sound.
As it includes financial evaluation of T&L and DCG Plc for the latest 3 years period which
clearly shows the company prove to be fruitful from investment perspective.
1.4 Methodology
To evaluate financial position and performance of T&L and DCG Plc ratio analysis tool
has been selected as well as employed. It is one of the most effectual tools which help in
summarizing financial statements under different categories such as profitability, liquidity,
solvency, efficiency and investment. Along with this, tool of internal and external environmental
analysis such as Porter five forces & SWOT has also been undertaken to support the financial
evaluation of results. Hence, from the below mentioned sources data has been gathered by the
researcher.
Financial statements of T&L and DCG for the period of 3 years (2016, 2017, interim
results of 2017)
Books, journals and scholarly articles
2. FINANCIAL STATEMENT ANALYSIS
2.1 Background
In order to get quick indication about the financial position and performance of T&L in
against to the competitor such as DCG Plc ratio analysis tool has been employed. This in turn
helps in getting deeper insight about the level to which profitability, liquidity and solvency
position of T&L Plc is sound over others.
Paraphrase This Document
Need a fresh take? Get an instant paraphrase of this document with our AI Paraphraser
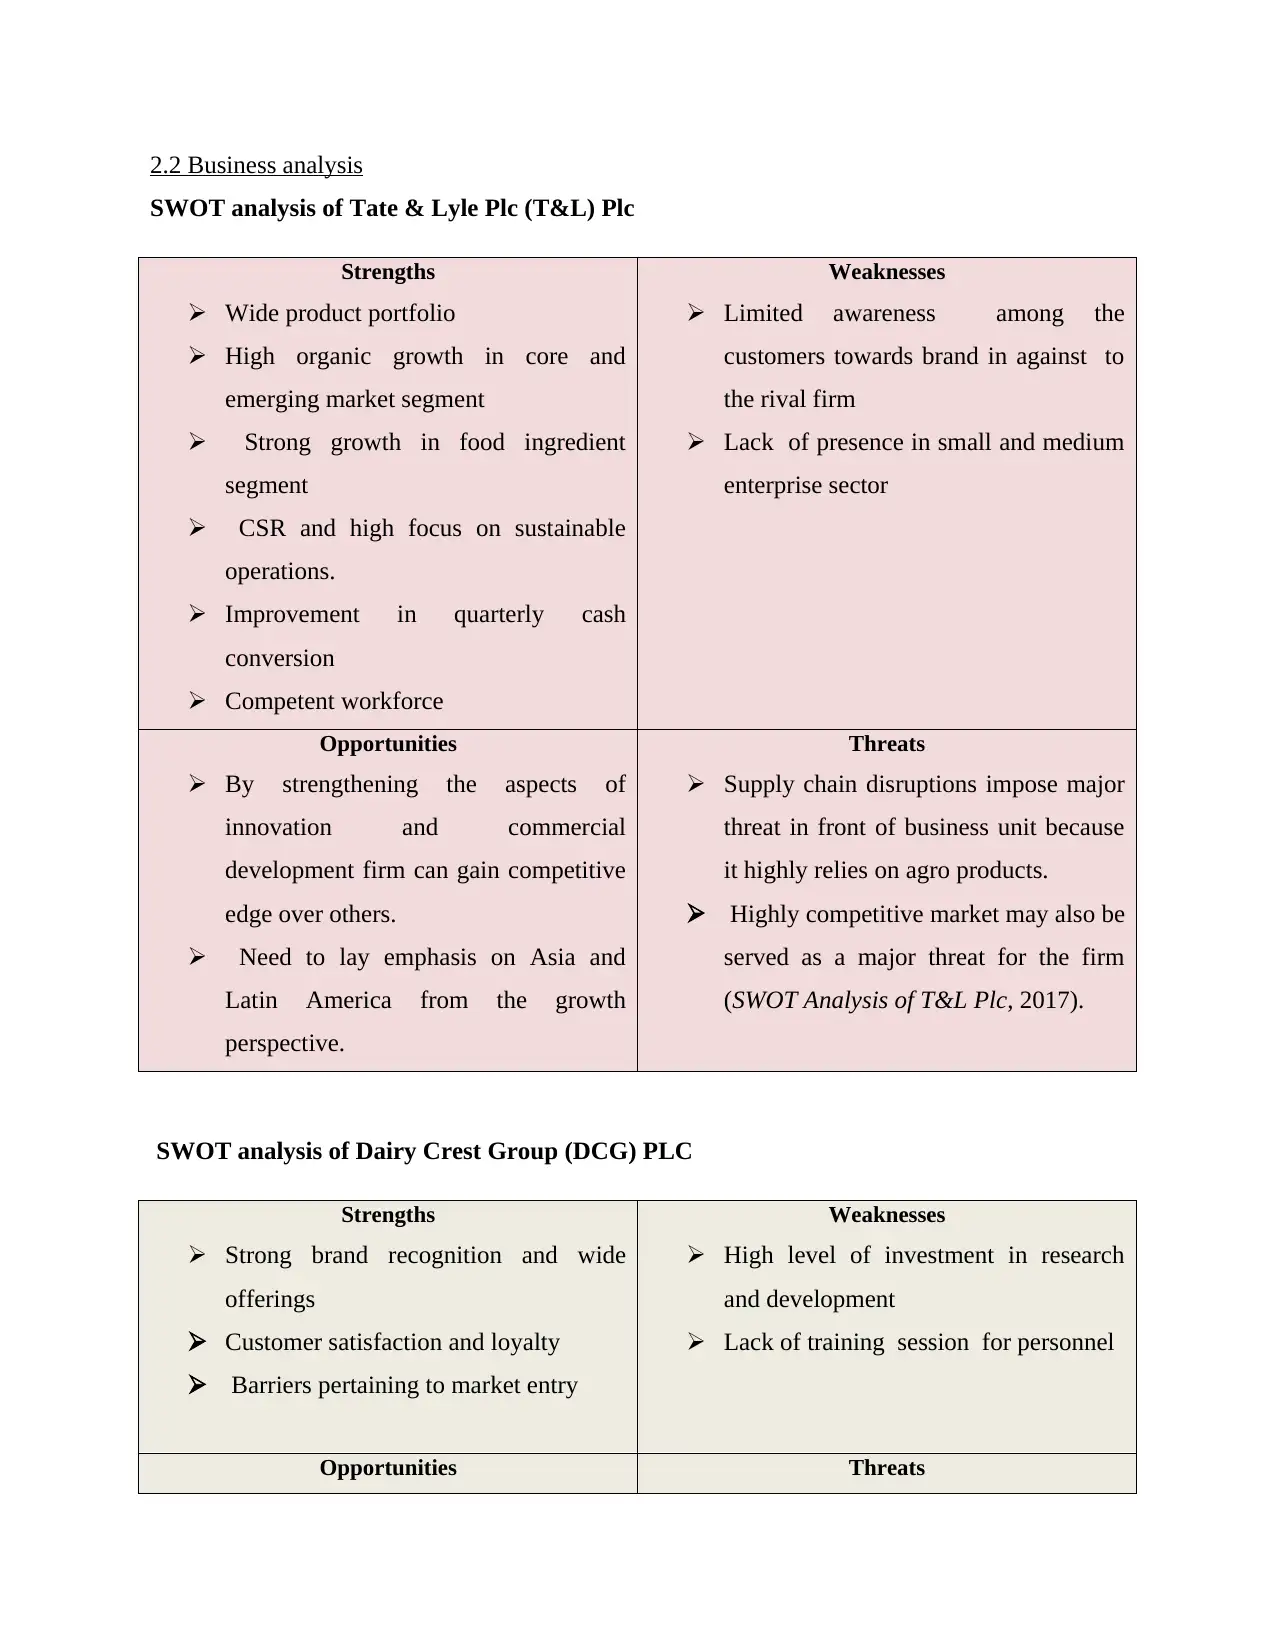
2.2 Business analysis
SWOT analysis of Tate & Lyle Plc (T&L) Plc
Strengths
Wide product portfolio
High organic growth in core and
emerging market segment
Strong growth in food ingredient
segment
CSR and high focus on sustainable
operations.
Improvement in quarterly cash
conversion
Competent workforce
Weaknesses
Limited awareness among the
customers towards brand in against to
the rival firm
Lack of presence in small and medium
enterprise sector
Opportunities
By strengthening the aspects of
innovation and commercial
development firm can gain competitive
edge over others.
Need to lay emphasis on Asia and
Latin America from the growth
perspective.
Threats
Supply chain disruptions impose major
threat in front of business unit because
it highly relies on agro products.
Highly competitive market may also be
served as a major threat for the firm
(SWOT Analysis of T&L Plc, 2017).
SWOT analysis of Dairy Crest Group (DCG) PLC
Strengths
Strong brand recognition and wide
offerings
Customer satisfaction and loyalty
Barriers pertaining to market entry
Weaknesses
High level of investment in research
and development
Lack of training session for personnel
Opportunities Threats
It needs to enter in global and new
markets through the means of
acquisition strategy
Growing economical aspect exhibits
growth opportunities in front of DCG
plc
Availability of competitors
Fluctuations in pricing and packaging
policy (Dairy Crest Group plc SWOT
Analysis, 2017)
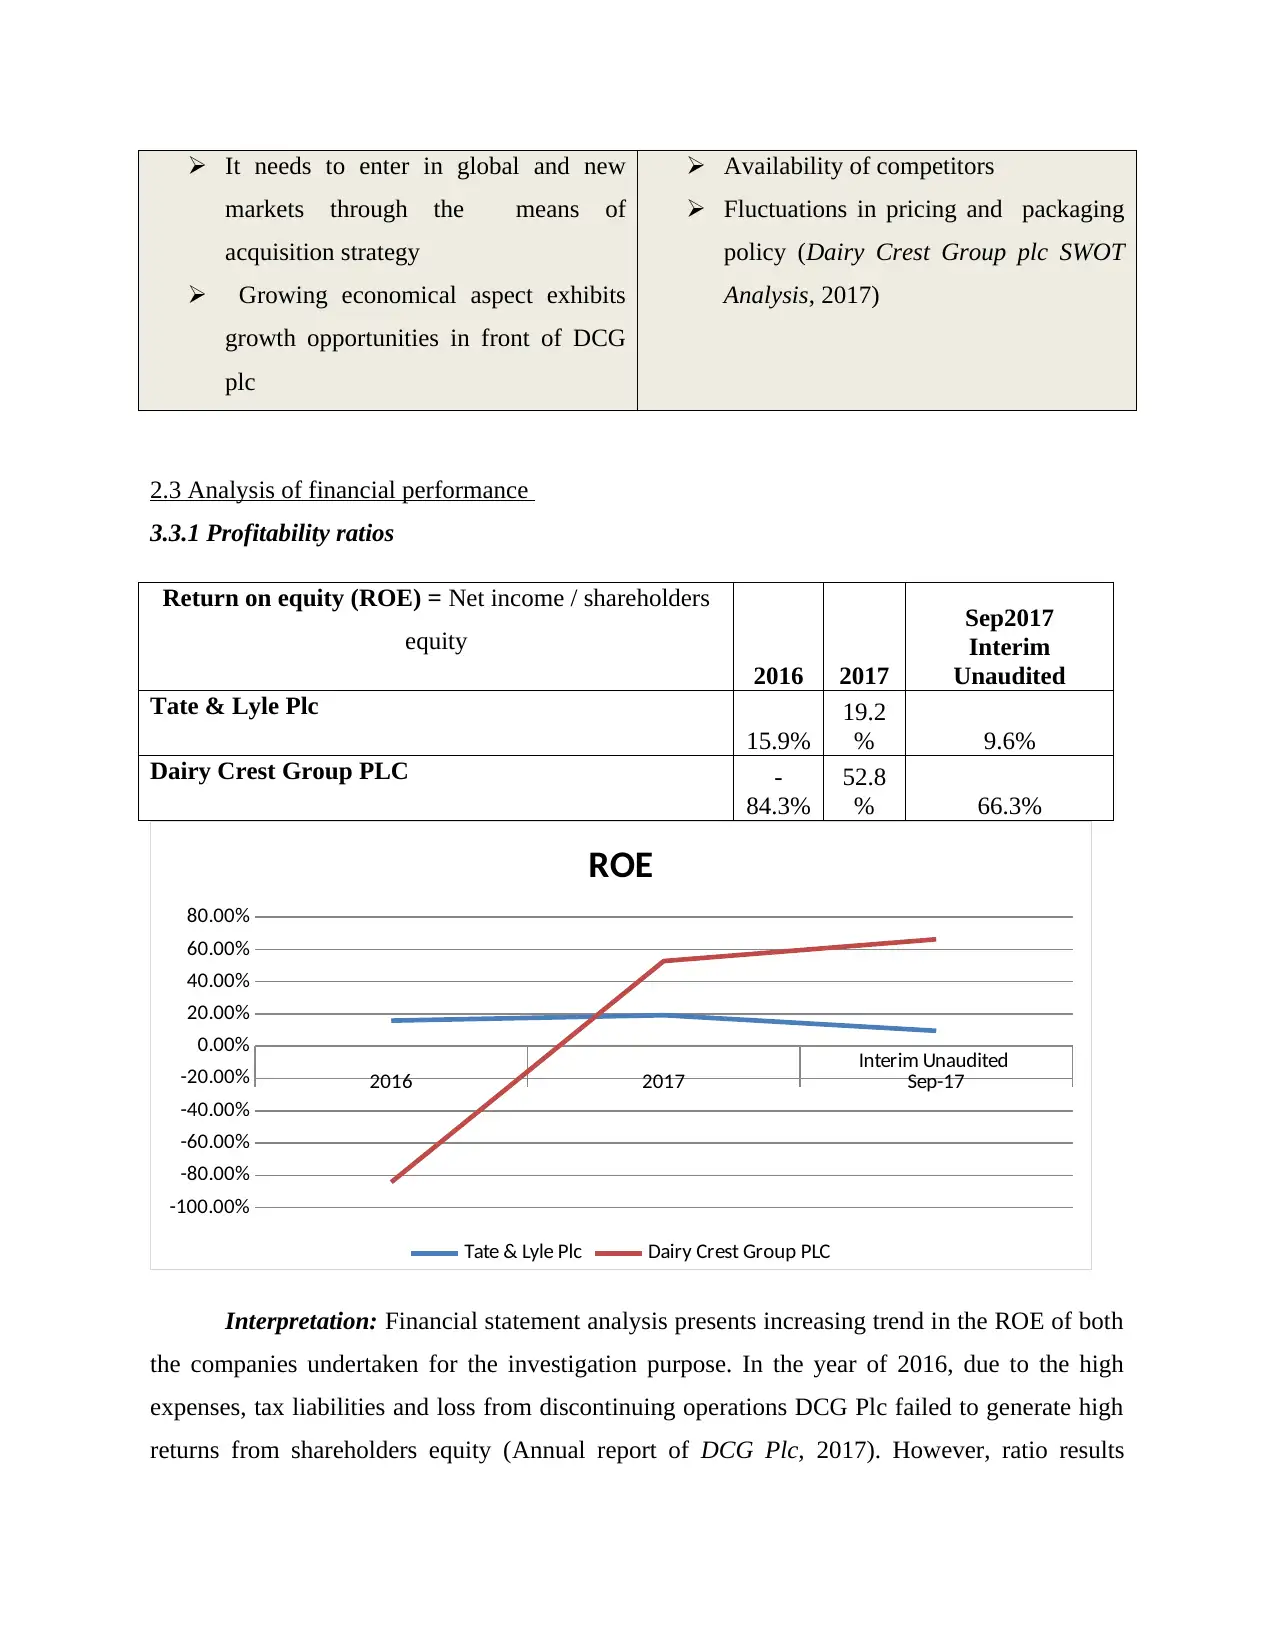
2.3 Analysis of financial performance
3.3.1 Profitability ratios
Return on equity (ROE) = Net income / shareholders
equity
2016 2017
Sep2017
Interim
Unaudited
Tate & Lyle Plc
15.9%
19.2
% 9.6%
Dairy Crest Group PLC -
84.3%
52.8
% 66.3%
Interim Unaudited
2016 2017 Sep-17
-100.00%
-80.00%
-60.00%
-40.00%
-20.00%
0.00%
20.00%
40.00%
60.00%
80.00%
ROE
Tate & Lyle Plc Dairy Crest Group PLC
Interpretation: Financial statement analysis presents increasing trend in the ROE of both
the companies undertaken for the investigation purpose. In the year of 2016, due to the high
expenses, tax liabilities and loss from discontinuing operations DCG Plc failed to generate high
returns from shareholders equity (Annual report of DCG Plc, 2017). However, ratio results
markets through the means of
acquisition strategy
Growing economical aspect exhibits
growth opportunities in front of DCG
plc
Availability of competitors
Fluctuations in pricing and packaging
policy (Dairy Crest Group plc SWOT
Analysis, 2017)
2.3 Analysis of financial performance
3.3.1 Profitability ratios
Return on equity (ROE) = Net income / shareholders
equity
2016 2017
Sep2017
Interim
Unaudited
Tate & Lyle Plc
15.9%
19.2
% 9.6%
Dairy Crest Group PLC -
84.3%
52.8
% 66.3%
Interim Unaudited
2016 2017 Sep-17
-100.00%
-80.00%
-60.00%
-40.00%
-20.00%
0.00%
20.00%
40.00%
60.00%
80.00%
ROE
Tate & Lyle Plc Dairy Crest Group PLC
Interpretation: Financial statement analysis presents increasing trend in the ROE of both
the companies undertaken for the investigation purpose. In the year of 2016, due to the high
expenses, tax liabilities and loss from discontinuing operations DCG Plc failed to generate high
returns from shareholders equity (Annual report of DCG Plc, 2017). However, ratio results
⊘ This is a preview!⊘
Do you want full access?
Subscribe today to unlock all pages.
Trusted by 1+ million students worldwide
pertaining to the year 2017 and interim period outcome shows that DCG Plc has used
shareholders fund in a prominent way as compared to T&L. Such financial results can clearly be
linked with SWOT analysis section which in turn exhibits that customers are highly aware from
the products of T&L Plc. Thus, it is one of the main reasons due to which T&L failed to generate
higher returns from funds invested by shareholders.
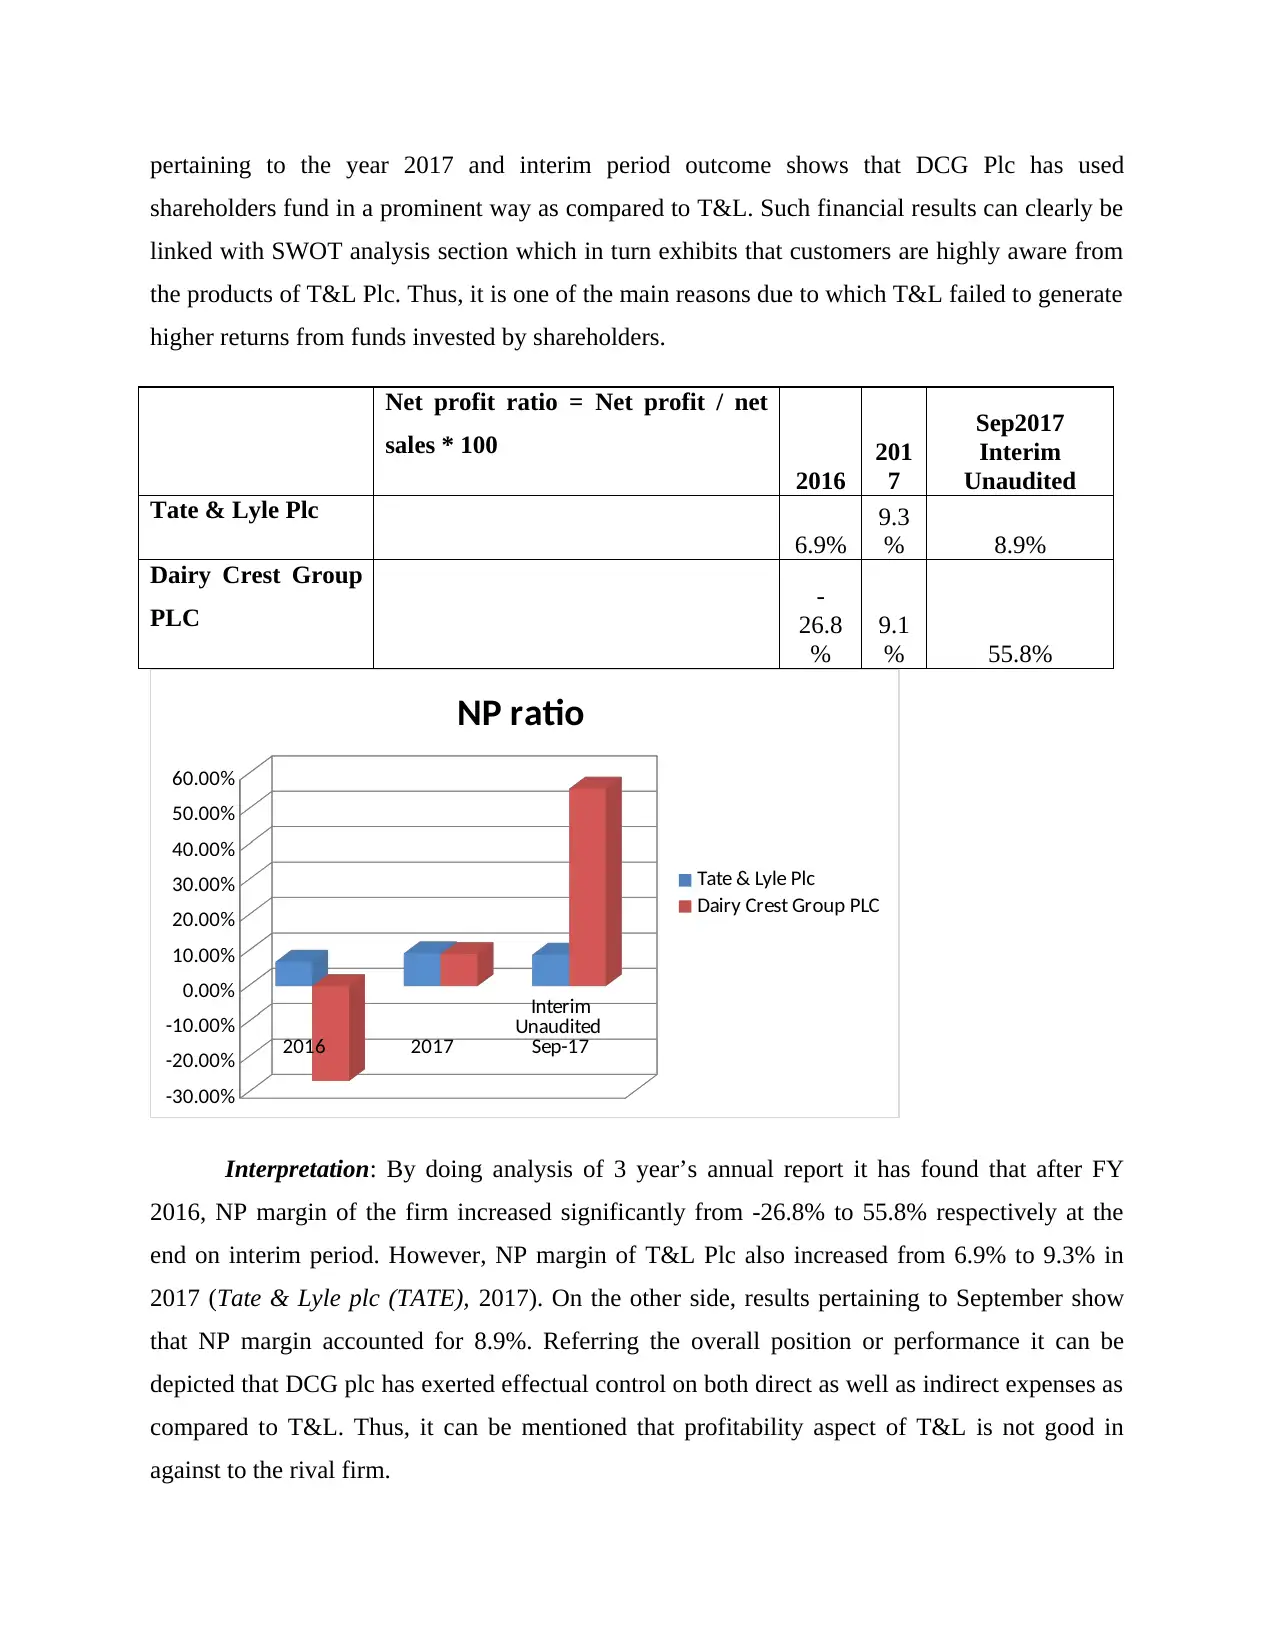
Net profit ratio = Net profit / net
sales * 100
2016
201
7
Sep2017
Interim
Unaudited
Tate & Lyle Plc
6.9%
9.3
% 8.9%
Dairy Crest Group
PLC -
26.8
%
9.1
% 55.8%
Interim
Unaudited
2016 2017 Sep-17
-30.00%
-20.00%
-10.00%
0.00%
10.00%
20.00%
30.00%
40.00%
50.00%
60.00%
NP ratio
Tate & Lyle Plc
Dairy Crest Group PLC
Interpretation: By doing analysis of 3 year’s annual report it has found that after FY
2016, NP margin of the firm increased significantly from -26.8% to 55.8% respectively at the
end on interim period. However, NP margin of T&L Plc also increased from 6.9% to 9.3% in
2017 (Tate & Lyle plc (TATE), 2017). On the other side, results pertaining to September show
that NP margin accounted for 8.9%. Referring the overall position or performance it can be
depicted that DCG plc has exerted effectual control on both direct as well as indirect expenses as
compared to T&L. Thus, it can be mentioned that profitability aspect of T&L is not good in
against to the rival firm.
shareholders fund in a prominent way as compared to T&L. Such financial results can clearly be
linked with SWOT analysis section which in turn exhibits that customers are highly aware from
the products of T&L Plc. Thus, it is one of the main reasons due to which T&L failed to generate
higher returns from funds invested by shareholders.
Net profit ratio = Net profit / net
sales * 100
2016
201
7
Sep2017
Interim
Unaudited
Tate & Lyle Plc
6.9%
9.3
% 8.9%
Dairy Crest Group
PLC -
26.8
%
9.1
% 55.8%
Interim
Unaudited
2016 2017 Sep-17
-30.00%
-20.00%
-10.00%
0.00%
10.00%
20.00%
30.00%
40.00%
50.00%
60.00%
NP ratio
Tate & Lyle Plc
Dairy Crest Group PLC
Interpretation: By doing analysis of 3 year’s annual report it has found that after FY
2016, NP margin of the firm increased significantly from -26.8% to 55.8% respectively at the
end on interim period. However, NP margin of T&L Plc also increased from 6.9% to 9.3% in
2017 (Tate & Lyle plc (TATE), 2017). On the other side, results pertaining to September show
that NP margin accounted for 8.9%. Referring the overall position or performance it can be
depicted that DCG plc has exerted effectual control on both direct as well as indirect expenses as
compared to T&L. Thus, it can be mentioned that profitability aspect of T&L is not good in
against to the rival firm.
Paraphrase This Document
Need a fresh take? Get an instant paraphrase of this document with our AI Paraphraser
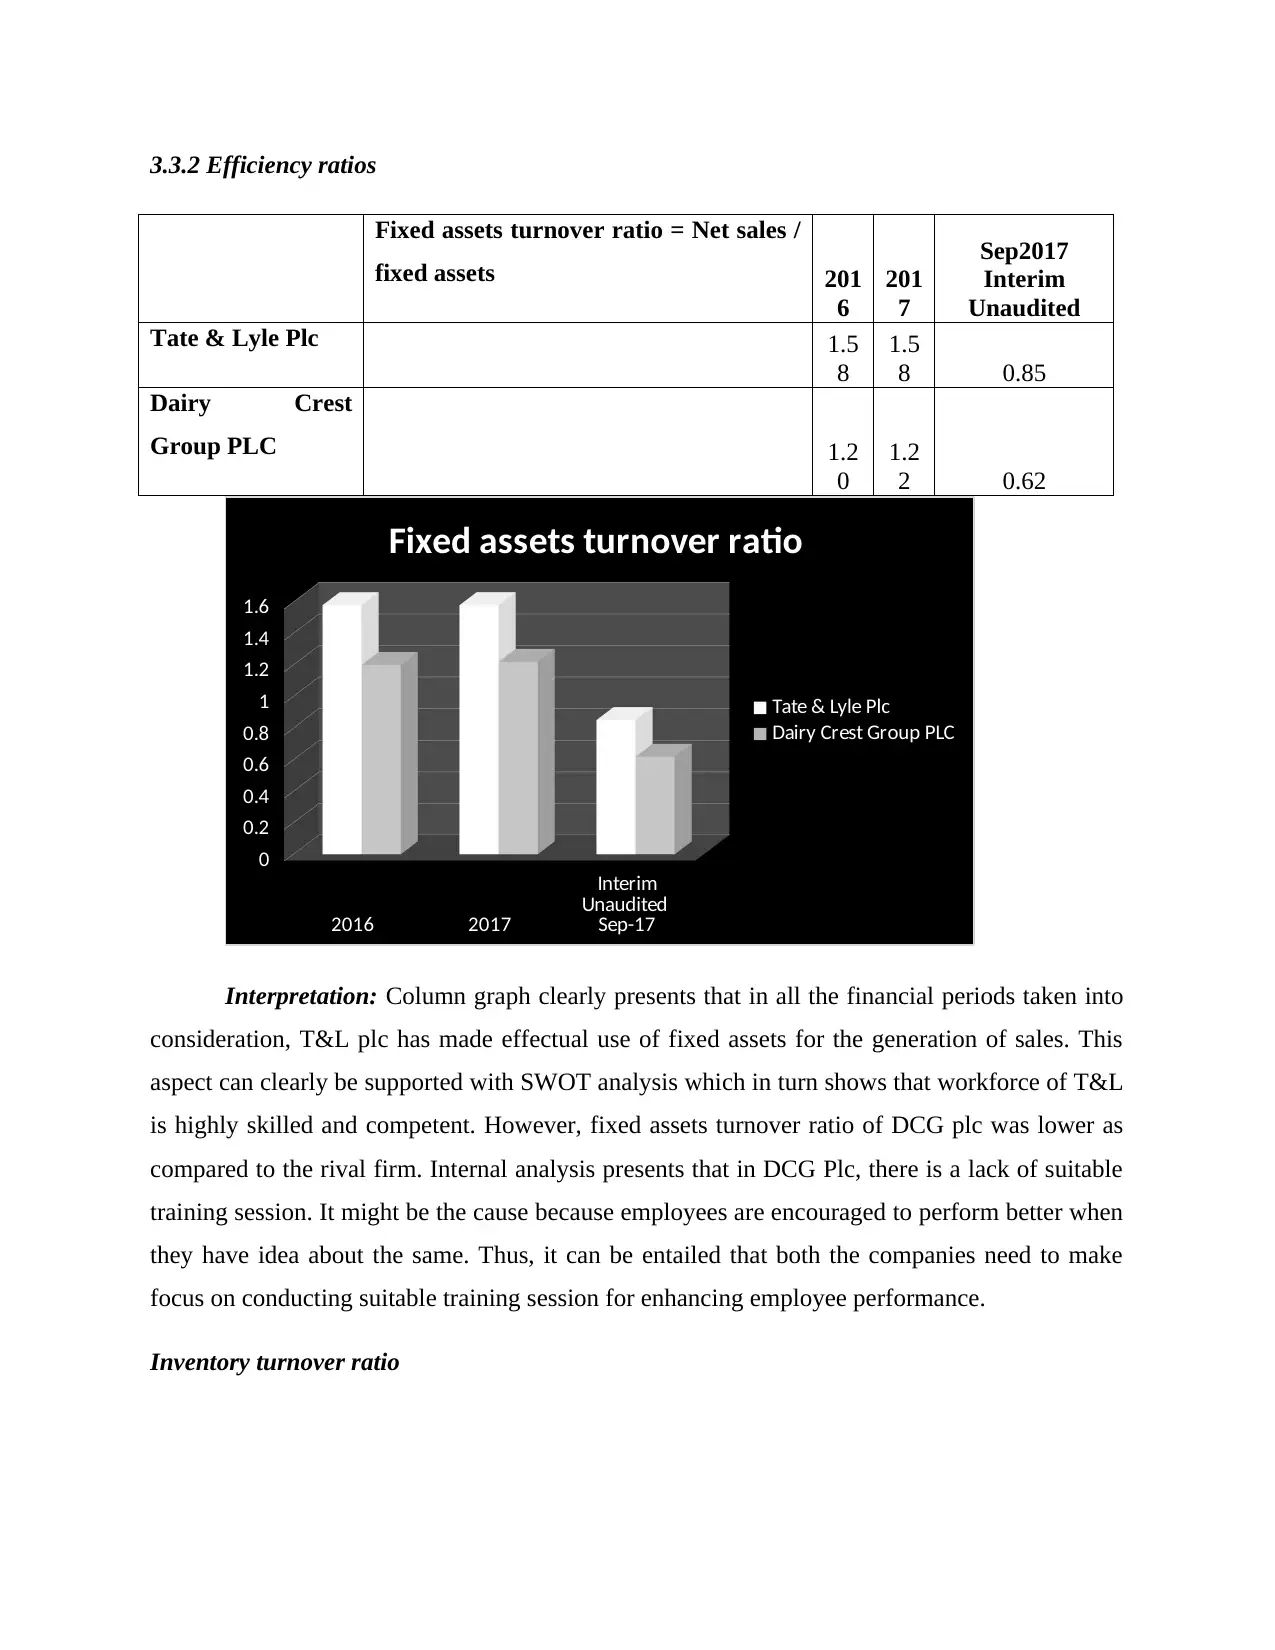
3.3.2 Efficiency ratios
Fixed assets turnover ratio = Net sales /
fixed assets 201
6
201
7
Sep2017
Interim
Unaudited
Tate & Lyle Plc 1.5
8
1.5
8 0.85
Dairy Crest
Group PLC 1.2
0
1.2
2 0.62
Interim
Unaudited
2016 2017 Sep-17
0
0.2
0.4
0.6
0.8
1
1.2
1.4
1.6
Fixed assets turnover ratio
Tate & Lyle Plc
Dairy Crest Group PLC
Interpretation: Column graph clearly presents that in all the financial periods taken into
consideration, T&L plc has made effectual use of fixed assets for the generation of sales. This
aspect can clearly be supported with SWOT analysis which in turn shows that workforce of T&L
is highly skilled and competent. However, fixed assets turnover ratio of DCG plc was lower as
compared to the rival firm. Internal analysis presents that in DCG Plc, there is a lack of suitable
training session. It might be the cause because employees are encouraged to perform better when
they have idea about the same. Thus, it can be entailed that both the companies need to make
focus on conducting suitable training session for enhancing employee performance.
Inventory turnover ratio
Inventory turnover ratio = Net sales /
fixed assets 201
6
201
7
Sep2017
Interim
Unaudited
Tate & Lyle Plc 0.0
0
0.5
8 0.00
Dairy Crest Group
PLC 2.0
5
1.9
9 1.16
Interpretation: Tabular presentation shows decreasing trend in the inventory turnover
ratio of DCG Plc which is not a good indicator. Along with this, as compared to DCG Plc, in
2017 stock turnover ratio of T&T plc was only .58 times. In comparison to T&T, such ratio of
DCG Plc was good but both the companies need to lay focus on undertaking GH
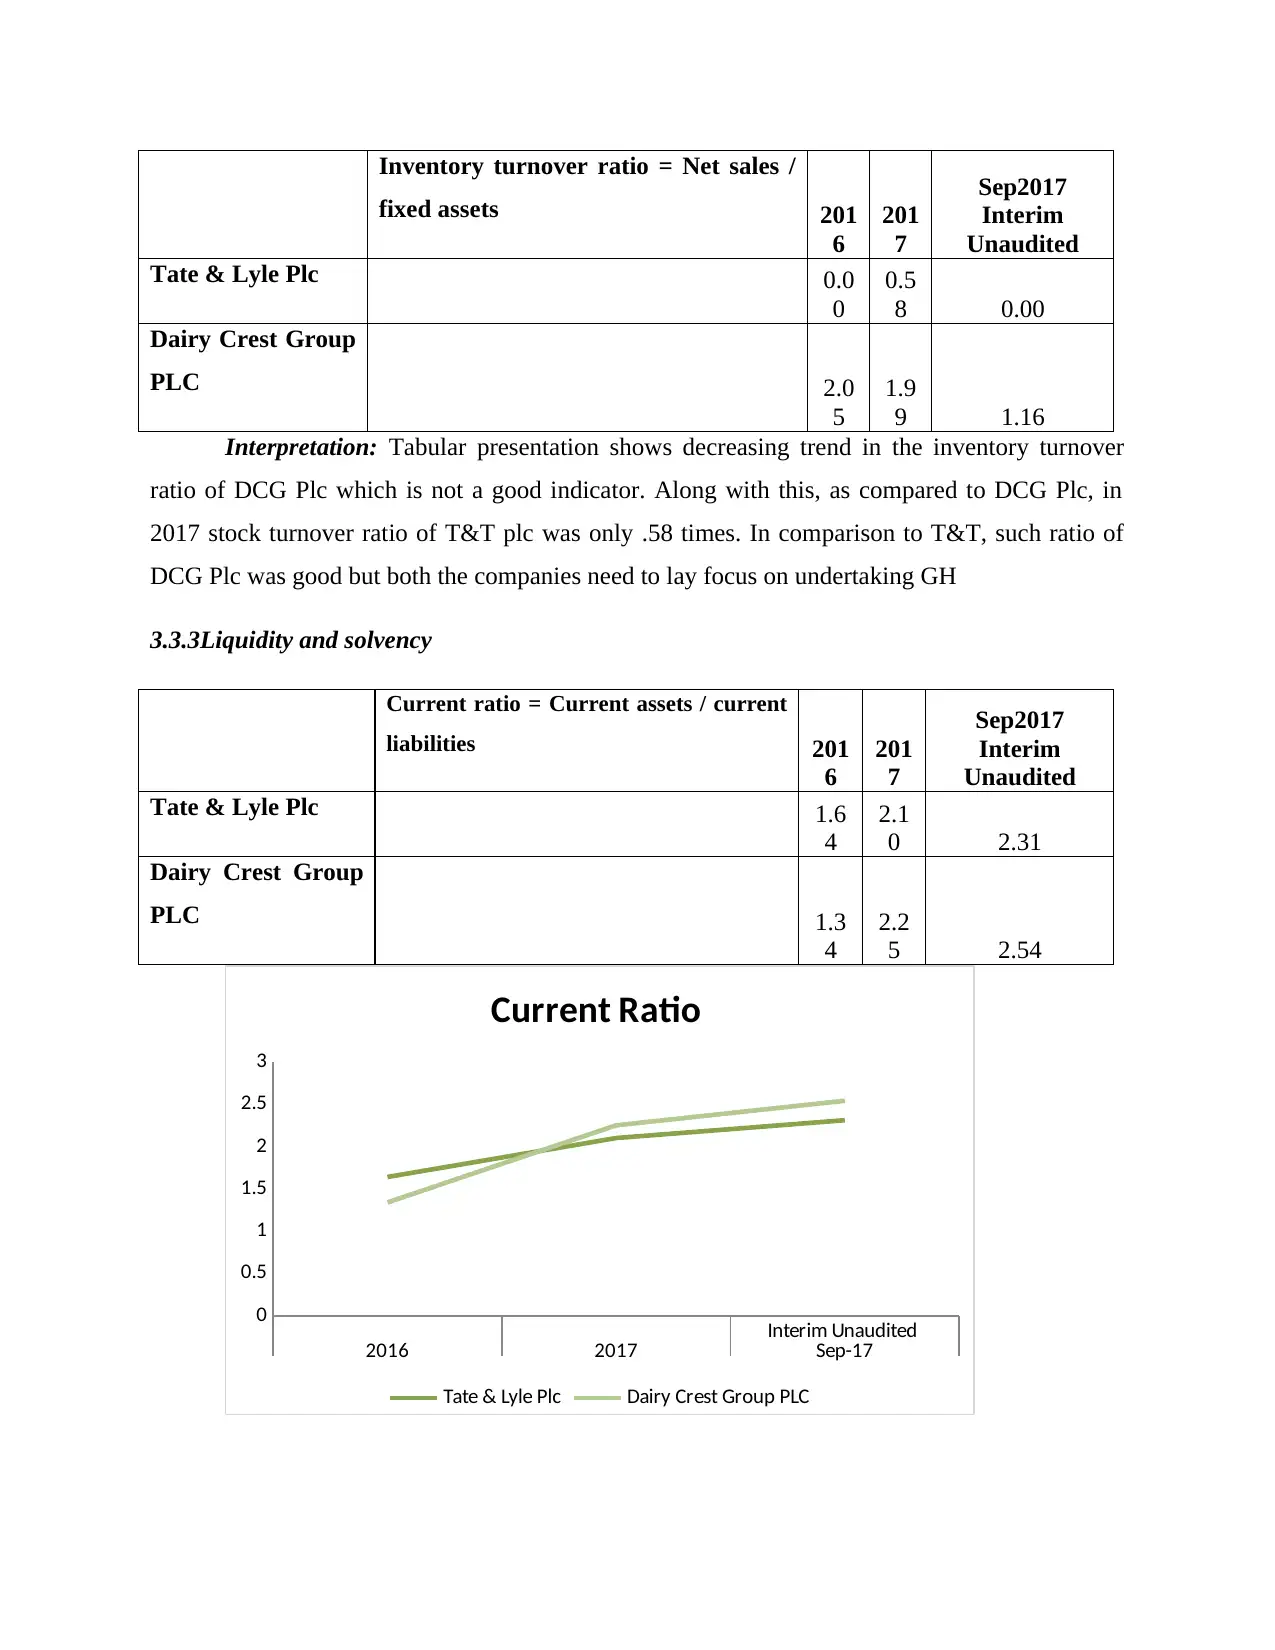
3.3.3Liquidity and solvency
Current ratio = Current assets / current
liabilities 201
6
201
7
Sep2017
Interim
Unaudited
Tate & Lyle Plc 1.6
4
2.1
0 2.31
Dairy Crest Group
PLC 1.3
4
2.2
5 2.54
Interim Unaudited
2016 2017 Sep-17
0
0.5
1
1.5
2
2.5
3
Current Ratio
Tate & Lyle Plc Dairy Crest Group PLC
fixed assets 201
6
201
7
Sep2017
Interim
Unaudited
Tate & Lyle Plc 0.0
0
0.5
8 0.00
Dairy Crest Group
PLC 2.0
5
1.9
9 1.16
Interpretation: Tabular presentation shows decreasing trend in the inventory turnover
ratio of DCG Plc which is not a good indicator. Along with this, as compared to DCG Plc, in
2017 stock turnover ratio of T&T plc was only .58 times. In comparison to T&T, such ratio of
DCG Plc was good but both the companies need to lay focus on undertaking GH
3.3.3Liquidity and solvency
Current ratio = Current assets / current
liabilities 201
6
201
7
Sep2017
Interim
Unaudited
Tate & Lyle Plc 1.6
4
2.1
0 2.31
Dairy Crest Group
PLC 1.3
4
2.2
5 2.54
Interim Unaudited
2016 2017 Sep-17
0
0.5
1
1.5
2
2.5
3
Current Ratio
Tate & Lyle Plc Dairy Crest Group PLC
⊘ This is a preview!⊘
Do you want full access?
Subscribe today to unlock all pages.
Trusted by 1+ million students worldwide
Interpretation: The above depicted table presents that liquidity ratio and position of both
the companies have increased over the time frame. In 2017, current ratio of T&L and DCG Plc
implied for 2.10 & 2.54. Hence, by taking into account the results of evaluation it can mentioned
that current ratio of the firms are in line with the ideal standards such as 2:1. Thus, both the
companies are capable in relation to meeting their obligations from current assets.
Debt-equity ratio: Long-term debt /
shareholder’s equity 20
16
201
7
Sep2017
Interim
Unaudited
Tate & Lyle Plc 0.5
3
0.4
4 0.44
Dairy Crest
Group PLC 1.8
5
3.7
9 1.61
Interim
Unaudited
2016 2017 Sep-17
0
0.5
1
1.5
2
2.5
3
3.5
4
Tate & Lyle Plc
Dairy Crest Group PLC
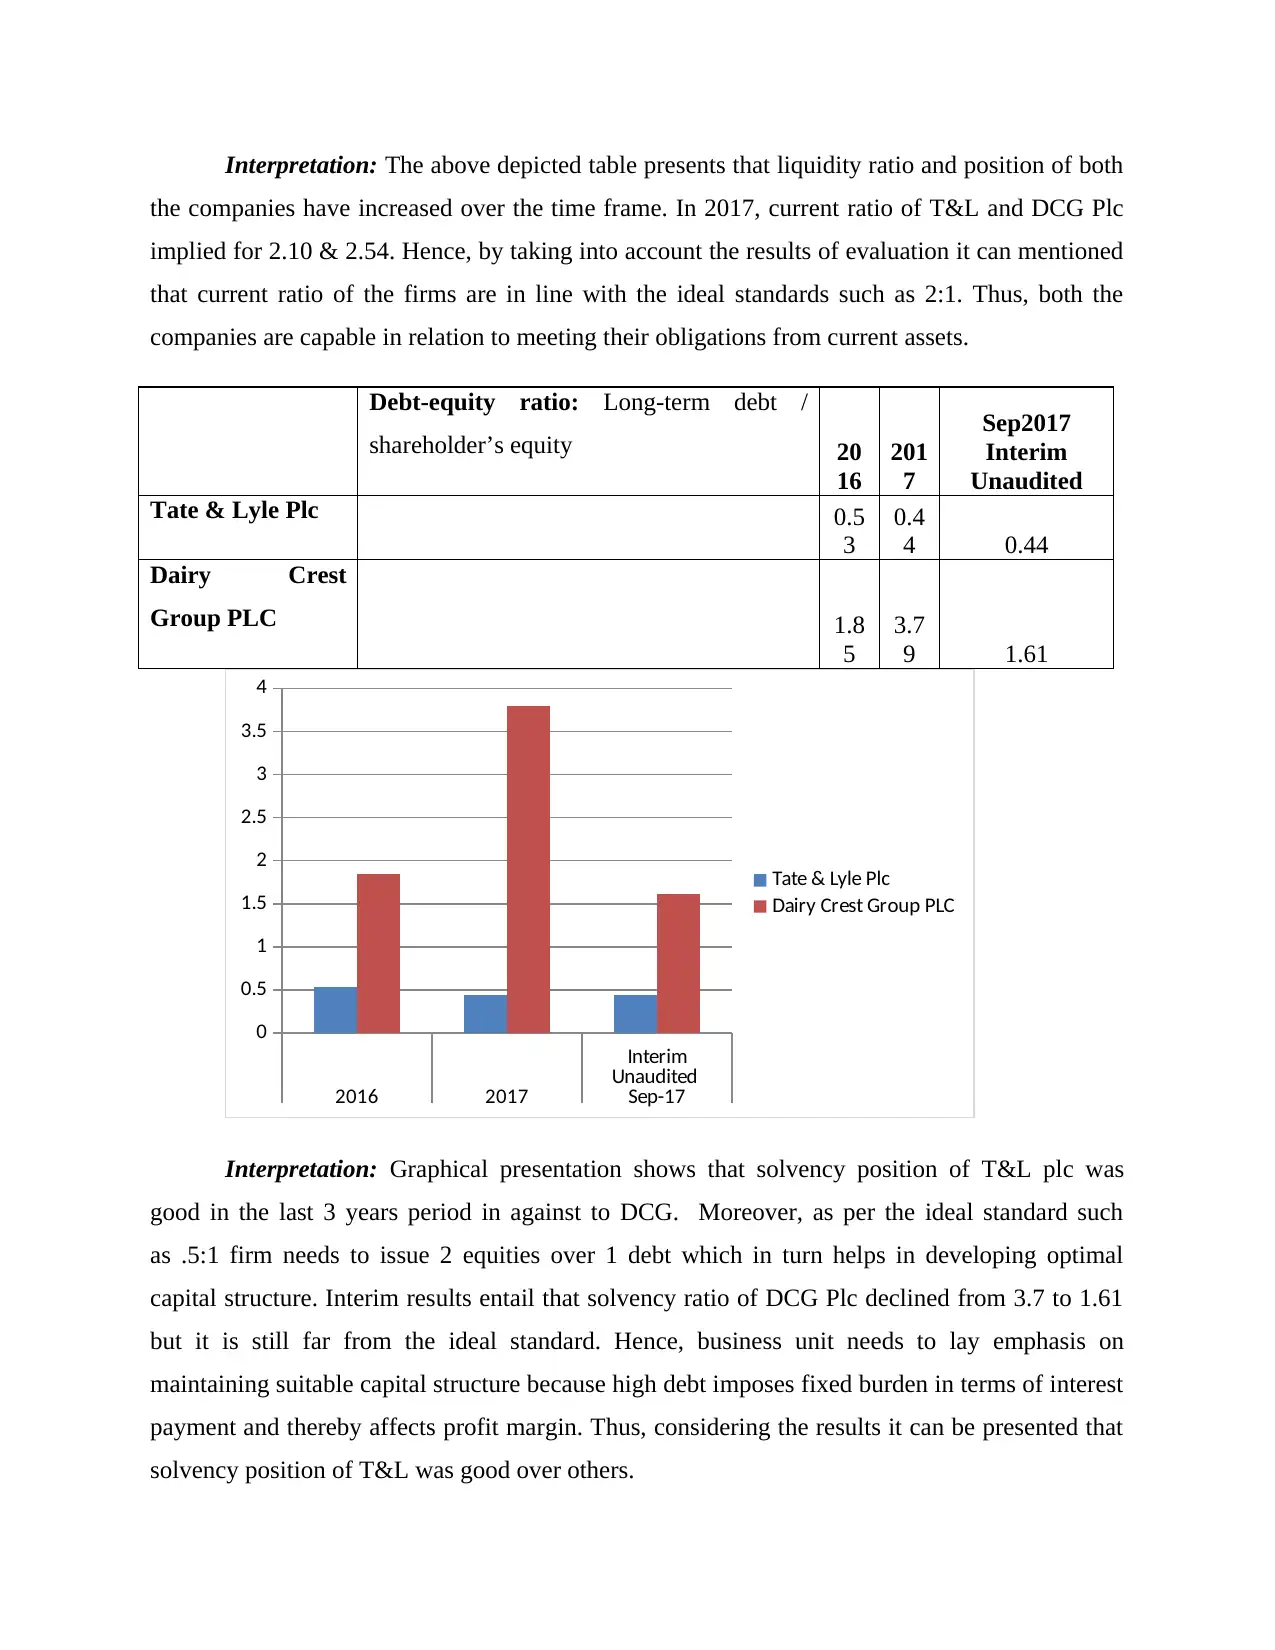
Interpretation: Graphical presentation shows that solvency position of T&L plc was
good in the last 3 years period in against to DCG. Moreover, as per the ideal standard such
as .5:1 firm needs to issue 2 equities over 1 debt which in turn helps in developing optimal
capital structure. Interim results entail that solvency ratio of DCG Plc declined from 3.7 to 1.61
but it is still far from the ideal standard. Hence, business unit needs to lay emphasis on
maintaining suitable capital structure because high debt imposes fixed burden in terms of interest
payment and thereby affects profit margin. Thus, considering the results it can be presented that
solvency position of T&L was good over others.
the companies have increased over the time frame. In 2017, current ratio of T&L and DCG Plc
implied for 2.10 & 2.54. Hence, by taking into account the results of evaluation it can mentioned
that current ratio of the firms are in line with the ideal standards such as 2:1. Thus, both the
companies are capable in relation to meeting their obligations from current assets.
Debt-equity ratio: Long-term debt /
shareholder’s equity 20
16
201
7
Sep2017
Interim
Unaudited
Tate & Lyle Plc 0.5
3
0.4
4 0.44
Dairy Crest
Group PLC 1.8
5
3.7
9 1.61
Interim
Unaudited
2016 2017 Sep-17
0
0.5
1
1.5
2
2.5
3
3.5
4
Tate & Lyle Plc
Dairy Crest Group PLC
Interpretation: Graphical presentation shows that solvency position of T&L plc was
good in the last 3 years period in against to DCG. Moreover, as per the ideal standard such
as .5:1 firm needs to issue 2 equities over 1 debt which in turn helps in developing optimal
capital structure. Interim results entail that solvency ratio of DCG Plc declined from 3.7 to 1.61
but it is still far from the ideal standard. Hence, business unit needs to lay emphasis on
maintaining suitable capital structure because high debt imposes fixed burden in terms of interest
payment and thereby affects profit margin. Thus, considering the results it can be presented that
solvency position of T&L was good over others.
Paraphrase This Document
Need a fresh take? Get an instant paraphrase of this document with our AI Paraphraser
3.3.4 Investment ratios
Particulars
Earnings per share:
Net income –
preferred dividend /
Number of shares
outstanding
2016 2017
Sep2017
Interim
Unaudited
Tate & Lyle Plc 0.34 0.54 0.53
Dairy Crest Group PLC -0.81 0.27 1.06
Interim Unaudited
2016 2017 Sep-17
-1
-0.5
0
0.5
1
1.5
EPS
Particulars
DPS = Net income /
number of
outstanding shares 2016 2017
Sep2017
Interim
Unaudited
Tate & Lyle Plc
0.28 0.28 0.28
Dairy Crest Group PLC
0.21 0.22 0.23
Particulars
Earnings per share:
Net income –
preferred dividend /
Number of shares
outstanding
2016 2017
Sep2017
Interim
Unaudited
Tate & Lyle Plc 0.34 0.54 0.53
Dairy Crest Group PLC -0.81 0.27 1.06
Interim Unaudited
2016 2017 Sep-17
-1
-0.5
0
0.5
1
1.5
EPS
Particulars
DPS = Net income /
number of
outstanding shares 2016 2017
Sep2017
Interim
Unaudited
Tate & Lyle Plc
0.28 0.28 0.28
Dairy Crest Group PLC
0.21 0.22 0.23
Interim Unaudited
2016 2017 Sep-17
0
0.05
0.1
0.15
0.2
0.25
0.3
DPS
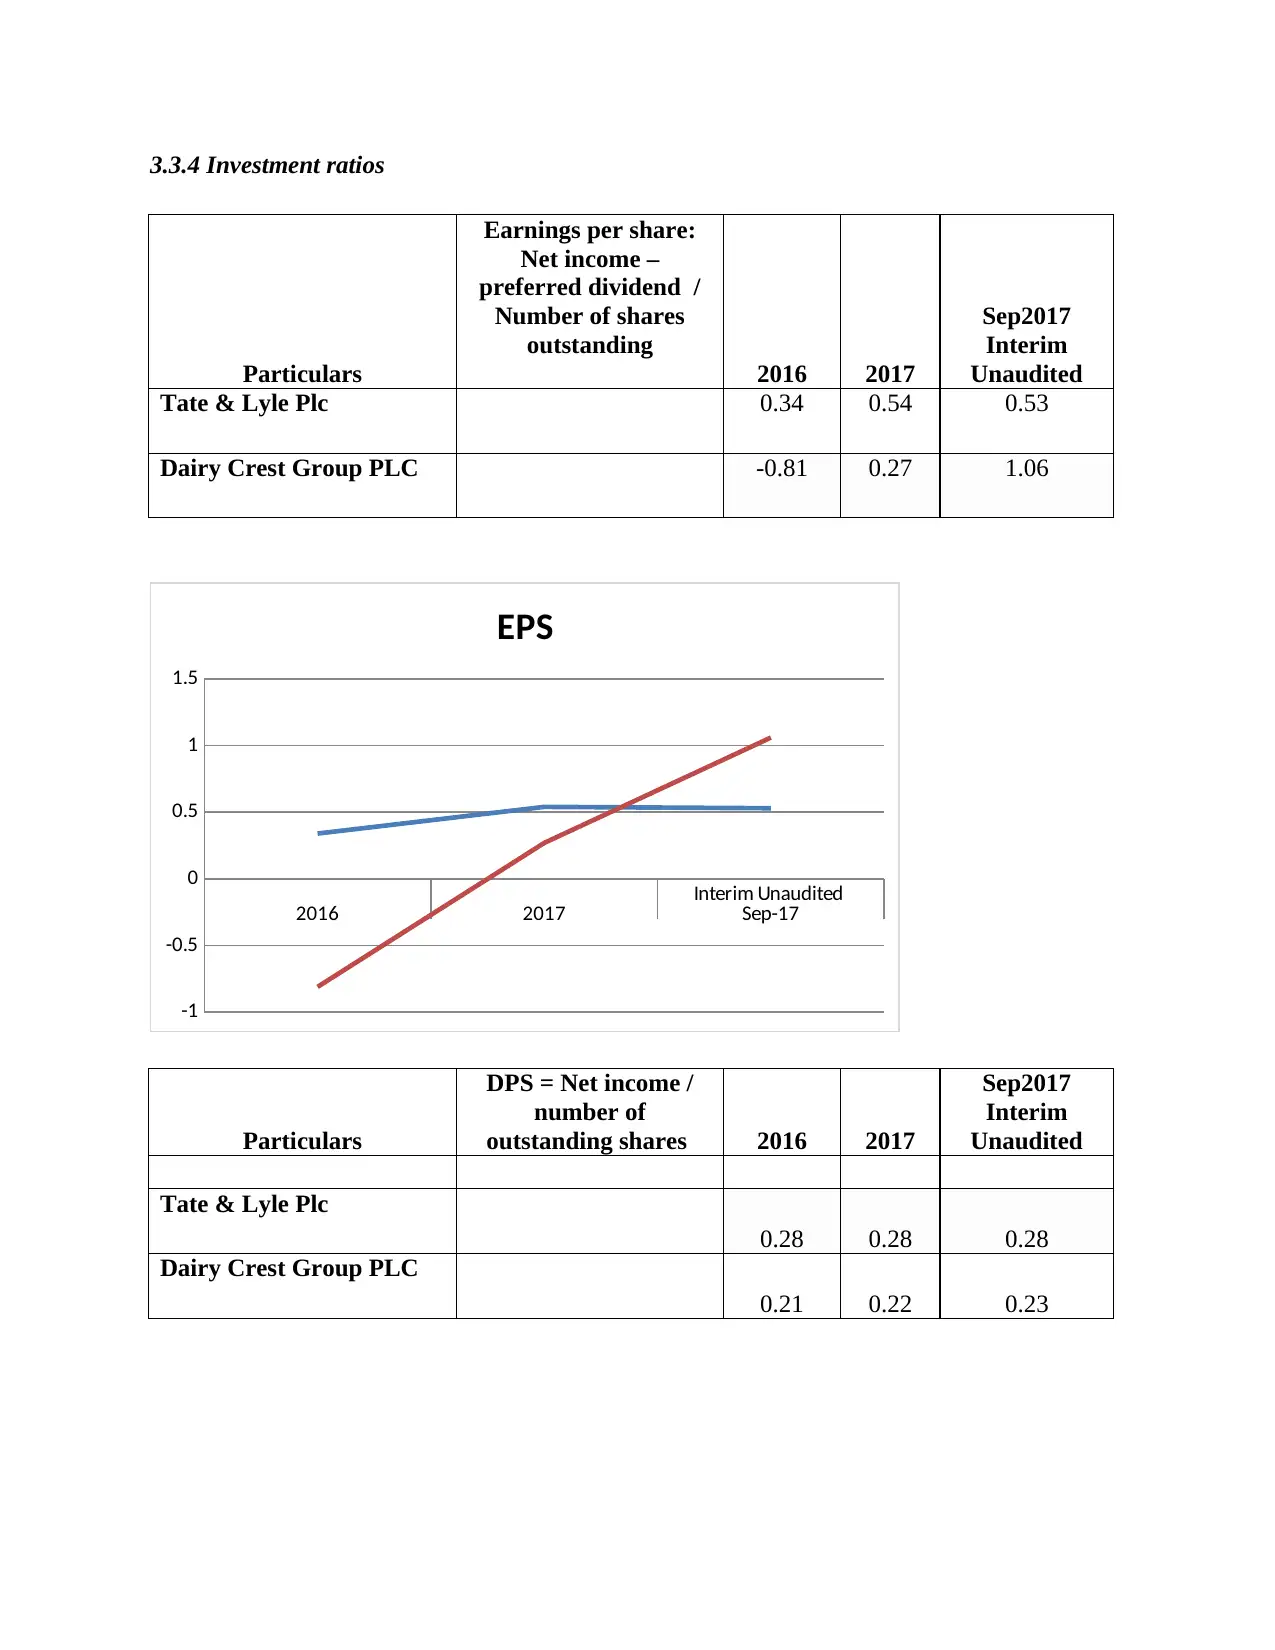
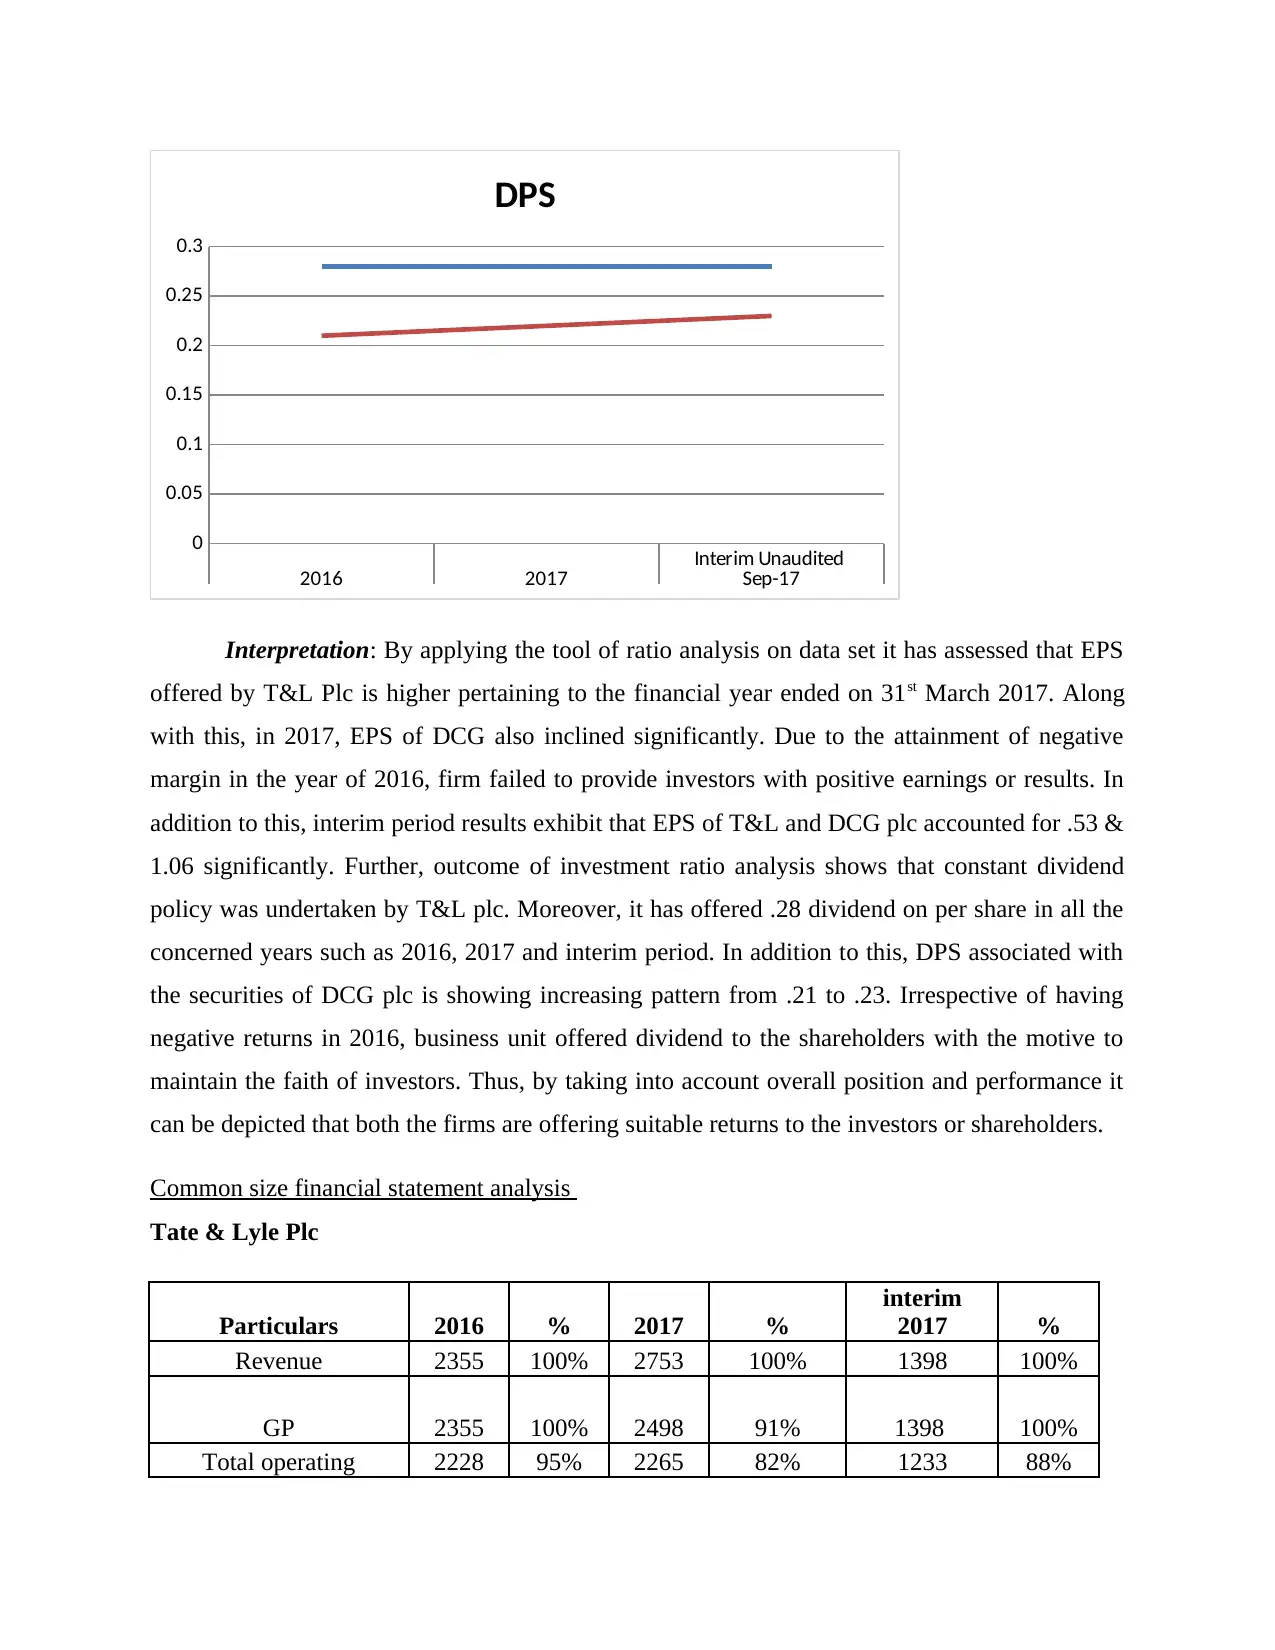
Interpretation: By applying the tool of ratio analysis on data set it has assessed that EPS
offered by T&L Plc is higher pertaining to the financial year ended on 31st March 2017. Along
with this, in 2017, EPS of DCG also inclined significantly. Due to the attainment of negative
margin in the year of 2016, firm failed to provide investors with positive earnings or results. In
addition to this, interim period results exhibit that EPS of T&L and DCG plc accounted for .53 &
1.06 significantly. Further, outcome of investment ratio analysis shows that constant dividend
policy was undertaken by T&L plc. Moreover, it has offered .28 dividend on per share in all the
concerned years such as 2016, 2017 and interim period. In addition to this, DPS associated with
the securities of DCG plc is showing increasing pattern from .21 to .23. Irrespective of having
negative returns in 2016, business unit offered dividend to the shareholders with the motive to
maintain the faith of investors. Thus, by taking into account overall position and performance it
can be depicted that both the firms are offering suitable returns to the investors or shareholders.
Common size financial statement analysis
Tate & Lyle Plc
Particulars 2016 % 2017 %
interim
2017 %
Revenue 2355 100% 2753 100% 1398 100%
GP 2355 100% 2498 91% 1398 100%
Total operating 2228 95% 2265 82% 1233 88%
2016 2017 Sep-17
0
0.05
0.1
0.15
0.2
0.25
0.3
DPS
Interpretation: By applying the tool of ratio analysis on data set it has assessed that EPS
offered by T&L Plc is higher pertaining to the financial year ended on 31st March 2017. Along
with this, in 2017, EPS of DCG also inclined significantly. Due to the attainment of negative
margin in the year of 2016, firm failed to provide investors with positive earnings or results. In
addition to this, interim period results exhibit that EPS of T&L and DCG plc accounted for .53 &
1.06 significantly. Further, outcome of investment ratio analysis shows that constant dividend
policy was undertaken by T&L plc. Moreover, it has offered .28 dividend on per share in all the
concerned years such as 2016, 2017 and interim period. In addition to this, DPS associated with
the securities of DCG plc is showing increasing pattern from .21 to .23. Irrespective of having
negative returns in 2016, business unit offered dividend to the shareholders with the motive to
maintain the faith of investors. Thus, by taking into account overall position and performance it
can be depicted that both the firms are offering suitable returns to the investors or shareholders.
Common size financial statement analysis
Tate & Lyle Plc
Particulars 2016 % 2017 %
interim
2017 %
Revenue 2355 100% 2753 100% 1398 100%
GP 2355 100% 2498 91% 1398 100%
Total operating 2228 95% 2265 82% 1233 88%
⊘ This is a preview!⊘
Do you want full access?
Subscribe today to unlock all pages.
Trusted by 1+ million students worldwide
1 out of 22
Related Documents


Your All-in-One AI-Powered Toolkit for Academic Success.
+13062052269
info@desklib.com
Available 24*7 on WhatsApp / Email
![[object Object]](/_next/static/media/star-bottom.7253800d.svg)
Unlock your academic potential
Copyright © 2020–2026 A2Z Services. All Rights Reserved. Developed and managed by ZUCOL.