Financial Statement Analysis and Decision Making Report - Harvey Homes
VerifiedAdded on 2020/06/03
|23
|5327
|46
Report
AI Summary
This report provides a comprehensive financial analysis of Harvey Homes, examining its financial performance in 2015 and 2016. It begins with an executive summary and then delves into a detailed analysis of the profit and loss statement, balance sheet, and cash flow statement. Ratio analysis is used to assess the company's profitability, liquidity, and solvency. The report also includes an analysis of Harvey Homes' market segments and evaluates investment opportunities using techniques such as NPV and ARR. The analysis reveals trends in revenue, cost of sales, and operating expenses across different regions. The report concludes with recommendations for financial decision-making, including advice on investment, financing, and dividend policies, and highlights the importance of managing cash flow and improving profitability. The report emphasizes the importance of making effective decisions for the company and offers insights into the financial health and market position of Harvey Homes.
FINANCIAL DECISION
MAKING
MAKING
Paraphrase This Document
Need a fresh take? Get an instant paraphrase of this document with our AI Paraphraser
Table of Contents
EXECUTIVE SUMMARY.............................................................................................................1
PART 1............................................................................................................................................1
Analysis of Profit and loss statement.....................................................................................1
Analysing the Balance Sheet of Harvey.................................................................................4
Analysing the cash flow statement of Harvey........................................................................7
Analysis of Market segments.................................................................................................9
PART 2..........................................................................................................................................13
Forecast of the management.................................................................................................13
Techniques for investment appraisal....................................................................................13
Sources of finance................................................................................................................15
Non financial factors to be considered by Harvey...............................................................16
CONCLUSION..............................................................................................................................16
REFERENCES..............................................................................................................................17
APPENDIX....................................................................................................................................18
Illustration Index
Illustration 1: Comparison of Gross Margin Ratio..........................................................................1
Illustration 2: Comparison of Net Margin ratio...............................................................................2
Illustration 3: Comparison of operating profits and capital employed............................................3
Illustration 4: Comparison of Current Assets and Current Liabilities.............................................5
Illustration 5: Comparison of Quick assets and Current Liabilities.................................................6
Illustration 6: Comparison of Long term assets and Total Assets...................................................7
Illustration 7: Cash flow from different activities............................................................................8
Illustration 8: Cash conversion cycle...............................................................................................9
Illustration 9: Gross and operating profits of Northern Region ....................................................10
Illustration 10: Gross and operating profits Midlands region........................................................11
Illustration 11: Gross and operating profits of Southern region....................................................12
Index of Tables
Table 1: Ratio Analysis from Profit and Loss Account.................................................................18
Table 2: Calculation of Capital Employed.....................................................................................18
Table 3: Ratio Analysis from Balance Sheet.................................................................................19
Table 4: Calculation of Quick Assets............................................................................................19
Table 5: Cash Flow........................................................................................................................19
Table 6: Calculation of cash conversion cycle..............................................................................20
⊘ This is a preview!⊘
Do you want full access?
Subscribe today to unlock all pages.
Trusted by 1+ million students worldwide
EXECUTIVE SUMMARY
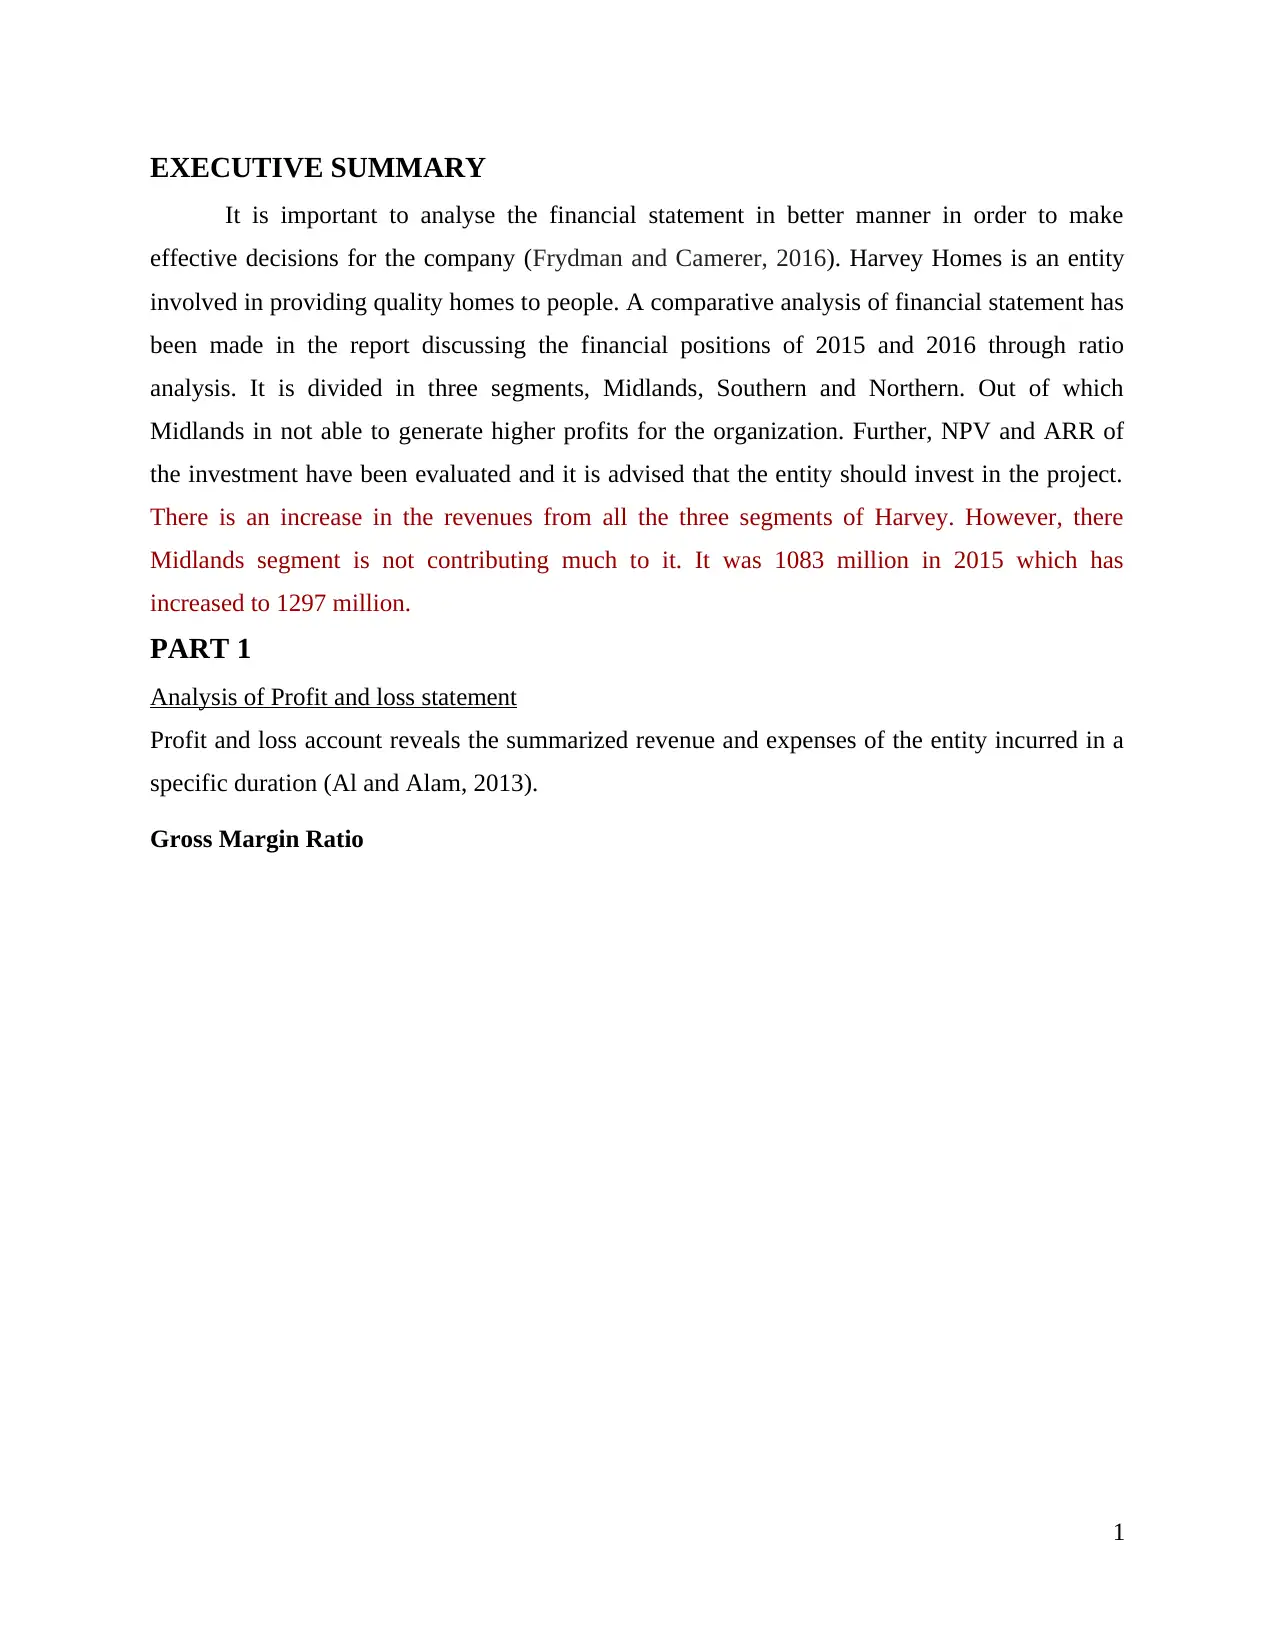
It is important to analyse the financial statement in better manner in order to make
effective decisions for the company (Frydman and Camerer, 2016). Harvey Homes is an entity
involved in providing quality homes to people. A comparative analysis of financial statement has
been made in the report discussing the financial positions of 2015 and 2016 through ratio
analysis. It is divided in three segments, Midlands, Southern and Northern. Out of which
Midlands in not able to generate higher profits for the organization. Further, NPV and ARR of
the investment have been evaluated and it is advised that the entity should invest in the project.
There is an increase in the revenues from all the three segments of Harvey. However, there
Midlands segment is not contributing much to it. It was 1083 million in 2015 which has
increased to 1297 million.
PART 1
Analysis of Profit and loss statement
Profit and loss account reveals the summarized revenue and expenses of the entity incurred in a
specific duration (Al and Alam, 2013).
Gross Margin Ratio
1
Paraphrase This Document
Need a fresh take? Get an instant paraphrase of this document with our AI Paraphraser
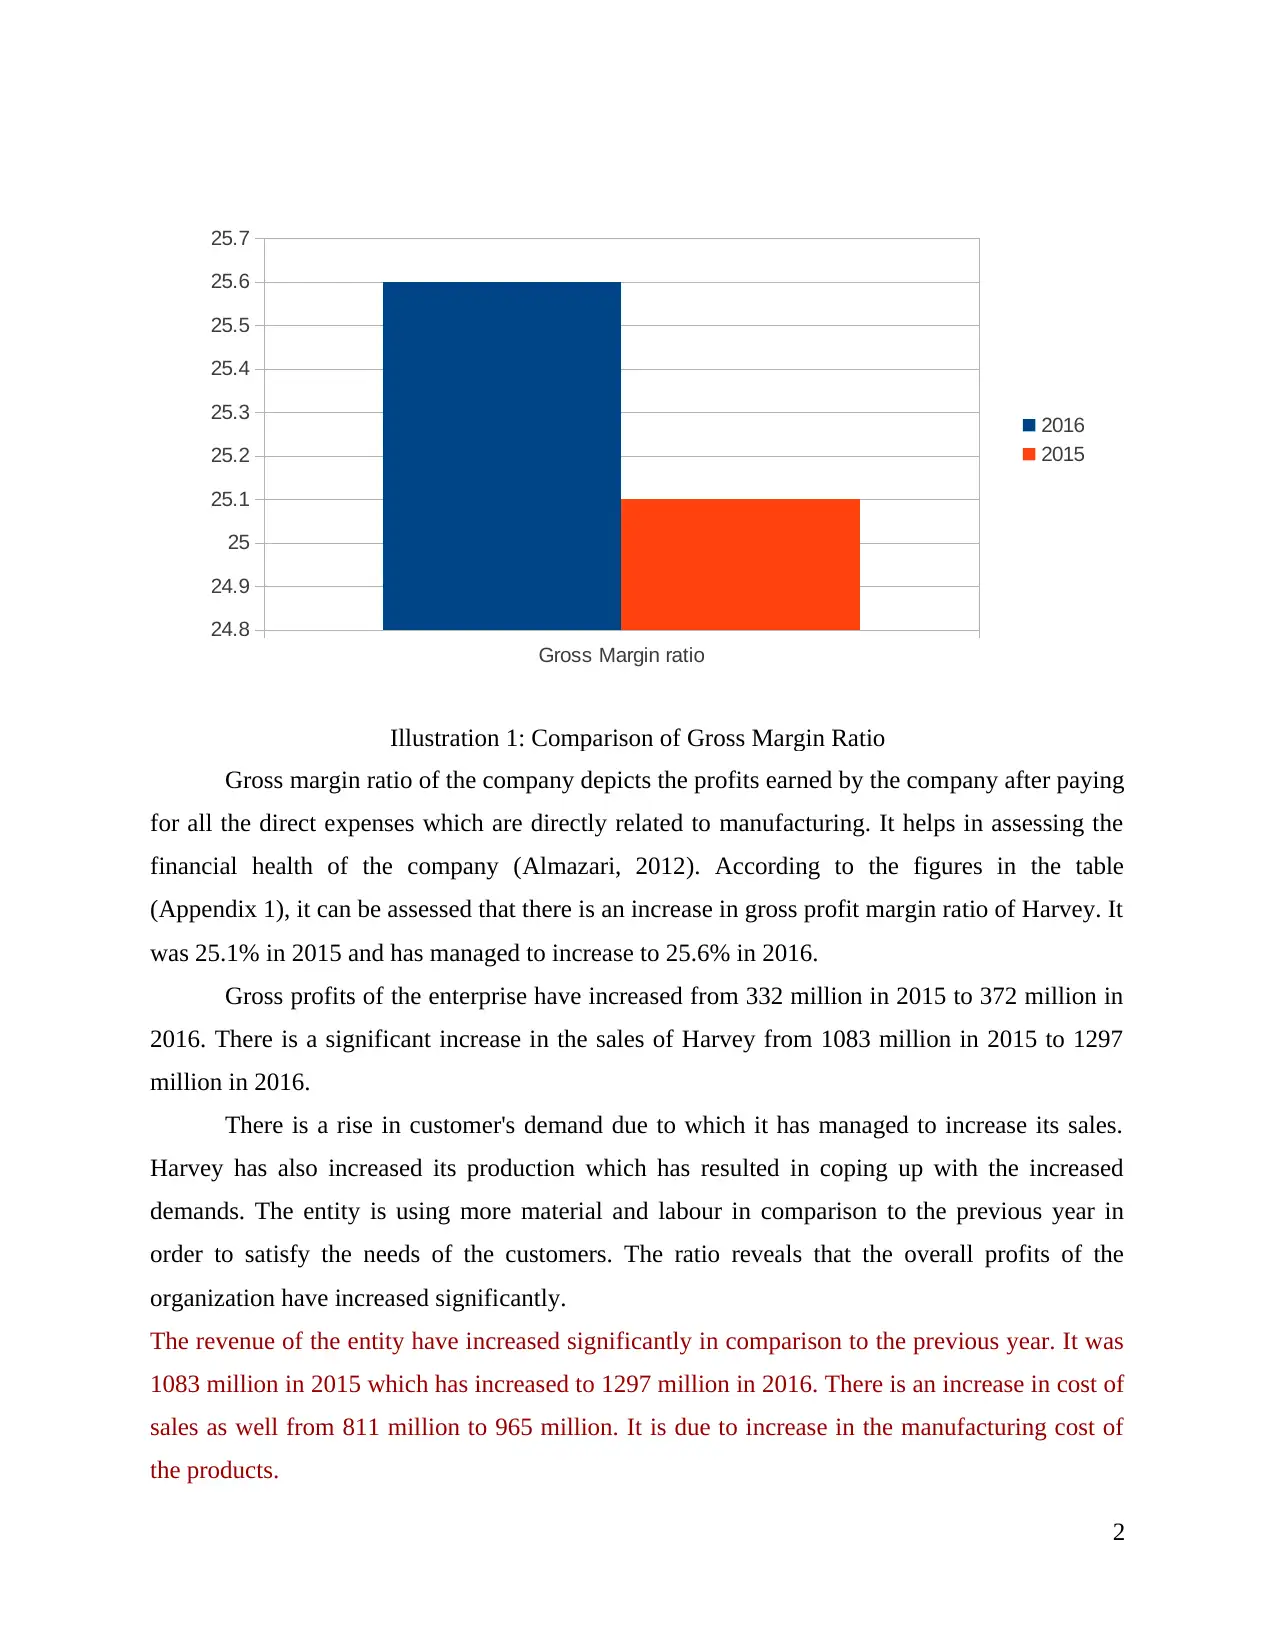
Gross margin ratio of the company depicts the profits earned by the company after paying
for all the direct expenses which are directly related to manufacturing. It helps in assessing the
financial health of the company (Almazari, 2012). According to the figures in the table
(Appendix 1), it can be assessed that there is an increase in gross profit margin ratio of Harvey. It
was 25.1% in 2015 and has managed to increase to 25.6% in 2016.
Gross profits of the enterprise have increased from 332 million in 2015 to 372 million in
2016. There is a significant increase in the sales of Harvey from 1083 million in 2015 to 1297
million in 2016.
There is a rise in customer's demand due to which it has managed to increase its sales.
Harvey has also increased its production which has resulted in coping up with the increased
demands. The entity is using more material and labour in comparison to the previous year in
order to satisfy the needs of the customers. The ratio reveals that the overall profits of the
organization have increased significantly.
The revenue of the entity have increased significantly in comparison to the previous year. It was
1083 million in 2015 which has increased to 1297 million in 2016. There is an increase in cost of
sales as well from 811 million to 965 million. It is due to increase in the manufacturing cost of
the products.
2
Gross Margin ratio
24.8
24.9
25
25.1
25.2
25.3
25.4
25.5
25.6
25.7
2016
2015
Illustration 1: Comparison of Gross Margin Ratio
Net Margin Ratio
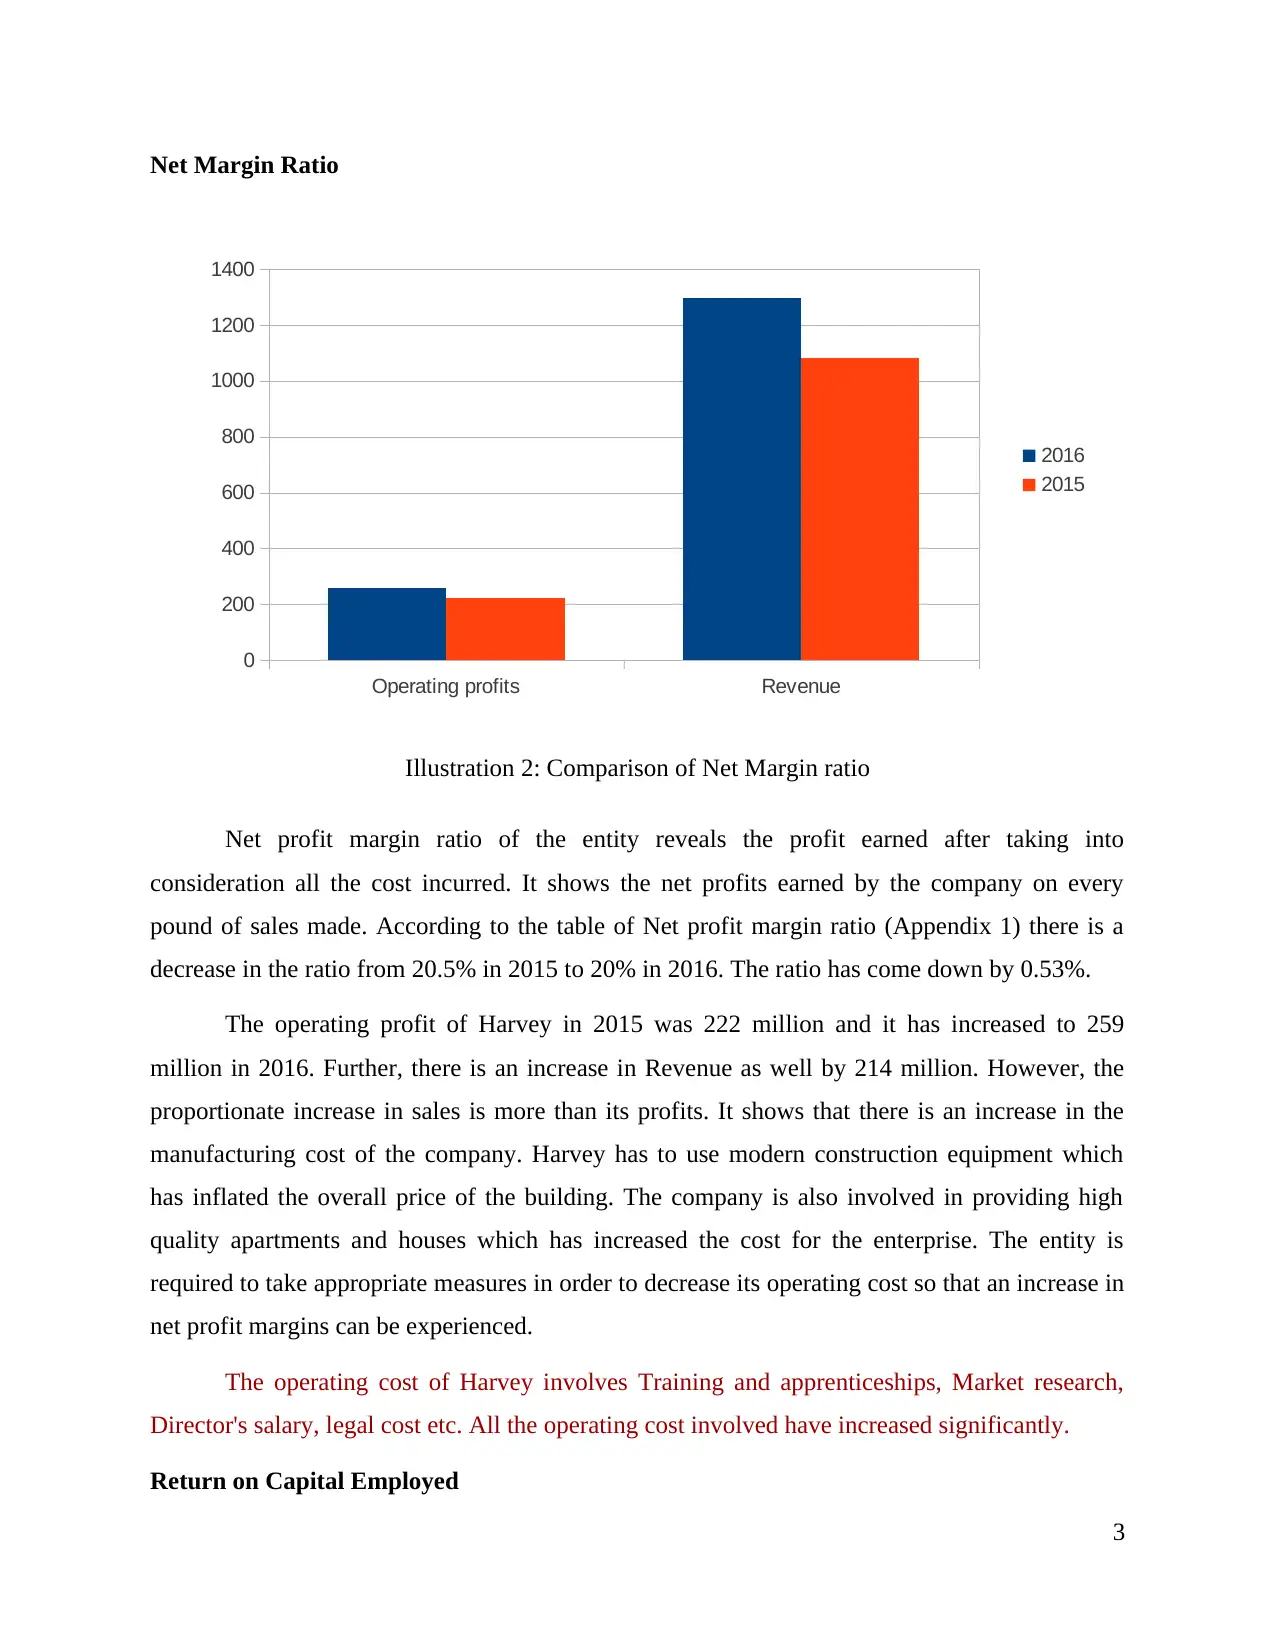
Net profit margin ratio of the entity reveals the profit earned after taking into
consideration all the cost incurred. It shows the net profits earned by the company on every
pound of sales made. According to the table of Net profit margin ratio (Appendix 1) there is a
decrease in the ratio from 20.5% in 2015 to 20% in 2016. The ratio has come down by 0.53%.
The operating profit of Harvey in 2015 was 222 million and it has increased to 259
million in 2016. Further, there is an increase in Revenue as well by 214 million. However, the
proportionate increase in sales is more than its profits. It shows that there is an increase in the
manufacturing cost of the company. Harvey has to use modern construction equipment which
has inflated the overall price of the building. The company is also involved in providing high
quality apartments and houses which has increased the cost for the enterprise. The entity is
required to take appropriate measures in order to decrease its operating cost so that an increase in
net profit margins can be experienced.
The operating cost of Harvey involves Training and apprenticeships, Market research,
Director's salary, legal cost etc. All the operating cost involved have increased significantly.
Return on Capital Employed
3
Operating profits Revenue
0
200
400
600
800
1000
1200
1400
2016
2015
Illustration 2: Comparison of Net Margin ratio
⊘ This is a preview!⊘
Do you want full access?
Subscribe today to unlock all pages.
Trusted by 1+ million students worldwide
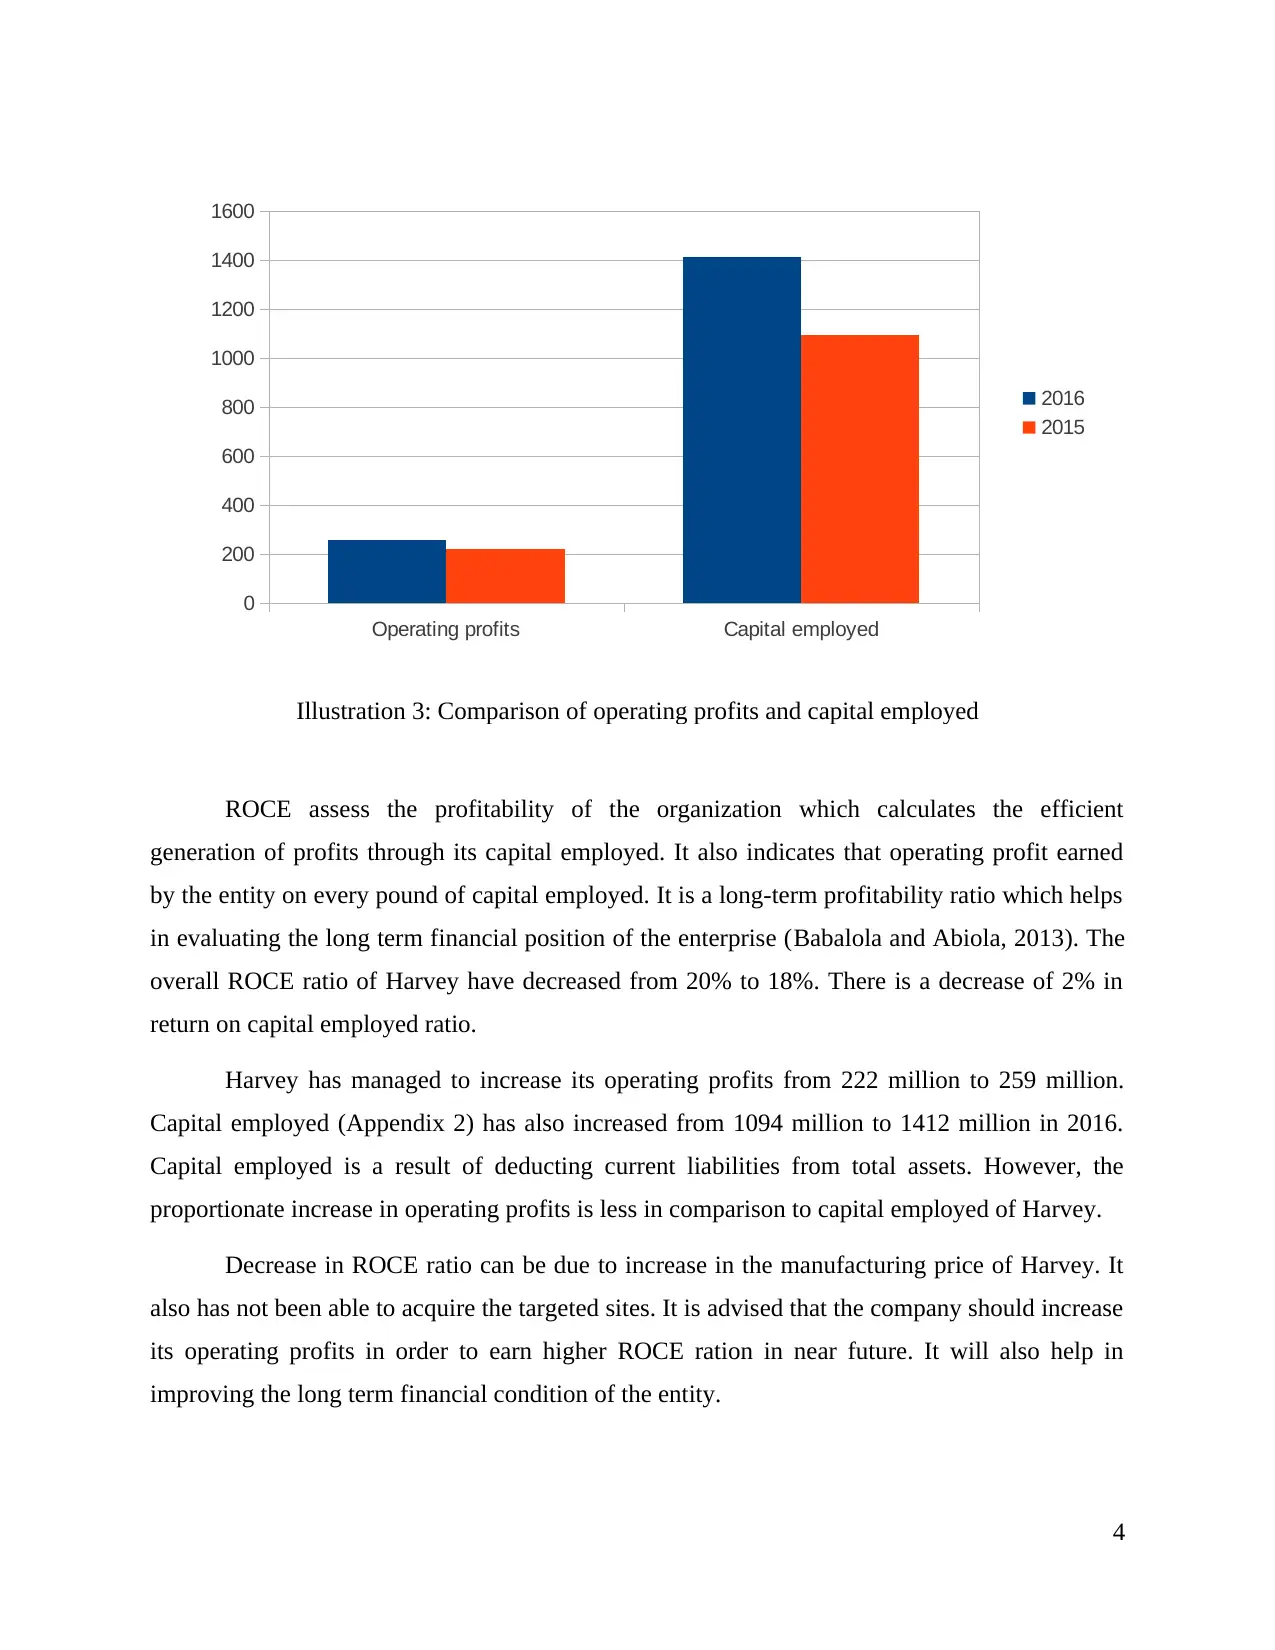
ROCE assess the profitability of the organization which calculates the efficient
generation of profits through its capital employed. It also indicates that operating profit earned
by the entity on every pound of capital employed. It is a long-term profitability ratio which helps
in evaluating the long term financial position of the enterprise (Babalola and Abiola, 2013). The
overall ROCE ratio of Harvey have decreased from 20% to 18%. There is a decrease of 2% in
return on capital employed ratio.
Harvey has managed to increase its operating profits from 222 million to 259 million.
Capital employed (Appendix 2) has also increased from 1094 million to 1412 million in 2016.
Capital employed is a result of deducting current liabilities from total assets. However, the
proportionate increase in operating profits is less in comparison to capital employed of Harvey.
Decrease in ROCE ratio can be due to increase in the manufacturing price of Harvey. It
also has not been able to acquire the targeted sites. It is advised that the company should increase
its operating profits in order to earn higher ROCE ration in near future. It will also help in
improving the long term financial condition of the entity.
4
Operating profits Capital employed
0
200
400
600
800
1000
1200
1400
1600
2016
2015
Illustration 3: Comparison of operating profits and capital employed
Paraphrase This Document
Need a fresh take? Get an instant paraphrase of this document with our AI Paraphraser
Analysing the Balance Sheet of Harvey
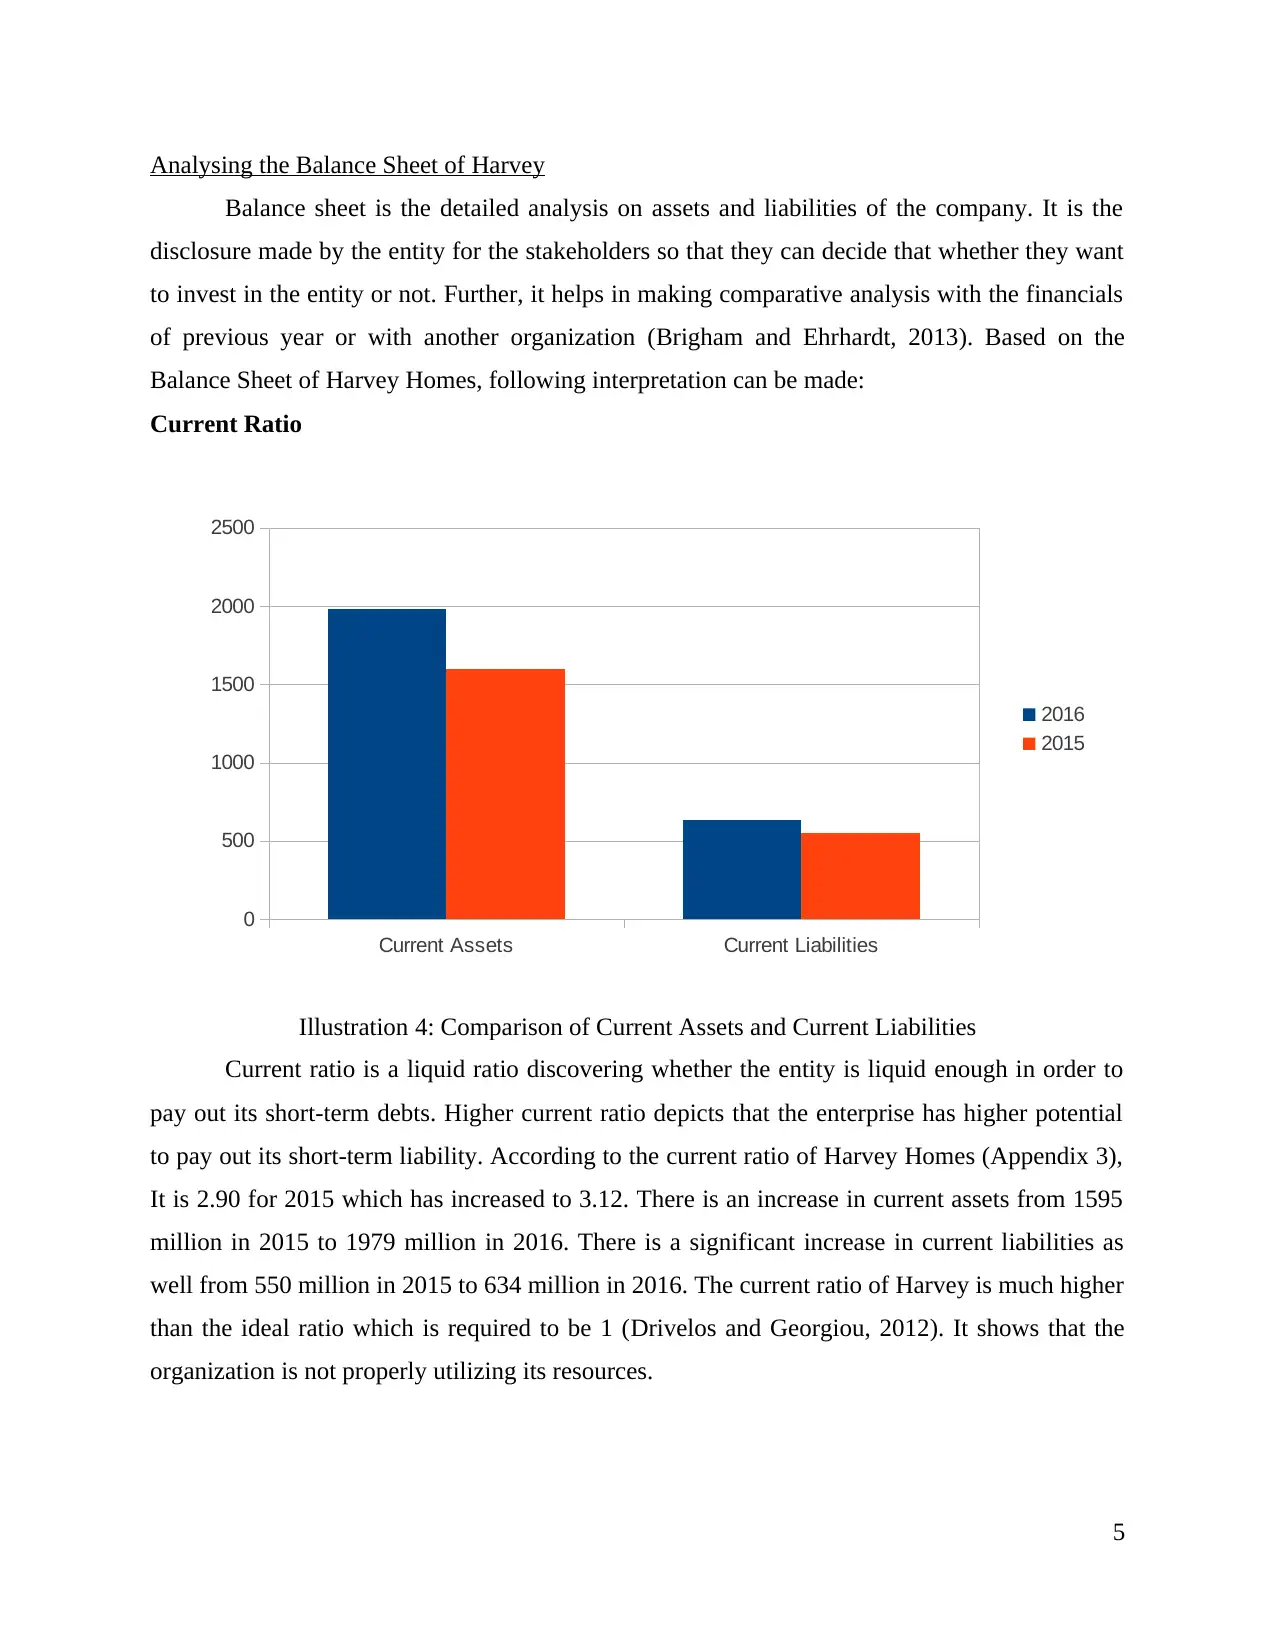
Balance sheet is the detailed analysis on assets and liabilities of the company. It is the
disclosure made by the entity for the stakeholders so that they can decide that whether they want
to invest in the entity or not. Further, it helps in making comparative analysis with the financials
of previous year or with another organization (Brigham and Ehrhardt, 2013). Based on the
Balance Sheet of Harvey Homes, following interpretation can be made:
Current Ratio
Current ratio is a liquid ratio discovering whether the entity is liquid enough in order to
pay out its short-term debts. Higher current ratio depicts that the enterprise has higher potential
to pay out its short-term liability. According to the current ratio of Harvey Homes (Appendix 3),
It is 2.90 for 2015 which has increased to 3.12. There is an increase in current assets from 1595
million in 2015 to 1979 million in 2016. There is a significant increase in current liabilities as
well from 550 million in 2015 to 634 million in 2016. The current ratio of Harvey is much higher
than the ideal ratio which is required to be 1 (Drivelos and Georgiou, 2012). It shows that the
organization is not properly utilizing its resources.
5
Current Assets Current Liabilities
0
500
1000
1500
2000
2500
2016
2015
Illustration 4: Comparison of Current Assets and Current Liabilities
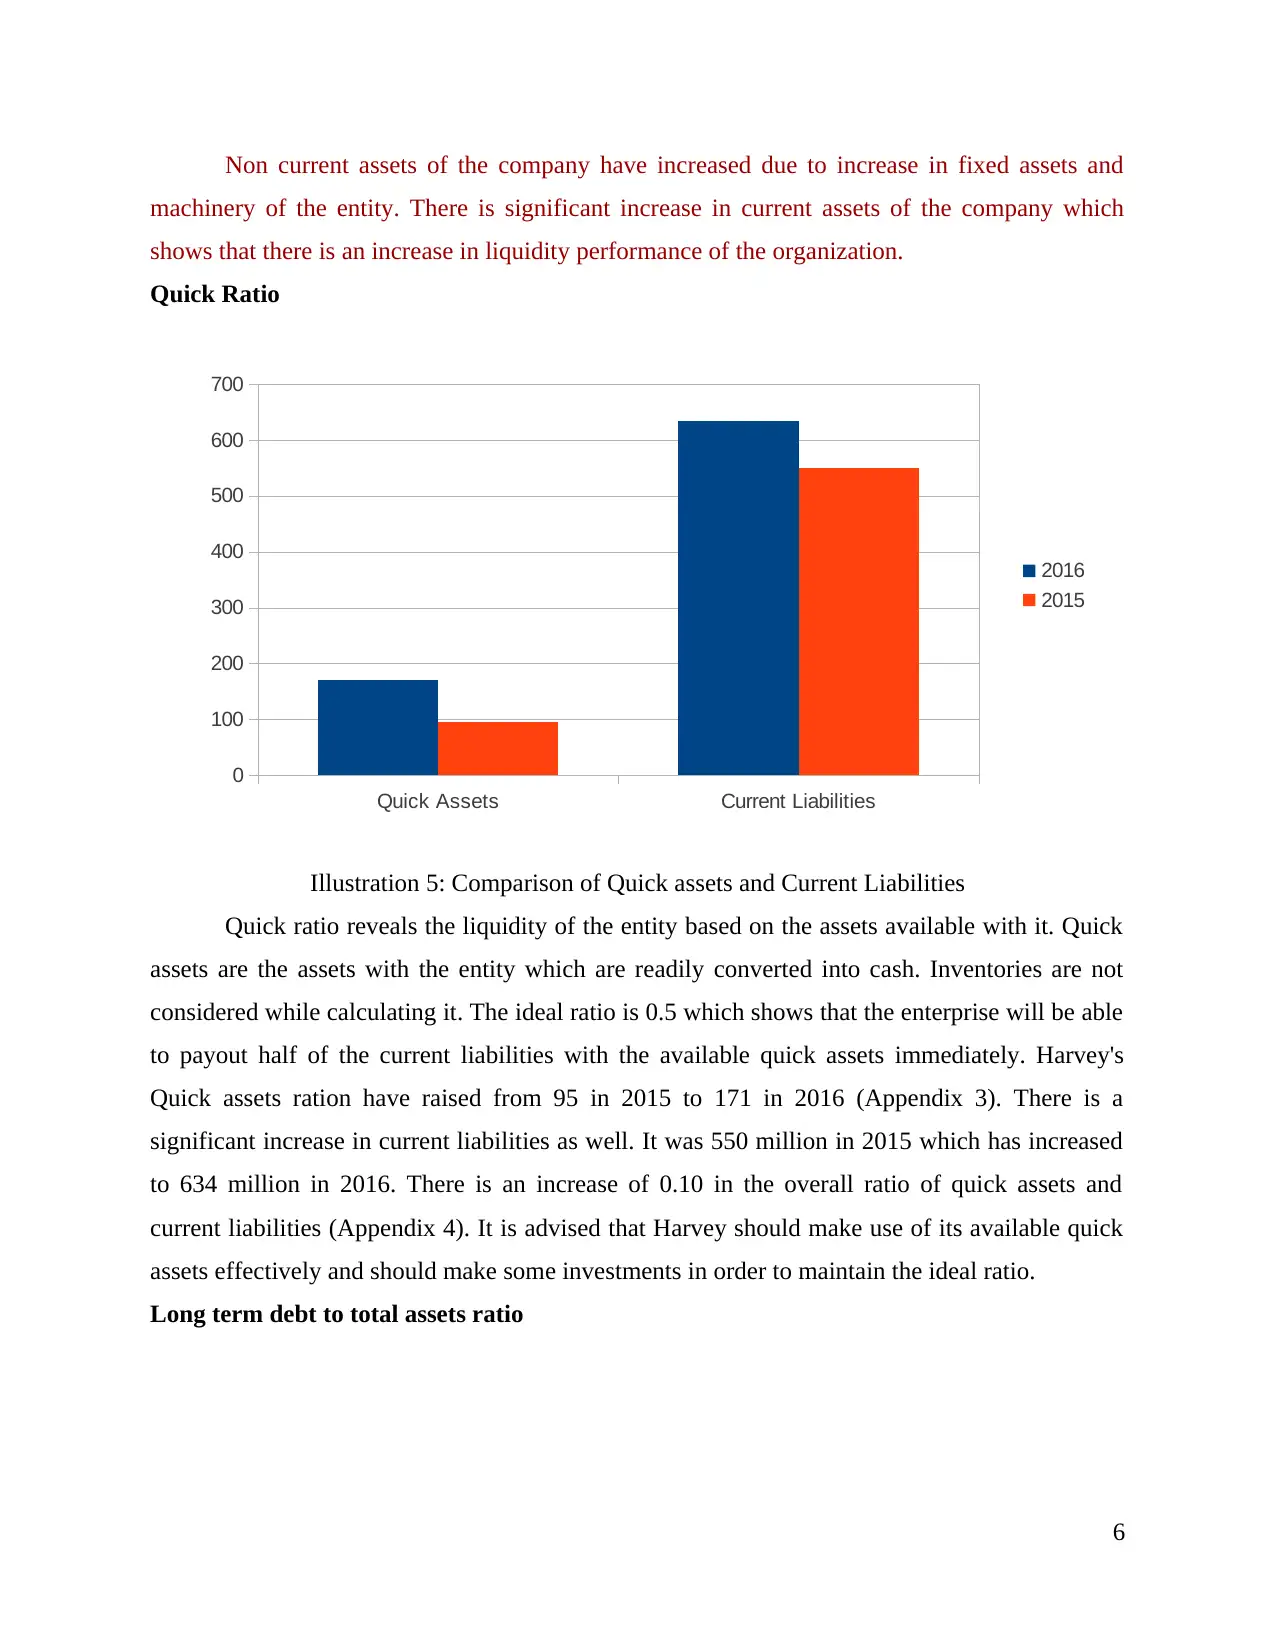
Non current assets of the company have increased due to increase in fixed assets and
machinery of the entity. There is significant increase in current assets of the company which
shows that there is an increase in liquidity performance of the organization.
Quick Ratio
Quick ratio reveals the liquidity of the entity based on the assets available with it. Quick
assets are the assets with the entity which are readily converted into cash. Inventories are not
considered while calculating it. The ideal ratio is 0.5 which shows that the enterprise will be able
to payout half of the current liabilities with the available quick assets immediately. Harvey's
Quick assets ration have raised from 95 in 2015 to 171 in 2016 (Appendix 3). There is a
significant increase in current liabilities as well. It was 550 million in 2015 which has increased
to 634 million in 2016. There is an increase of 0.10 in the overall ratio of quick assets and
current liabilities (Appendix 4). It is advised that Harvey should make use of its available quick
assets effectively and should make some investments in order to maintain the ideal ratio.
Long term debt to total assets ratio
6
Quick Assets Current Liabilities
0
100
200
300
400
500
600
700
2016
2015
Illustration 5: Comparison of Quick assets and Current Liabilities
⊘ This is a preview!⊘
Do you want full access?
Subscribe today to unlock all pages.
Trusted by 1+ million students worldwide
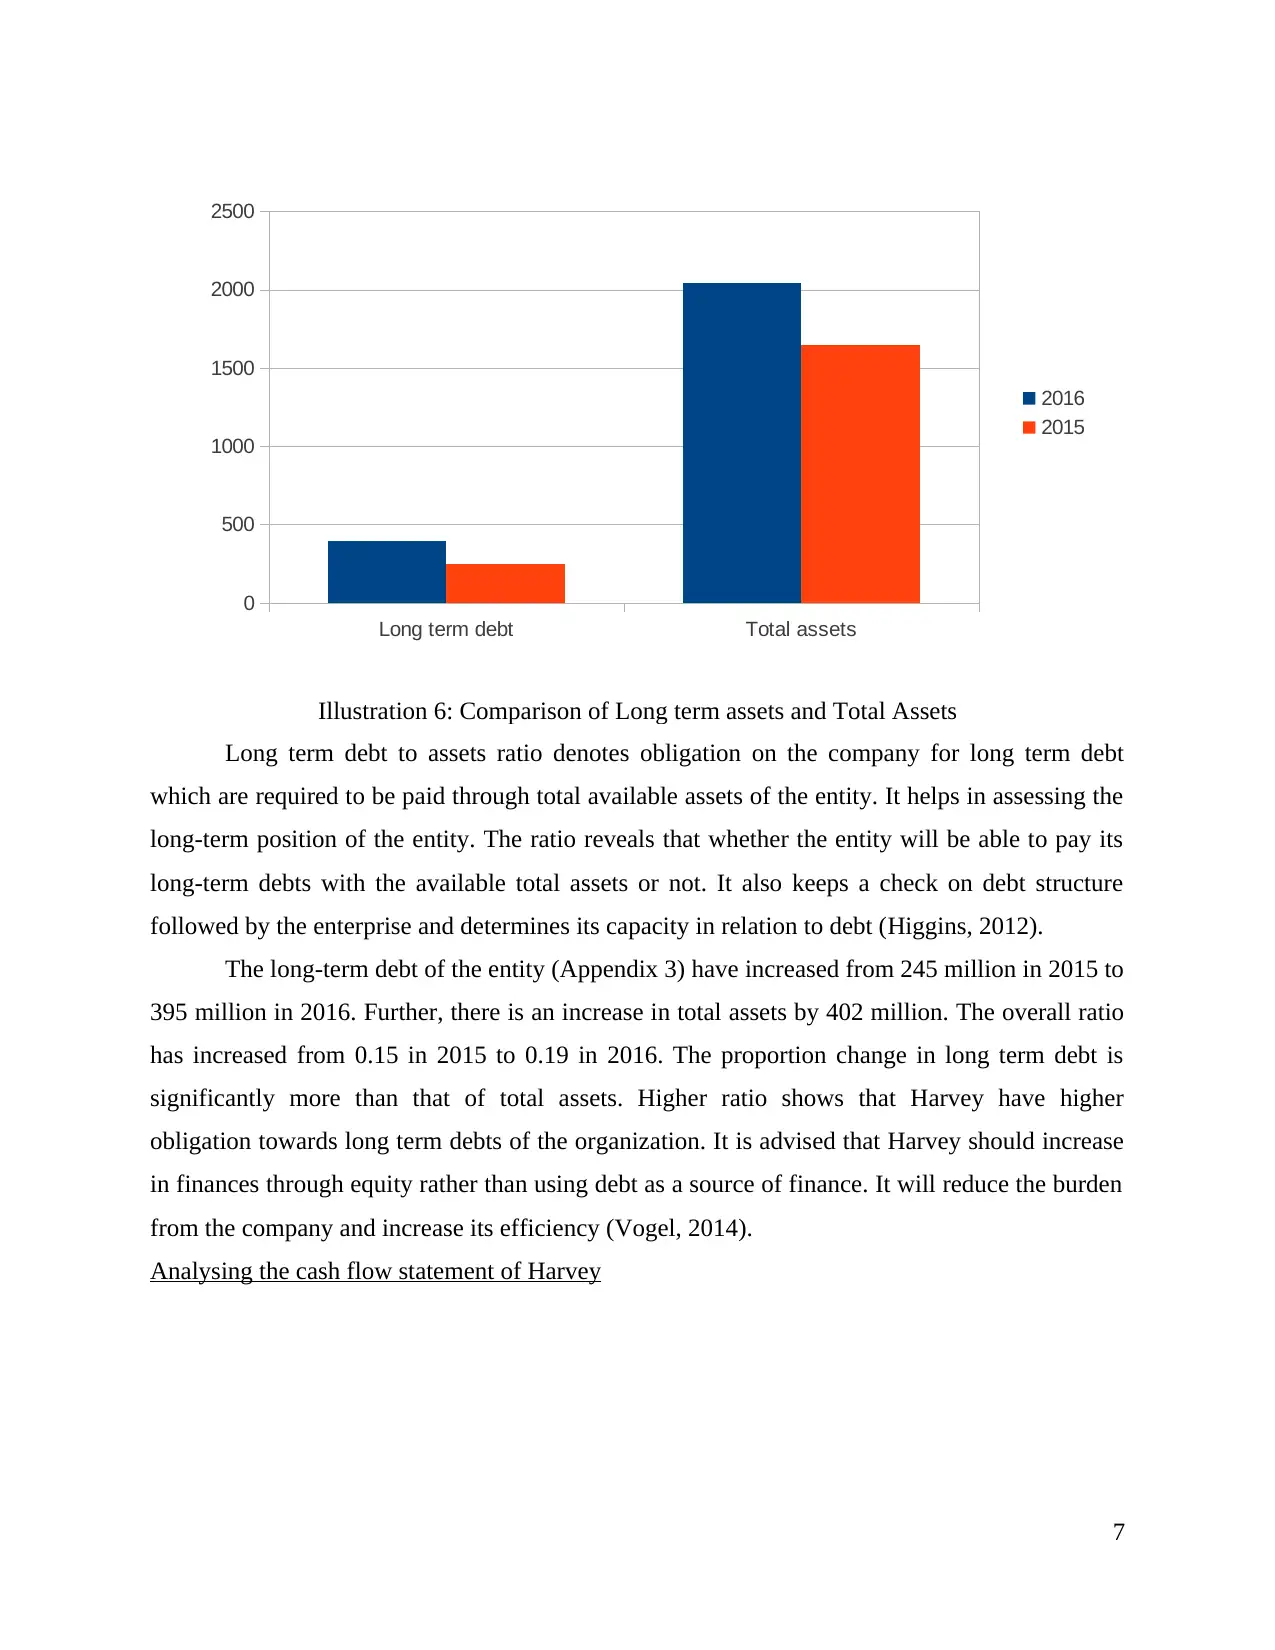
Long term debt to assets ratio denotes obligation on the company for long term debt
which are required to be paid through total available assets of the entity. It helps in assessing the
long-term position of the entity. The ratio reveals that whether the entity will be able to pay its
long-term debts with the available total assets or not. It also keeps a check on debt structure
followed by the enterprise and determines its capacity in relation to debt (Higgins, 2012).
The long-term debt of the entity (Appendix 3) have increased from 245 million in 2015 to
395 million in 2016. Further, there is an increase in total assets by 402 million. The overall ratio
has increased from 0.15 in 2015 to 0.19 in 2016. The proportion change in long term debt is
significantly more than that of total assets. Higher ratio shows that Harvey have higher
obligation towards long term debts of the organization. It is advised that Harvey should increase
in finances through equity rather than using debt as a source of finance. It will reduce the burden
from the company and increase its efficiency (Vogel, 2014).
Analysing the cash flow statement of Harvey
7
Long term debt Total assets
0
500
1000
1500
2000
2500
2016
2015
Illustration 6: Comparison of Long term assets and Total Assets
Paraphrase This Document
Need a fresh take? Get an instant paraphrase of this document with our AI Paraphraser
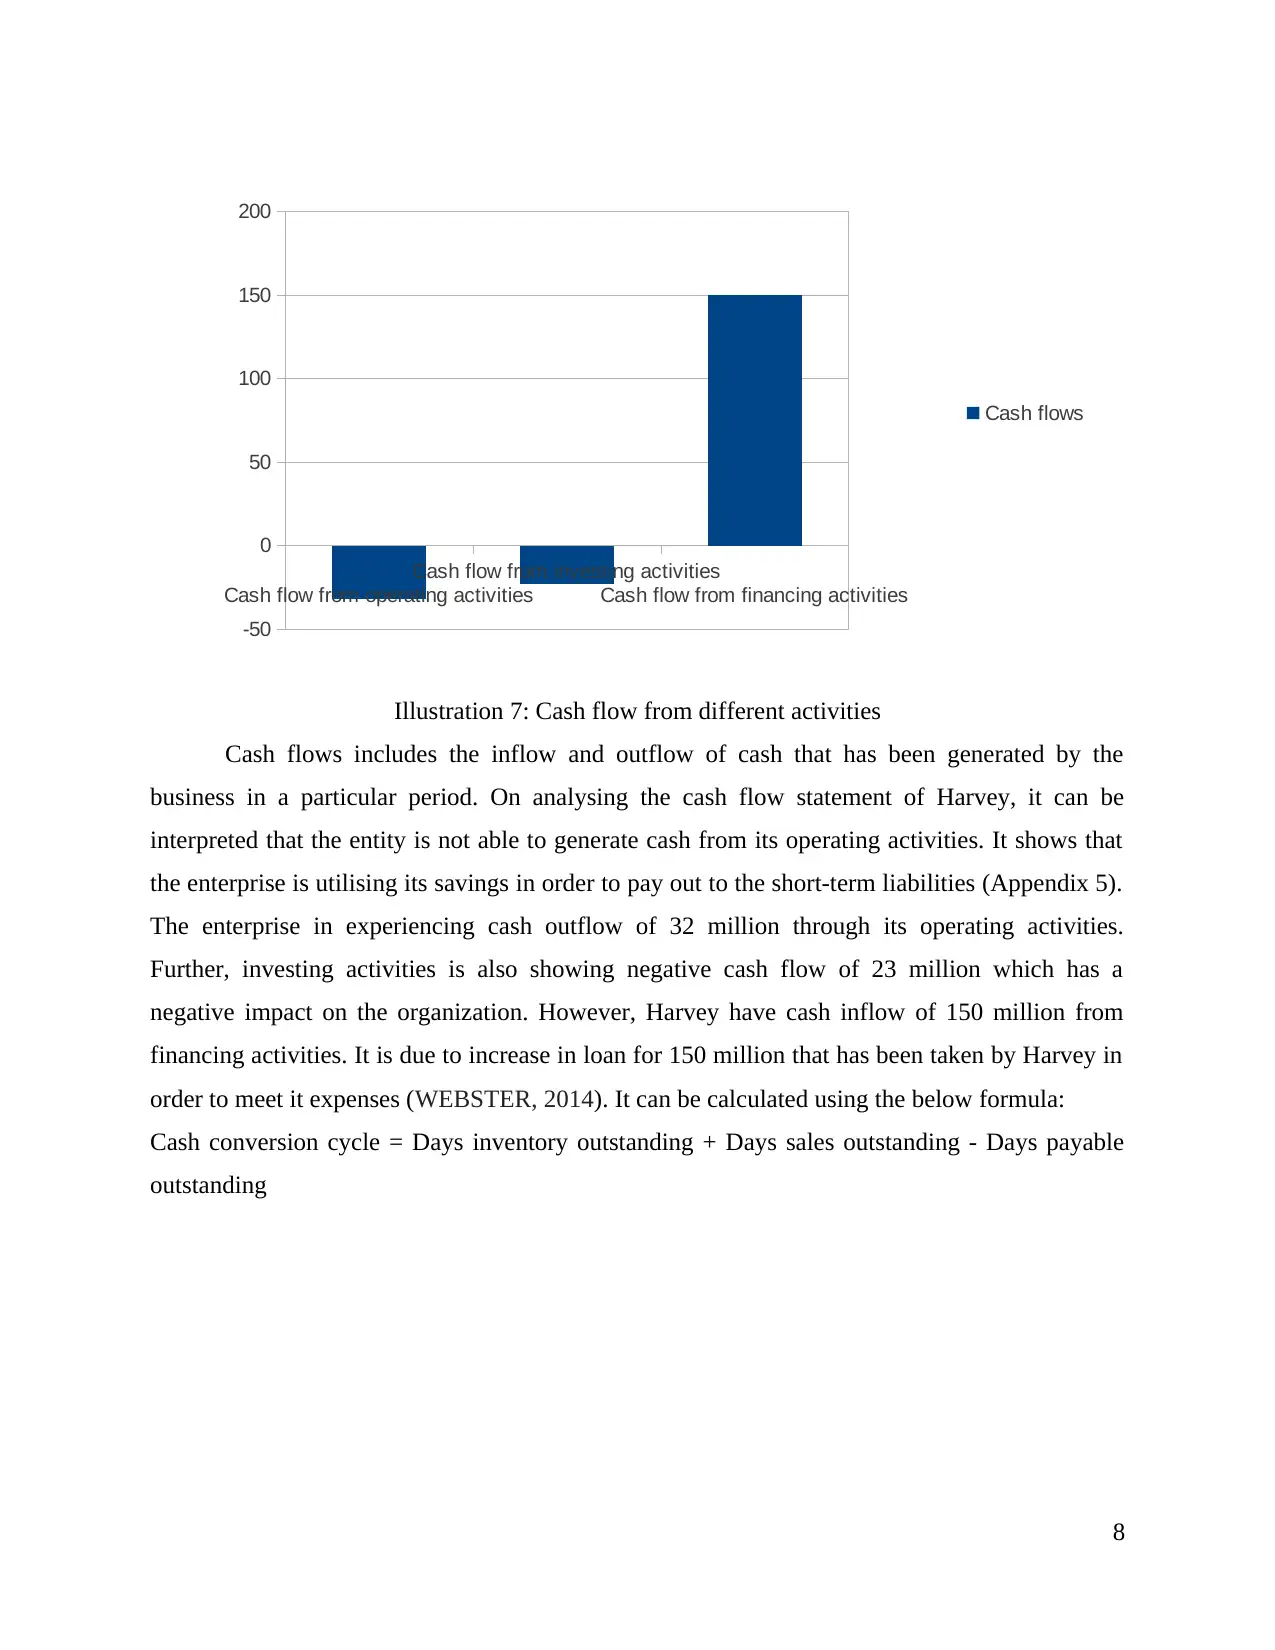
Cash flows includes the inflow and outflow of cash that has been generated by the
business in a particular period. On analysing the cash flow statement of Harvey, it can be
interpreted that the entity is not able to generate cash from its operating activities. It shows that
the enterprise is utilising its savings in order to pay out to the short-term liabilities (Appendix 5).
The enterprise in experiencing cash outflow of 32 million through its operating activities.
Further, investing activities is also showing negative cash flow of 23 million which has a
negative impact on the organization. However, Harvey have cash inflow of 150 million from
financing activities. It is due to increase in loan for 150 million that has been taken by Harvey in
order to meet it expenses (WEBSTER, 2014). It can be calculated using the below formula:
Cash conversion cycle = Days inventory outstanding + Days sales outstanding - Days payable
outstanding
8
Cash flow from operating activities
Cash flow from investing activities
Cash flow from financing activities
-50
0
50
100
150
200
Cash flows
Illustration 7: Cash flow from different activities
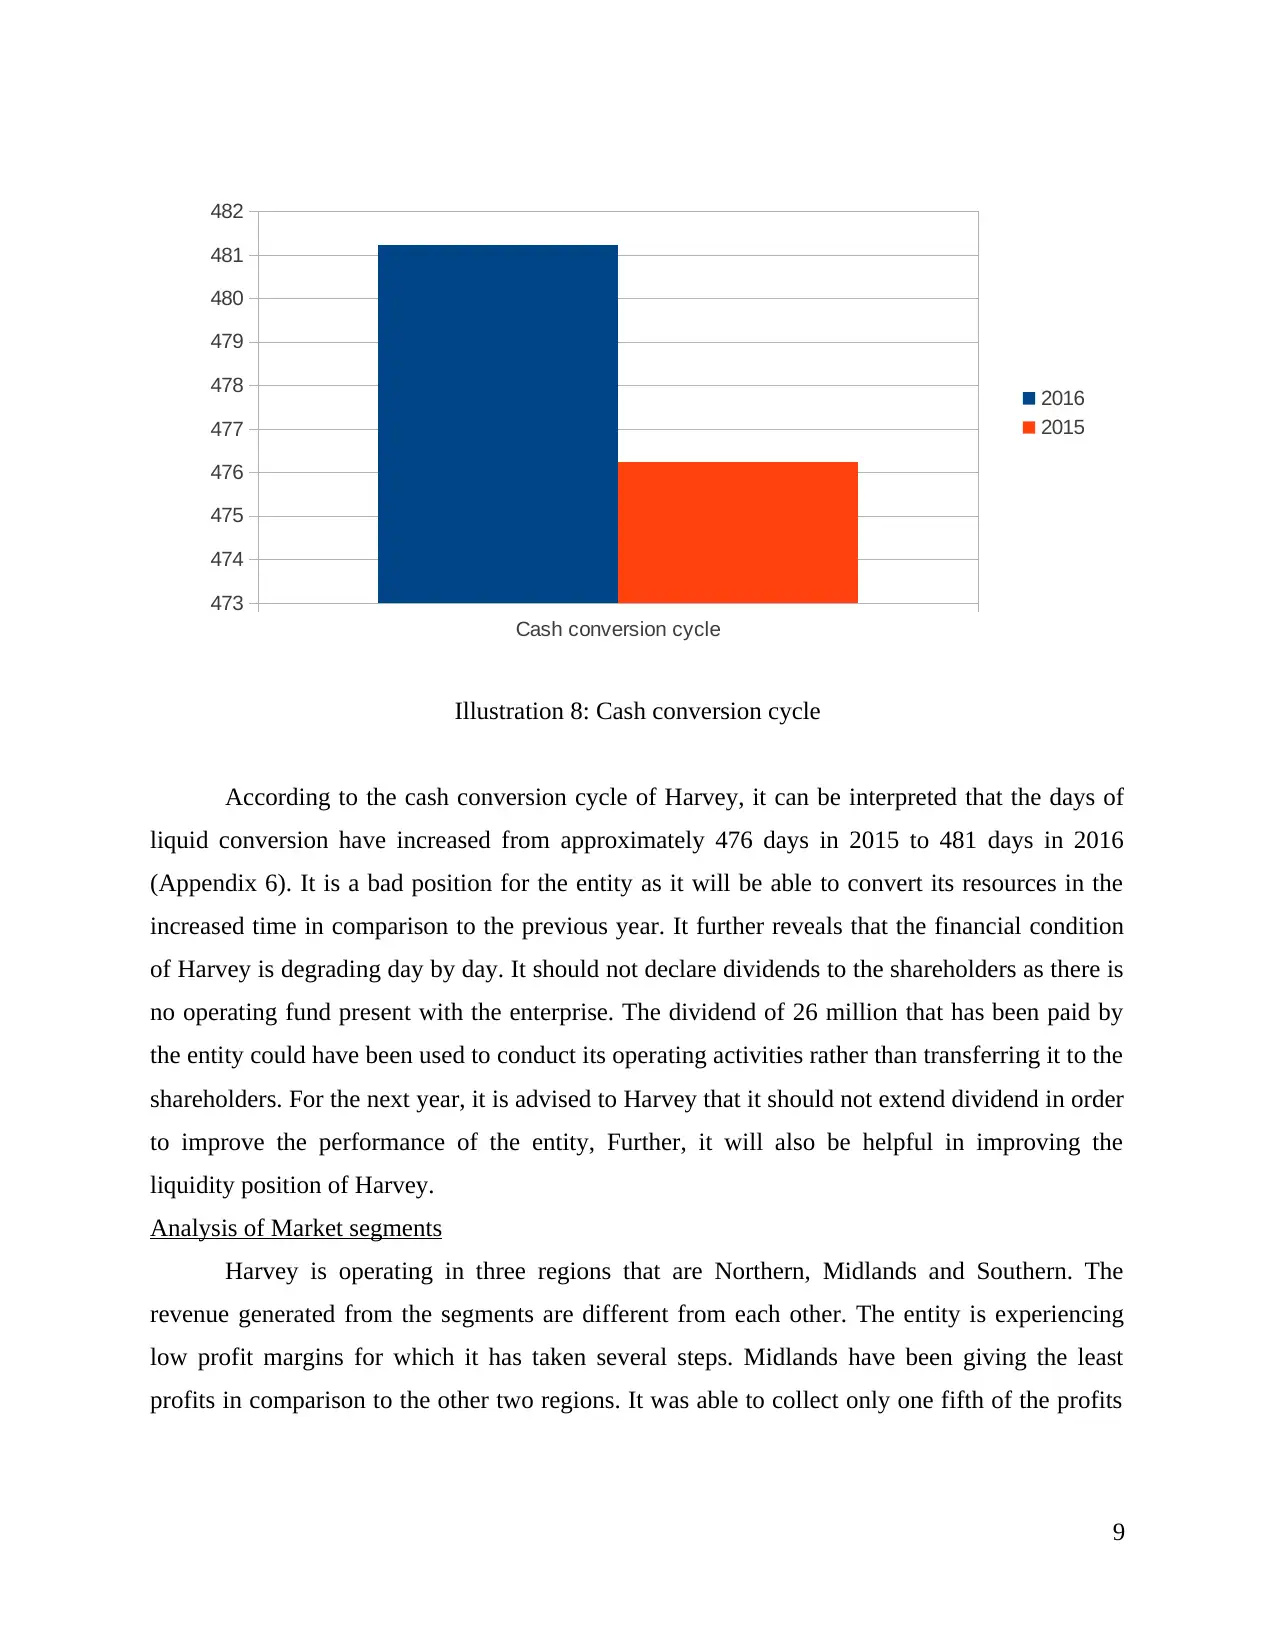
According to the cash conversion cycle of Harvey, it can be interpreted that the days of
liquid conversion have increased from approximately 476 days in 2015 to 481 days in 2016
(Appendix 6). It is a bad position for the entity as it will be able to convert its resources in the
increased time in comparison to the previous year. It further reveals that the financial condition
of Harvey is degrading day by day. It should not declare dividends to the shareholders as there is
no operating fund present with the enterprise. The dividend of 26 million that has been paid by
the entity could have been used to conduct its operating activities rather than transferring it to the
shareholders. For the next year, it is advised to Harvey that it should not extend dividend in order
to improve the performance of the entity, Further, it will also be helpful in improving the
liquidity position of Harvey.
Analysis of Market segments
Harvey is operating in three regions that are Northern, Midlands and Southern. The
revenue generated from the segments are different from each other. The entity is experiencing
low profit margins for which it has taken several steps. Midlands have been giving the least
profits in comparison to the other two regions. It was able to collect only one fifth of the profits
9
Cash conversion cycle
473
474
475
476
477
478
479
480
481
482
2016
2015
Illustration 8: Cash conversion cycle
⊘ This is a preview!⊘
Do you want full access?
Subscribe today to unlock all pages.
Trusted by 1+ million students worldwide
1 out of 23
Related Documents


Your All-in-One AI-Powered Toolkit for Academic Success.
+13062052269
info@desklib.com
Available 24*7 on WhatsApp / Email
![[object Object]](/_next/static/media/star-bottom.7253800d.svg)
Unlock your academic potential
Copyright © 2020–2026 A2Z Services. All Rights Reserved. Developed and managed by ZUCOL.