Financial Statement Analysis Report: Carpet Right PLC and Halfords
VerifiedAdded on 2020/10/23
|13
|3735
|402
Report
AI Summary
This report presents a comprehensive financial statement analysis of two UK-based companies, Carpet Right PLC and Halfords Group PLC. The analysis encompasses a detailed examination of key financial statements, including the income statement, balance sheet, and statement of cash flows. The core of the report focuses on ratio analysis, covering liquidity, solvency, efficiency, and profitability ratios. The report interprets the trends and implications of these ratios, providing insights into the financial health and performance of each company. Furthermore, the analysis extends to cash flow statements, exploring the investing, operating, and financing activities of both companies. The report also identifies and discusses the internal and external factors influencing changes in cash flow, ratios, and overall financial performance, offering a holistic view of the companies' financial positions and the drivers behind them. The report concludes with an assessment of the companies' financial strengths and weaknesses.
FINANCIAL
STATEMENT
ANALYSIS
STATEMENT
ANALYSIS
Paraphrase This Document
Need a fresh take? Get an instant paraphrase of this document with our AI Paraphraser
Table of Contents
INTRODUCTION...........................................................................................................................1
MAIN BODY...................................................................................................................................1
TASK 3............................................................................................................................................1
Importance of cash flow, ratio and trends...................................................................................1
Ratio Analysis and Interpretation................................................................................................2
Cash flow analysis.......................................................................................................................8
CONCLUSION .............................................................................................................................10
REFERENCES..............................................................................................................................11
.......................................................................................................................................................11
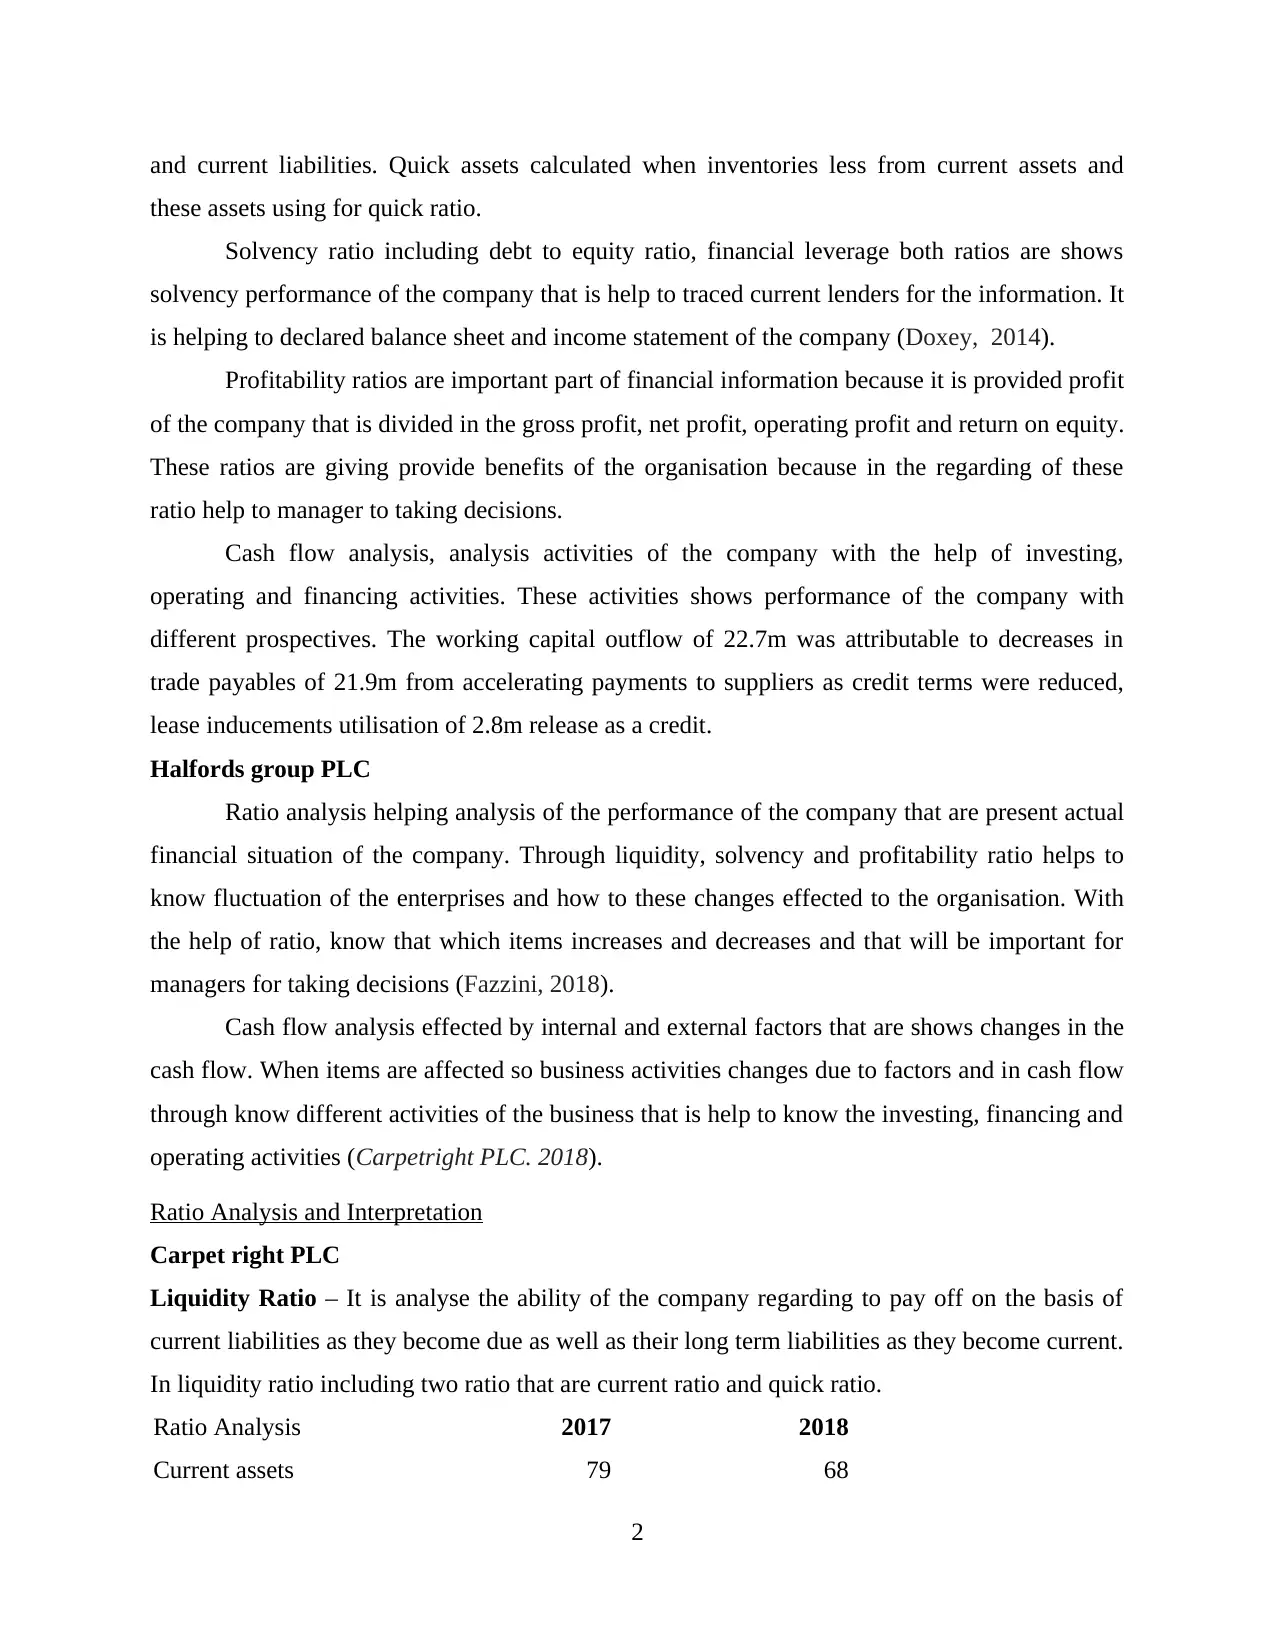
INTRODUCTION
Financial statement analysis is the process that determinant and understand financial
position of the organisation. It is helps to company for taking better economic decision for the
strength and adaptability of a business and giving accurate financial information (Cooper, 2017).
These statements includes the income statement that presents net profit/loss, balance sheet for
identify assets and liabilities, statement of cash flows for business activities and a statement of
changes in equity to show changes in capital. On the basis of this report selected company Carpet
right PLC and Halfords group PLC. Carpet Right PLC based on UK that are largest British
retailer of floor coverings, beds, blinds and curtains. It operates 545 stores in Belgium,
Netherlands and in UK. Halfords group PLC operate business in two segments that are retail and
car servicing. Its subsidiaries are leisure, cycling products and retails automotive in the united
kingdom and the republic of Ireland.
In this report covers ratio analysis, cash flow analysis and interpretation of both
companies, trends, financial data and depth analysis and interpretation of both companies.
Reasons of changes in cash flow, ration and trends due to changes in internal and external
factors.
MAIN BODY
TASK 3
Importance of cash flow, ratio and trends
In this report analysis those reasons factors are effect to the company's ratio and cash
flow analysis. Financial statement of both companies that are shows performance of the company
on the basis of ratios, cash flow analysis, general financial data and share price movements.
Analysis of ratios on the basis of efficiency, liquidity, solvency and investment profitability that
are shows companies ability for further fields (DeFusco and et.al., 2015).
Carpet right PLC
After ratio analysis of this company getting that company financial performance that are
shows liquidity ratio, in this ratio including current ratio and quick ratio. Current ratio are
presents current liabilities increases from last year 2017 that are effected to current ratio of the
company. Due to these changes coming . In quick ratio calculated on the basis of quick assets
1
⊘ This is a preview!⊘
Do you want full access?
Subscribe today to unlock all pages.
Trusted by 1+ million students worldwide
and current liabilities. Quick assets calculated when inventories less from current assets and
these assets using for quick ratio.
Solvency ratio including debt to equity ratio, financial leverage both ratios are shows
solvency performance of the company that is help to traced current lenders for the information. It
is helping to declared balance sheet and income statement of the company (Doxey, 2014).
Profitability ratios are important part of financial information because it is provided profit
of the company that is divided in the gross profit, net profit, operating profit and return on equity.
These ratios are giving provide benefits of the organisation because in the regarding of these
ratio help to manager to taking decisions.
Cash flow analysis, analysis activities of the company with the help of investing,
operating and financing activities. These activities shows performance of the company with
different prospectives. The working capital outflow of 22.7m was attributable to decreases in
trade payables of 21.9m from accelerating payments to suppliers as credit terms were reduced,
lease inducements utilisation of 2.8m release as a credit.
Halfords group PLC
Ratio analysis helping analysis of the performance of the company that are present actual
financial situation of the company. Through liquidity, solvency and profitability ratio helps to
know fluctuation of the enterprises and how to these changes effected to the organisation. With
the help of ratio, know that which items increases and decreases and that will be important for
managers for taking decisions (Fazzini, 2018).
Cash flow analysis effected by internal and external factors that are shows changes in the
cash flow. When items are affected so business activities changes due to factors and in cash flow
through know different activities of the business that is help to know the investing, financing and
operating activities (Carpetright PLC. 2018).
Ratio Analysis and Interpretation
Carpet right PLC
Liquidity Ratio – It is analyse the ability of the company regarding to pay off on the basis of
current liabilities as they become due as well as their long term liabilities as they become current.
In liquidity ratio including two ratio that are current ratio and quick ratio.
Ratio Analysis 2017 2018
Current assets 79 68
2
Paraphrase This Document
Need a fresh take? Get an instant paraphrase of this document with our AI Paraphraser
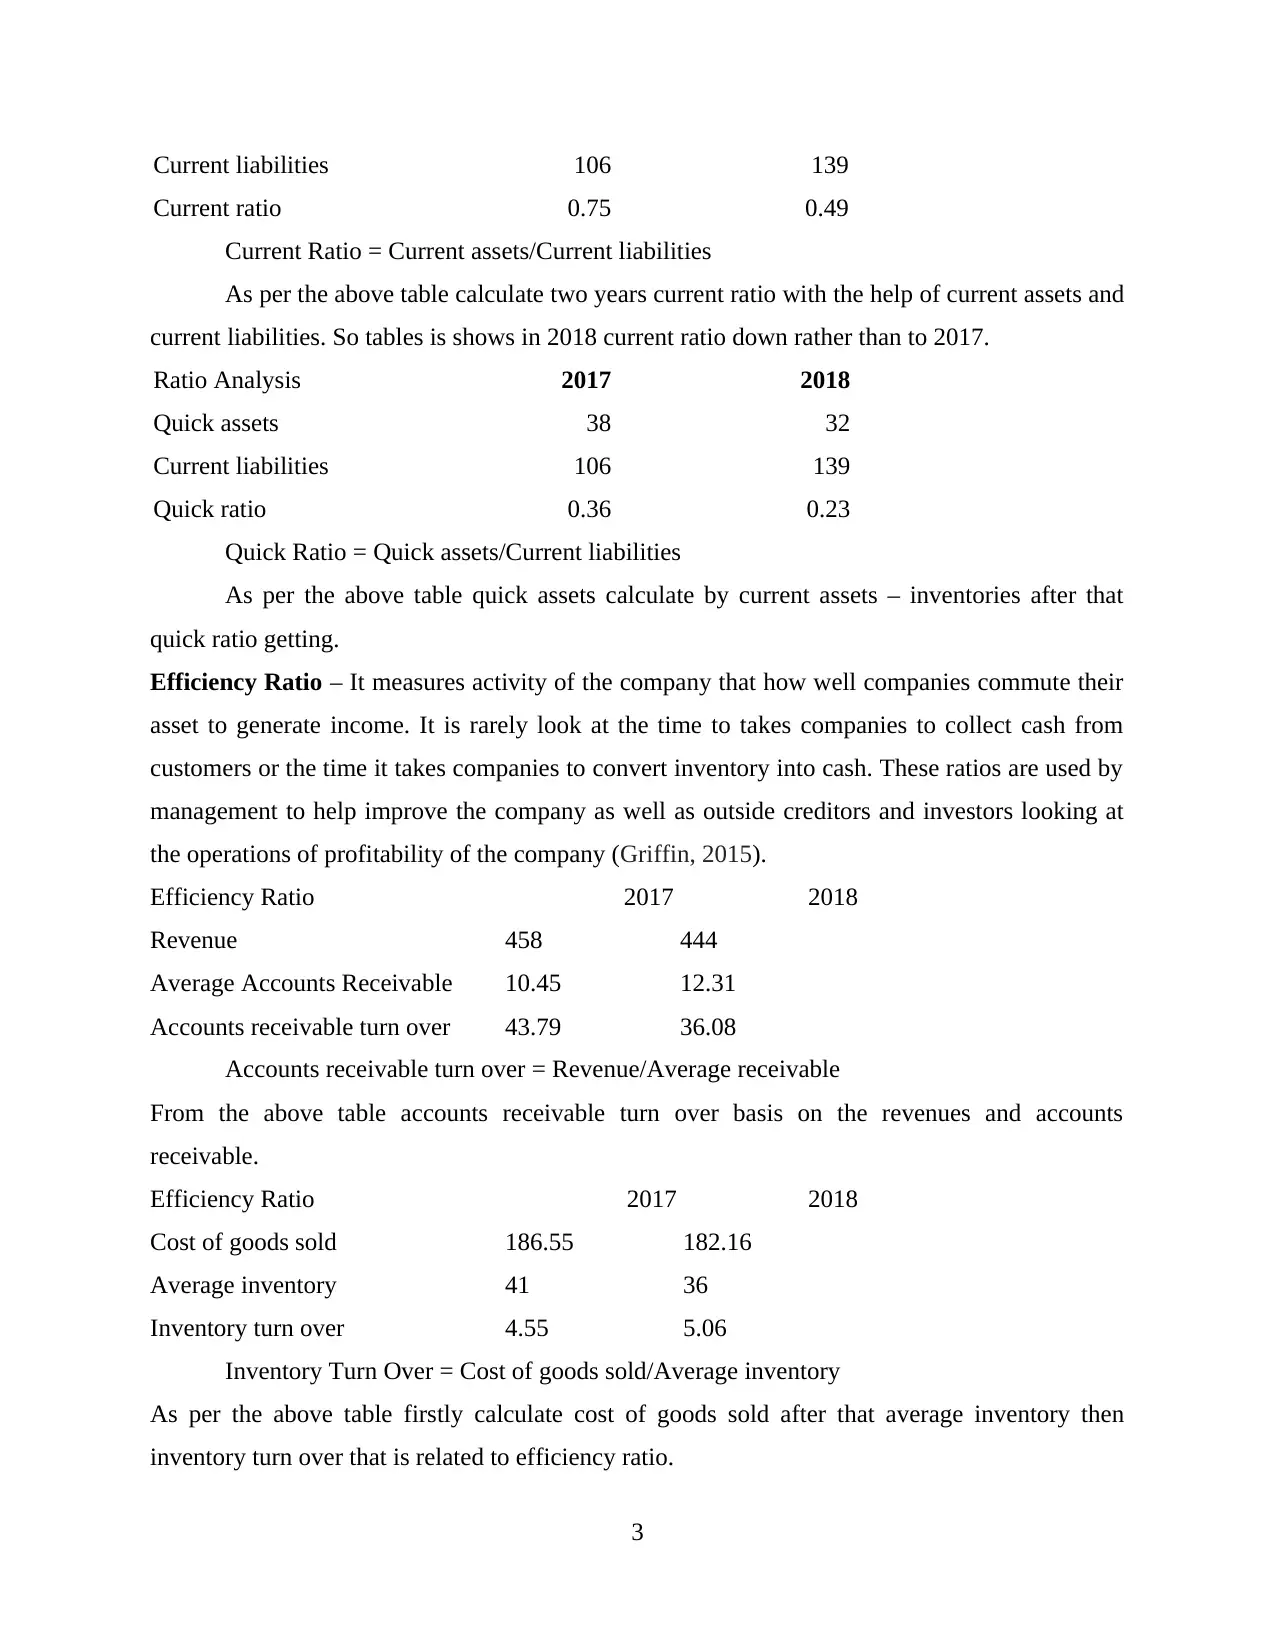
Current liabilities 106 139
Current ratio 0.75 0.49
Current Ratio = Current assets/Current liabilities
As per the above table calculate two years current ratio with the help of current assets and
current liabilities. So tables is shows in 2018 current ratio down rather than to 2017.
Ratio Analysis 2017 2018
Quick assets 38 32
Current liabilities 106 139
Quick ratio 0.36 0.23
Quick Ratio = Quick assets/Current liabilities
As per the above table quick assets calculate by current assets – inventories after that
quick ratio getting.
Efficiency Ratio – It measures activity of the company that how well companies commute their
asset to generate income. It is rarely look at the time to takes companies to collect cash from
customers or the time it takes companies to convert inventory into cash. These ratios are used by
management to help improve the company as well as outside creditors and investors looking at
the operations of profitability of the company (Griffin, 2015).
Efficiency Ratio 2017 2018
Revenue 458 444
Average Accounts Receivable 10.45 12.31
Accounts receivable turn over 43.79 36.08
Accounts receivable turn over = Revenue/Average receivable
From the above table accounts receivable turn over basis on the revenues and accounts
receivable.
Efficiency Ratio 2017 2018
Cost of goods sold 186.55 182.16
Average inventory 41 36
Inventory turn over 4.55 5.06
Inventory Turn Over = Cost of goods sold/Average inventory
As per the above table firstly calculate cost of goods sold after that average inventory then
inventory turn over that is related to efficiency ratio.
3
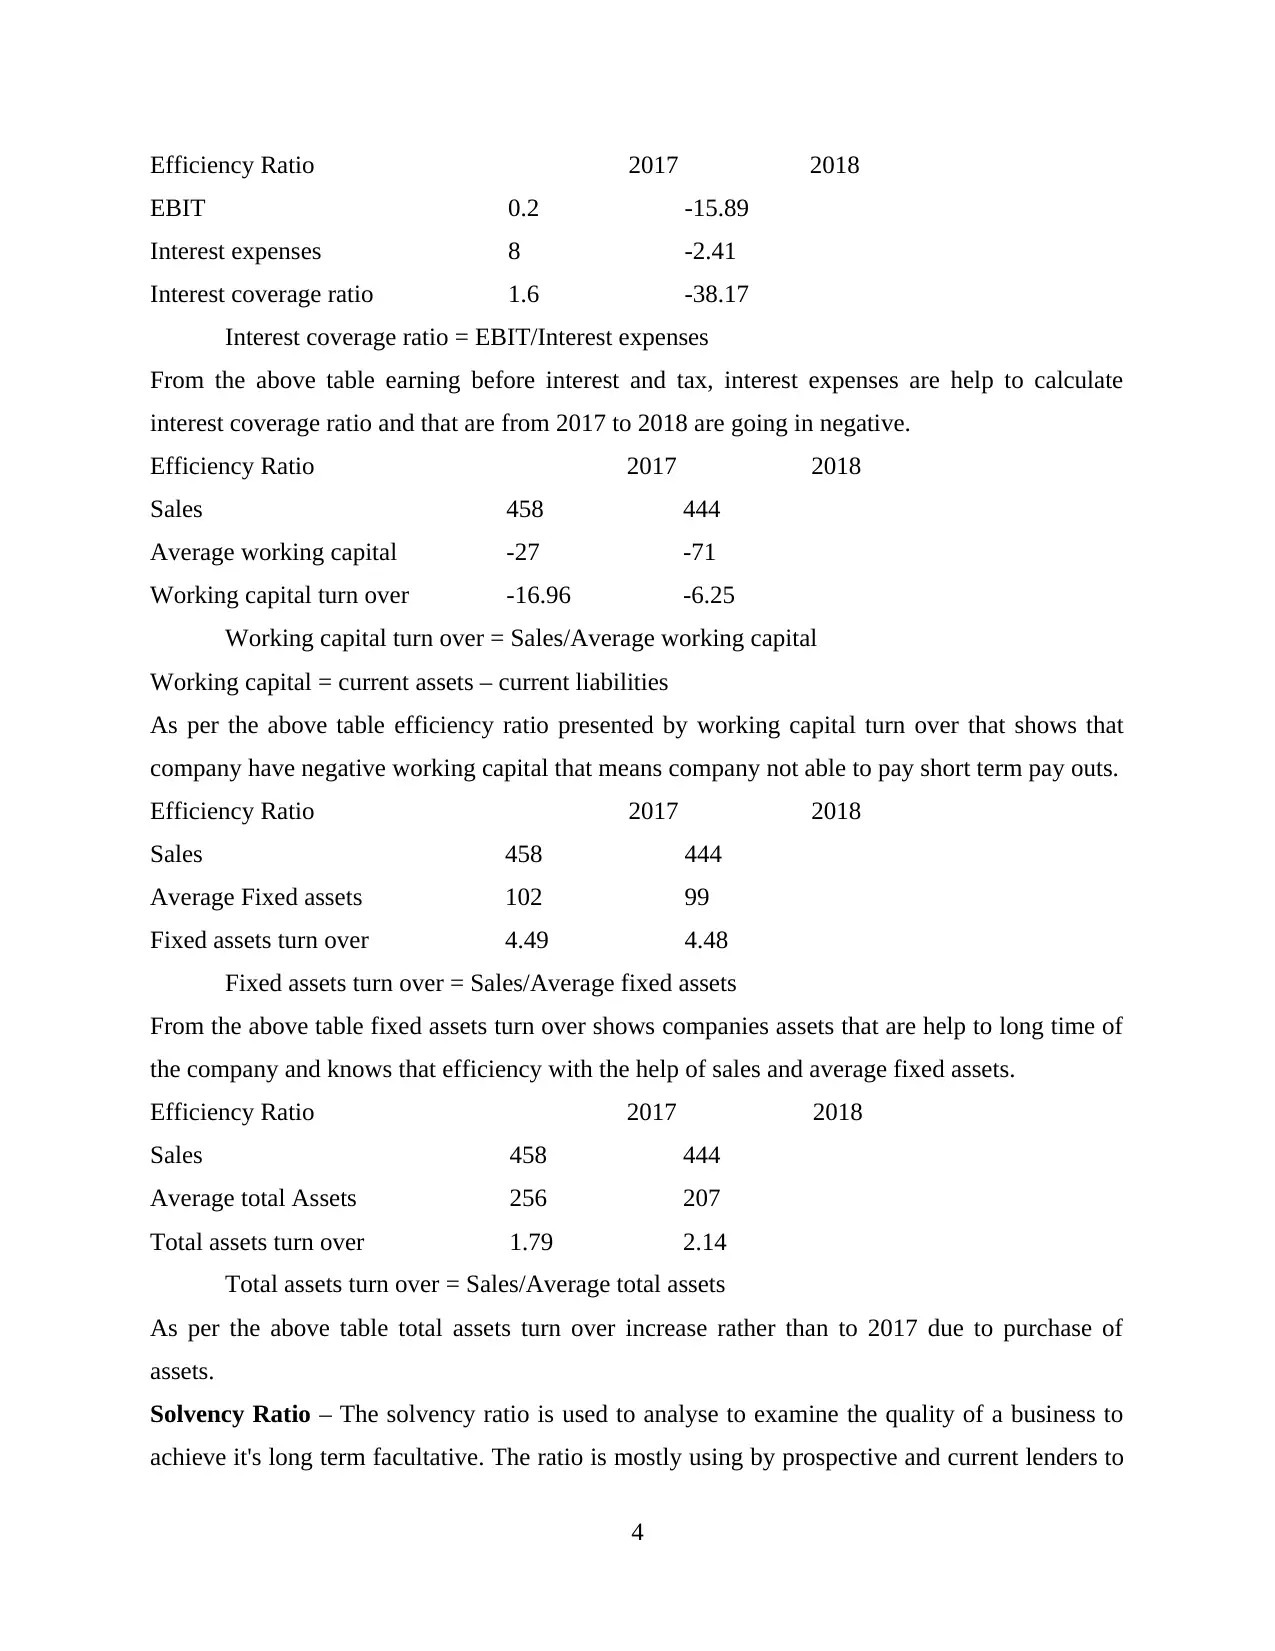
Efficiency Ratio 2017 2018
EBIT 0.2 -15.89
Interest expenses 8 -2.41
Interest coverage ratio 1.6 -38.17
Interest coverage ratio = EBIT/Interest expenses
From the above table earning before interest and tax, interest expenses are help to calculate
interest coverage ratio and that are from 2017 to 2018 are going in negative.
Efficiency Ratio 2017 2018
Sales 458 444
Average working capital -27 -71
Working capital turn over -16.96 -6.25
Working capital turn over = Sales/Average working capital
Working capital = current assets – current liabilities
As per the above table efficiency ratio presented by working capital turn over that shows that
company have negative working capital that means company not able to pay short term pay outs.
Efficiency Ratio 2017 2018
Sales 458 444
Average Fixed assets 102 99
Fixed assets turn over 4.49 4.48
Fixed assets turn over = Sales/Average fixed assets
From the above table fixed assets turn over shows companies assets that are help to long time of
the company and knows that efficiency with the help of sales and average fixed assets.
Efficiency Ratio 2017 2018
Sales 458 444
Average total Assets 256 207
Total assets turn over 1.79 2.14
Total assets turn over = Sales/Average total assets
As per the above table total assets turn over increase rather than to 2017 due to purchase of
assets.
Solvency Ratio – The solvency ratio is used to analyse to examine the quality of a business to
achieve it's long term facultative. The ratio is mostly using by prospective and current lenders to
4
⊘ This is a preview!⊘
Do you want full access?
Subscribe today to unlock all pages.
Trusted by 1+ million students worldwide
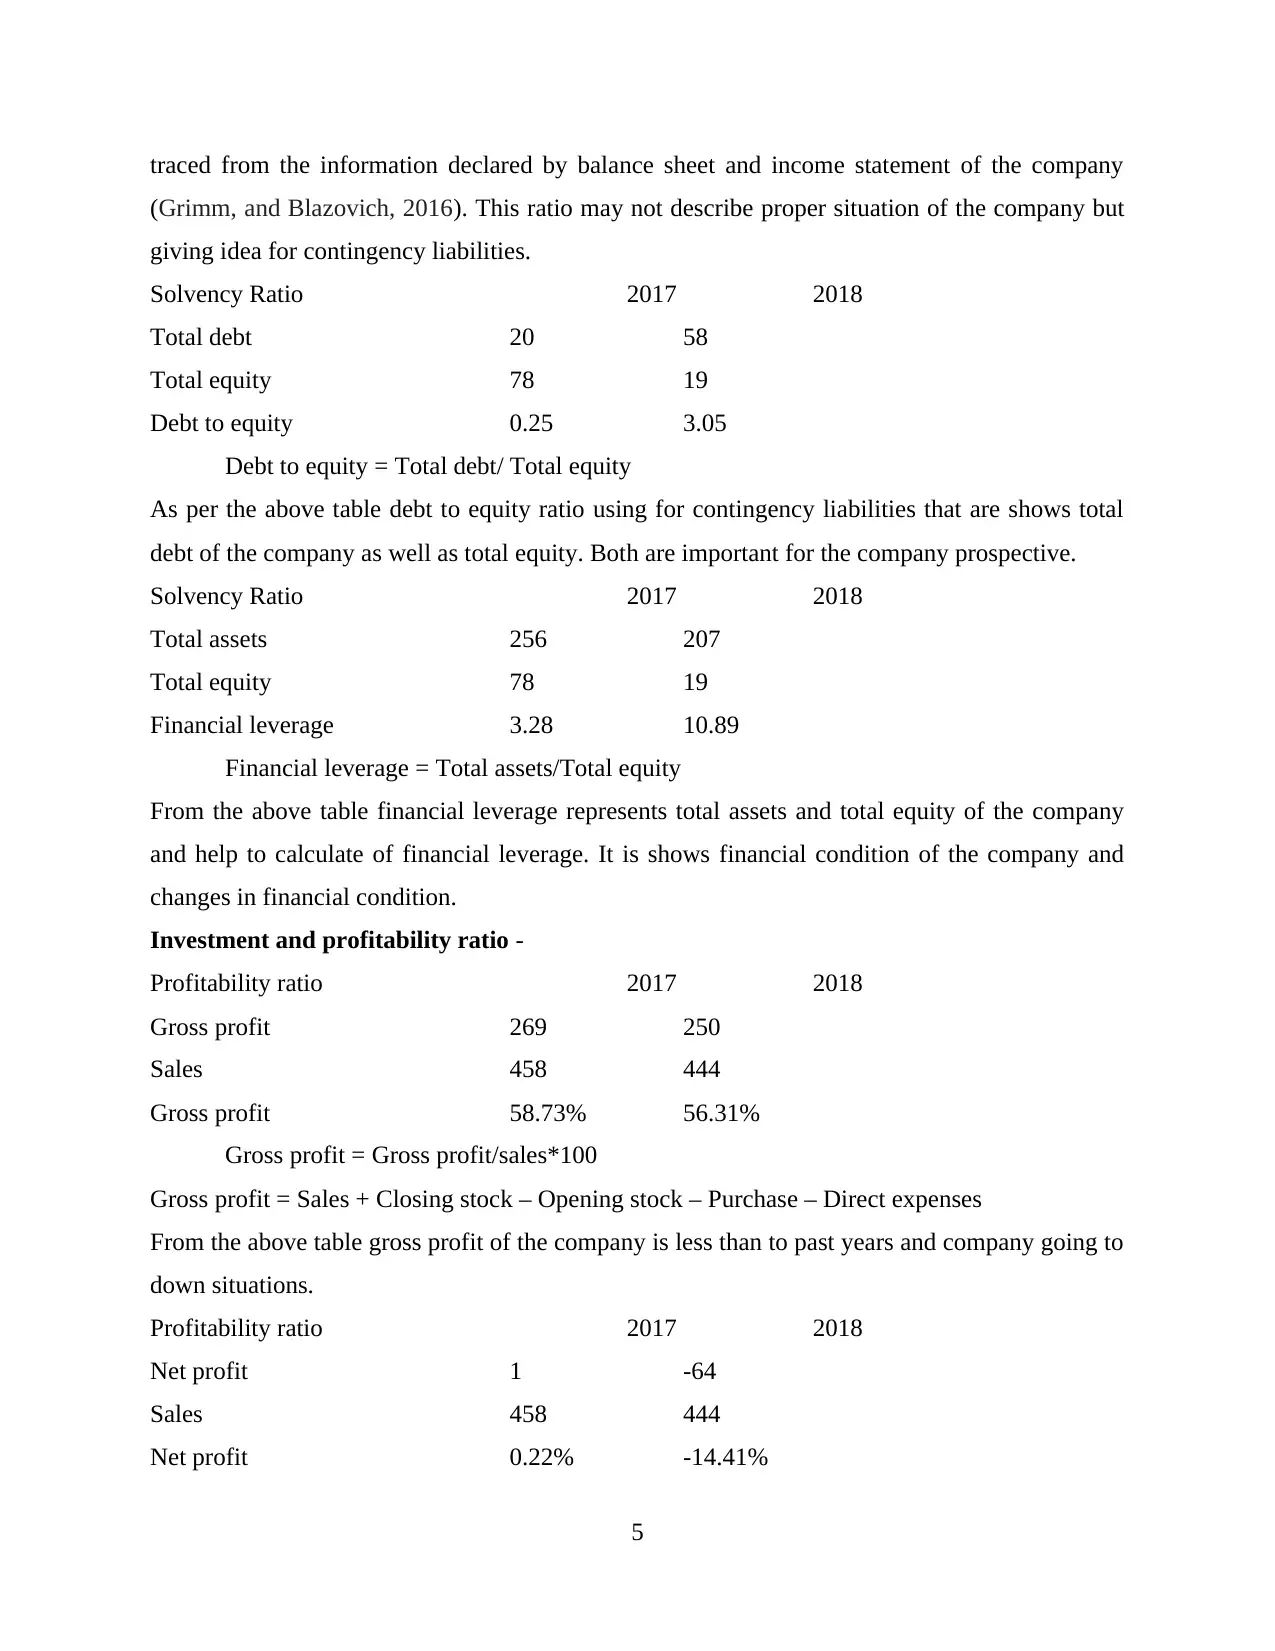
traced from the information declared by balance sheet and income statement of the company
(Grimm, and Blazovich, 2016). This ratio may not describe proper situation of the company but
giving idea for contingency liabilities.
Solvency Ratio 2017 2018
Total debt 20 58
Total equity 78 19
Debt to equity 0.25 3.05
Debt to equity = Total debt/ Total equity
As per the above table debt to equity ratio using for contingency liabilities that are shows total
debt of the company as well as total equity. Both are important for the company prospective.
Solvency Ratio 2017 2018
Total assets 256 207
Total equity 78 19
Financial leverage 3.28 10.89
Financial leverage = Total assets/Total equity
From the above table financial leverage represents total assets and total equity of the company
and help to calculate of financial leverage. It is shows financial condition of the company and
changes in financial condition.
Investment and profitability ratio -
Profitability ratio 2017 2018
Gross profit 269 250
Sales 458 444
Gross profit 58.73% 56.31%
Gross profit = Gross profit/sales*100
Gross profit = Sales + Closing stock – Opening stock – Purchase – Direct expenses
From the above table gross profit of the company is less than to past years and company going to
down situations.
Profitability ratio 2017 2018
Net profit 1 -64
Sales 458 444
Net profit 0.22% -14.41%
5
Paraphrase This Document
Need a fresh take? Get an instant paraphrase of this document with our AI Paraphraser
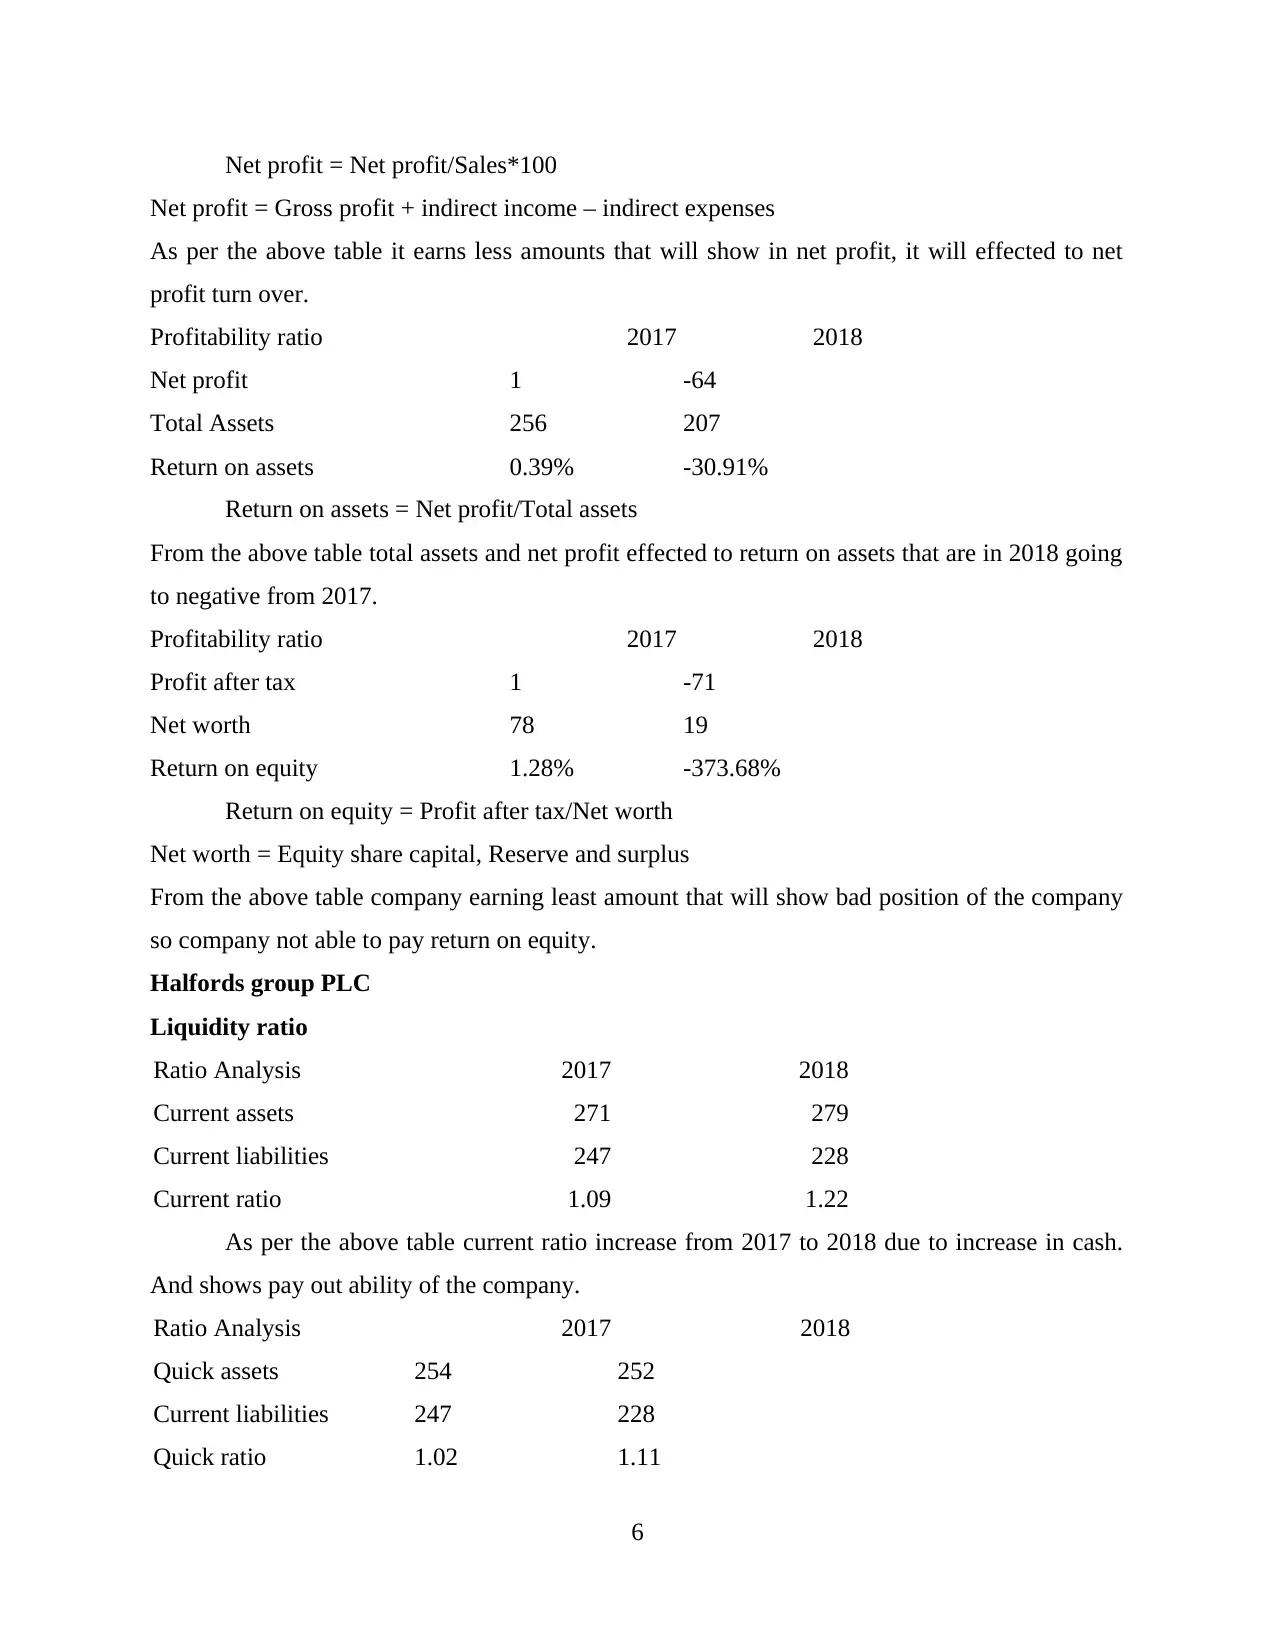
Net profit = Net profit/Sales*100
Net profit = Gross profit + indirect income – indirect expenses
As per the above table it earns less amounts that will show in net profit, it will effected to net
profit turn over.
Profitability ratio 2017 2018
Net profit 1 -64
Total Assets 256 207
Return on assets 0.39% -30.91%
Return on assets = Net profit/Total assets
From the above table total assets and net profit effected to return on assets that are in 2018 going
to negative from 2017.
Profitability ratio 2017 2018
Profit after tax 1 -71
Net worth 78 19
Return on equity 1.28% -373.68%
Return on equity = Profit after tax/Net worth
Net worth = Equity share capital, Reserve and surplus
From the above table company earning least amount that will show bad position of the company
so company not able to pay return on equity.
Halfords group PLC
Liquidity ratio
Ratio Analysis 2017 2018
Current assets 271 279
Current liabilities 247 228
Current ratio 1.09 1.22
As per the above table current ratio increase from 2017 to 2018 due to increase in cash.
And shows pay out ability of the company.
Ratio Analysis 2017 2018
Quick assets 254 252
Current liabilities 247 228
Quick ratio 1.02 1.11
6
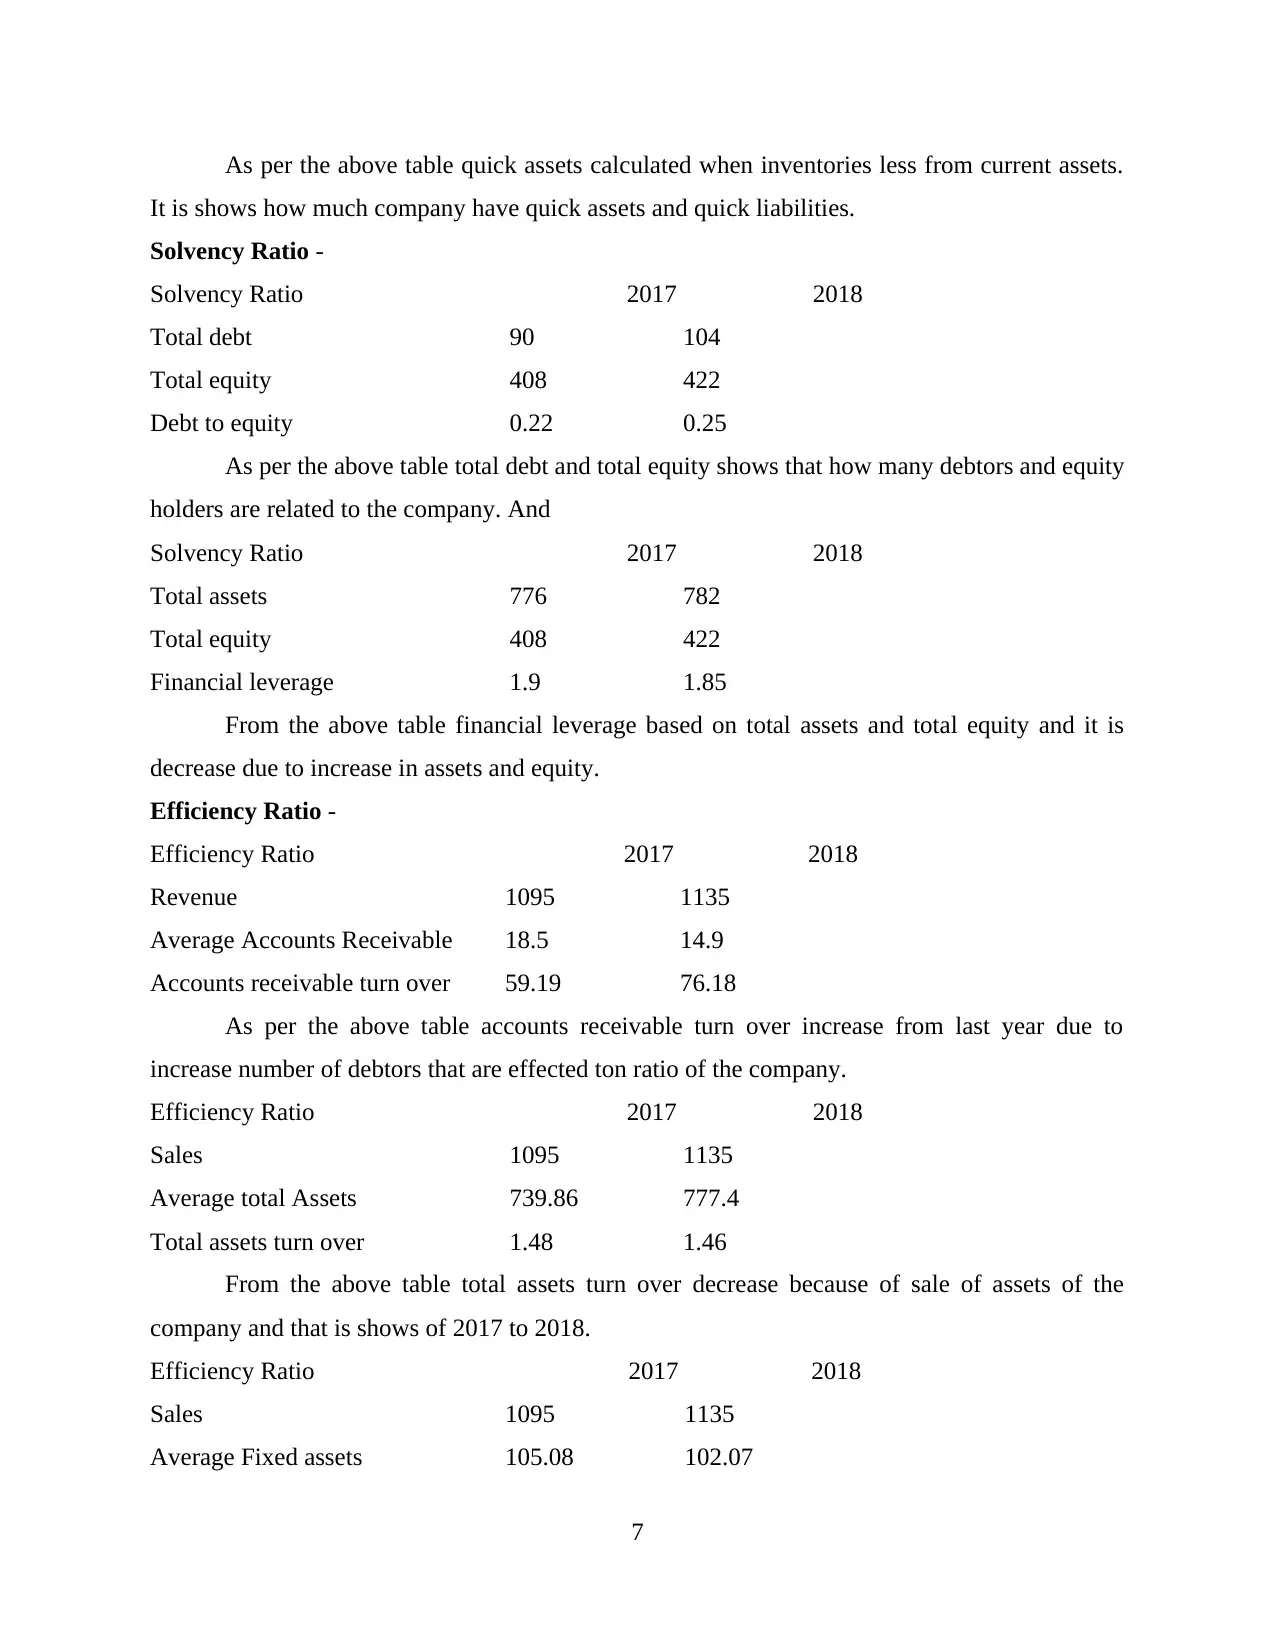
As per the above table quick assets calculated when inventories less from current assets.
It is shows how much company have quick assets and quick liabilities.
Solvency Ratio -
Solvency Ratio 2017 2018
Total debt 90 104
Total equity 408 422
Debt to equity 0.22 0.25
As per the above table total debt and total equity shows that how many debtors and equity
holders are related to the company. And
Solvency Ratio 2017 2018
Total assets 776 782
Total equity 408 422
Financial leverage 1.9 1.85
From the above table financial leverage based on total assets and total equity and it is
decrease due to increase in assets and equity.
Efficiency Ratio -
Efficiency Ratio 2017 2018
Revenue 1095 1135
Average Accounts Receivable 18.5 14.9
Accounts receivable turn over 59.19 76.18
As per the above table accounts receivable turn over increase from last year due to
increase number of debtors that are effected ton ratio of the company.
Efficiency Ratio 2017 2018
Sales 1095 1135
Average total Assets 739.86 777.4
Total assets turn over 1.48 1.46
From the above table total assets turn over decrease because of sale of assets of the
company and that is shows of 2017 to 2018.
Efficiency Ratio 2017 2018
Sales 1095 1135
Average Fixed assets 105.08 102.07
7
⊘ This is a preview!⊘
Do you want full access?
Subscribe today to unlock all pages.
Trusted by 1+ million students worldwide
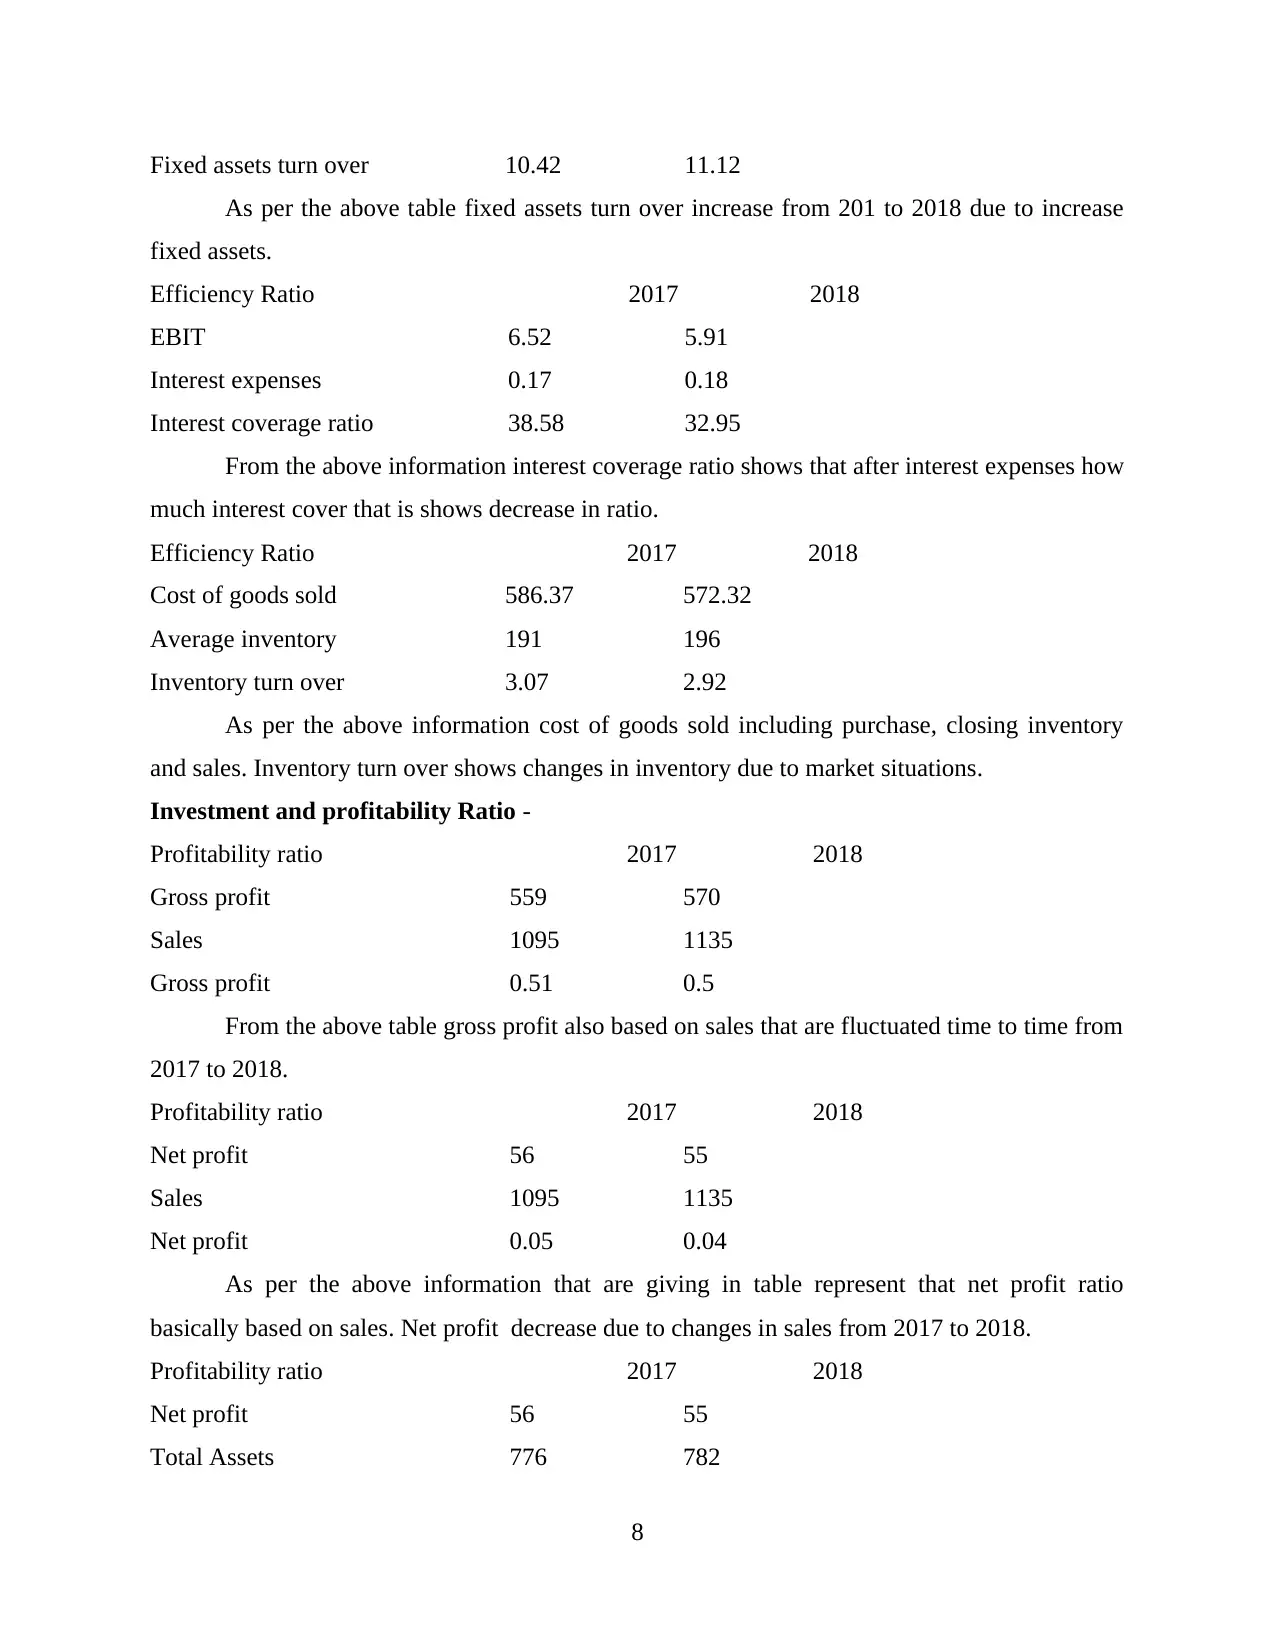
Fixed assets turn over 10.42 11.12
As per the above table fixed assets turn over increase from 201 to 2018 due to increase
fixed assets.
Efficiency Ratio 2017 2018
EBIT 6.52 5.91
Interest expenses 0.17 0.18
Interest coverage ratio 38.58 32.95
From the above information interest coverage ratio shows that after interest expenses how
much interest cover that is shows decrease in ratio.
Efficiency Ratio 2017 2018
Cost of goods sold 586.37 572.32
Average inventory 191 196
Inventory turn over 3.07 2.92
As per the above information cost of goods sold including purchase, closing inventory
and sales. Inventory turn over shows changes in inventory due to market situations.
Investment and profitability Ratio -
Profitability ratio 2017 2018
Gross profit 559 570
Sales 1095 1135
Gross profit 0.51 0.5
From the above table gross profit also based on sales that are fluctuated time to time from
2017 to 2018.
Profitability ratio 2017 2018
Net profit 56 55
Sales 1095 1135
Net profit 0.05 0.04
As per the above information that are giving in table represent that net profit ratio
basically based on sales. Net profit decrease due to changes in sales from 2017 to 2018.
Profitability ratio 2017 2018
Net profit 56 55
Total Assets 776 782
8
Paraphrase This Document
Need a fresh take? Get an instant paraphrase of this document with our AI Paraphraser
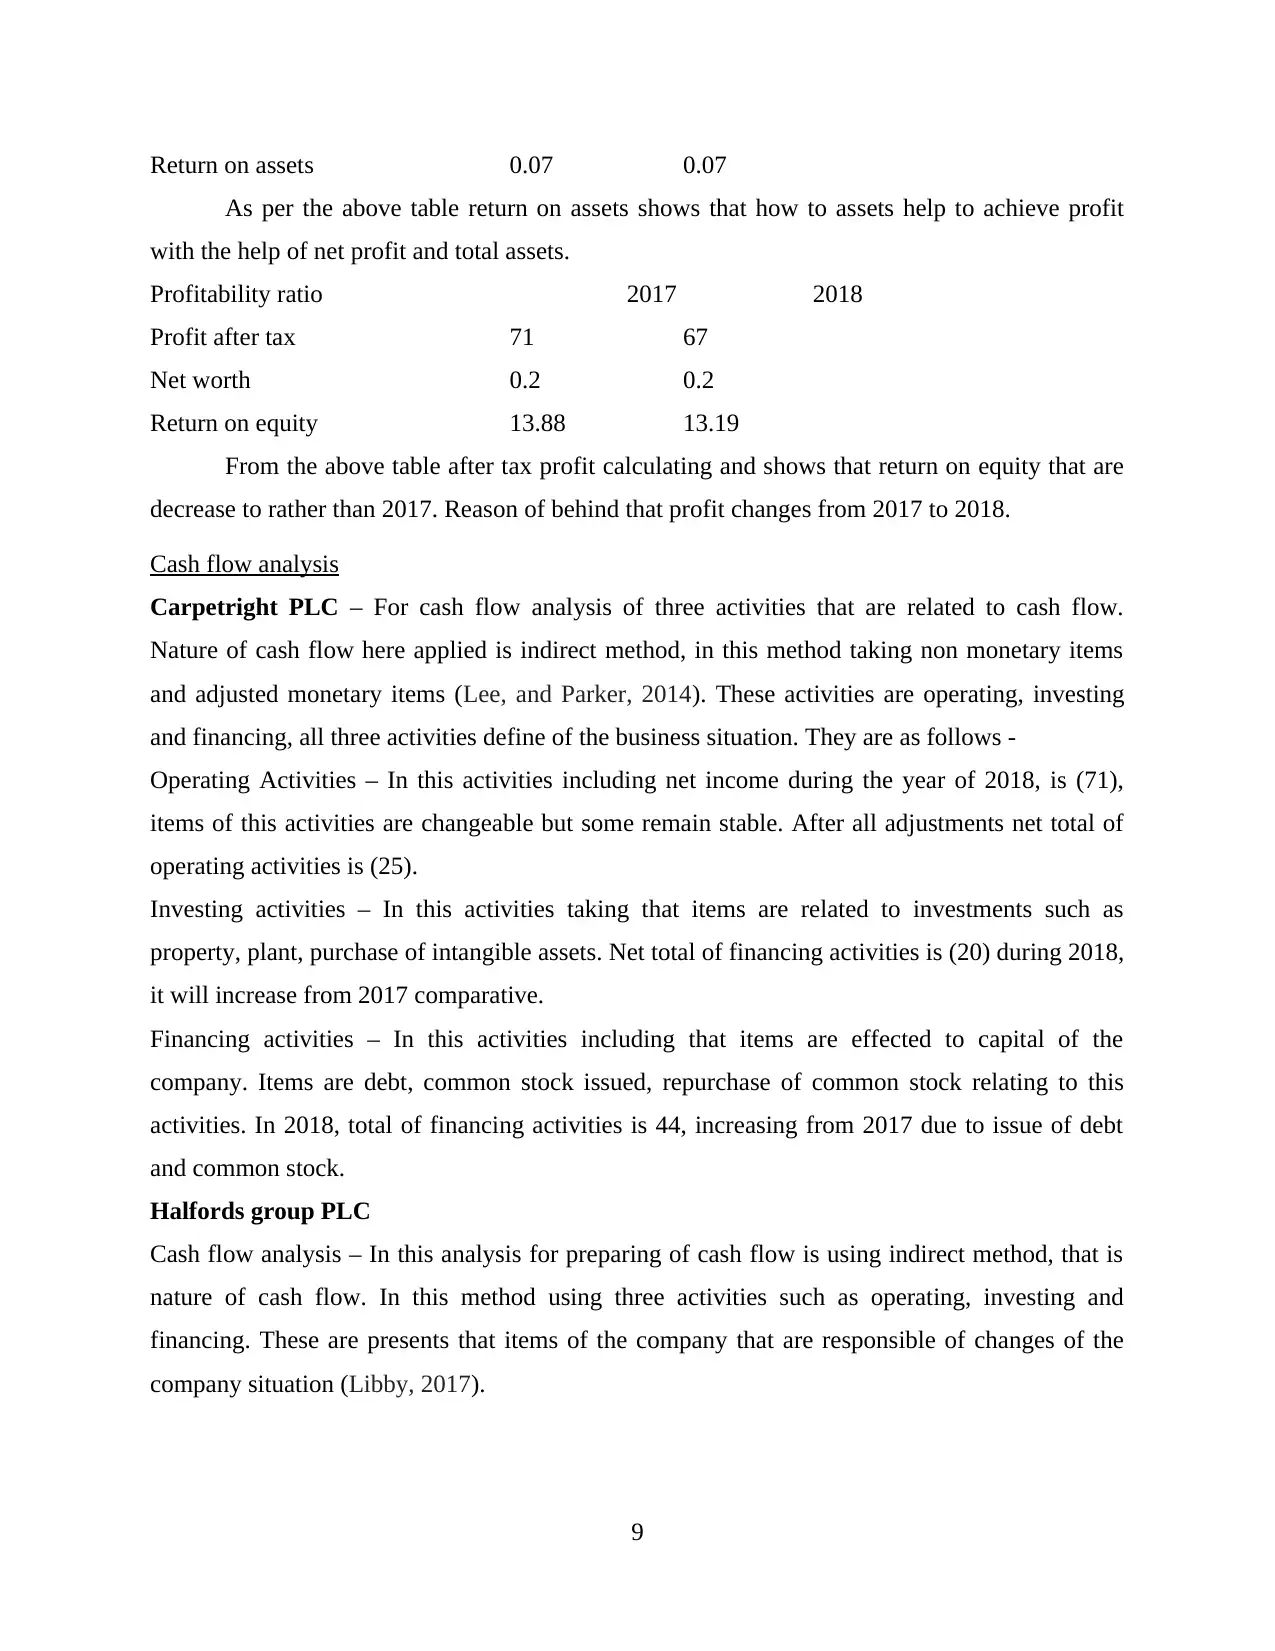
Return on assets 0.07 0.07
As per the above table return on assets shows that how to assets help to achieve profit
with the help of net profit and total assets.
Profitability ratio 2017 2018
Profit after tax 71 67
Net worth 0.2 0.2
Return on equity 13.88 13.19
From the above table after tax profit calculating and shows that return on equity that are
decrease to rather than 2017. Reason of behind that profit changes from 2017 to 2018.
Cash flow analysis
Carpetright PLC – For cash flow analysis of three activities that are related to cash flow.
Nature of cash flow here applied is indirect method, in this method taking non monetary items
and adjusted monetary items (Lee, and Parker, 2014). These activities are operating, investing
and financing, all three activities define of the business situation. They are as follows -
Operating Activities – In this activities including net income during the year of 2018, is (71),
items of this activities are changeable but some remain stable. After all adjustments net total of
operating activities is (25).
Investing activities – In this activities taking that items are related to investments such as
property, plant, purchase of intangible assets. Net total of financing activities is (20) during 2018,
it will increase from 2017 comparative.
Financing activities – In this activities including that items are effected to capital of the
company. Items are debt, common stock issued, repurchase of common stock relating to this
activities. In 2018, total of financing activities is 44, increasing from 2017 due to issue of debt
and common stock.
Halfords group PLC
Cash flow analysis – In this analysis for preparing of cash flow is using indirect method, that is
nature of cash flow. In this method using three activities such as operating, investing and
financing. These are presents that items of the company that are responsible of changes of the
company situation (Libby, 2017).
9
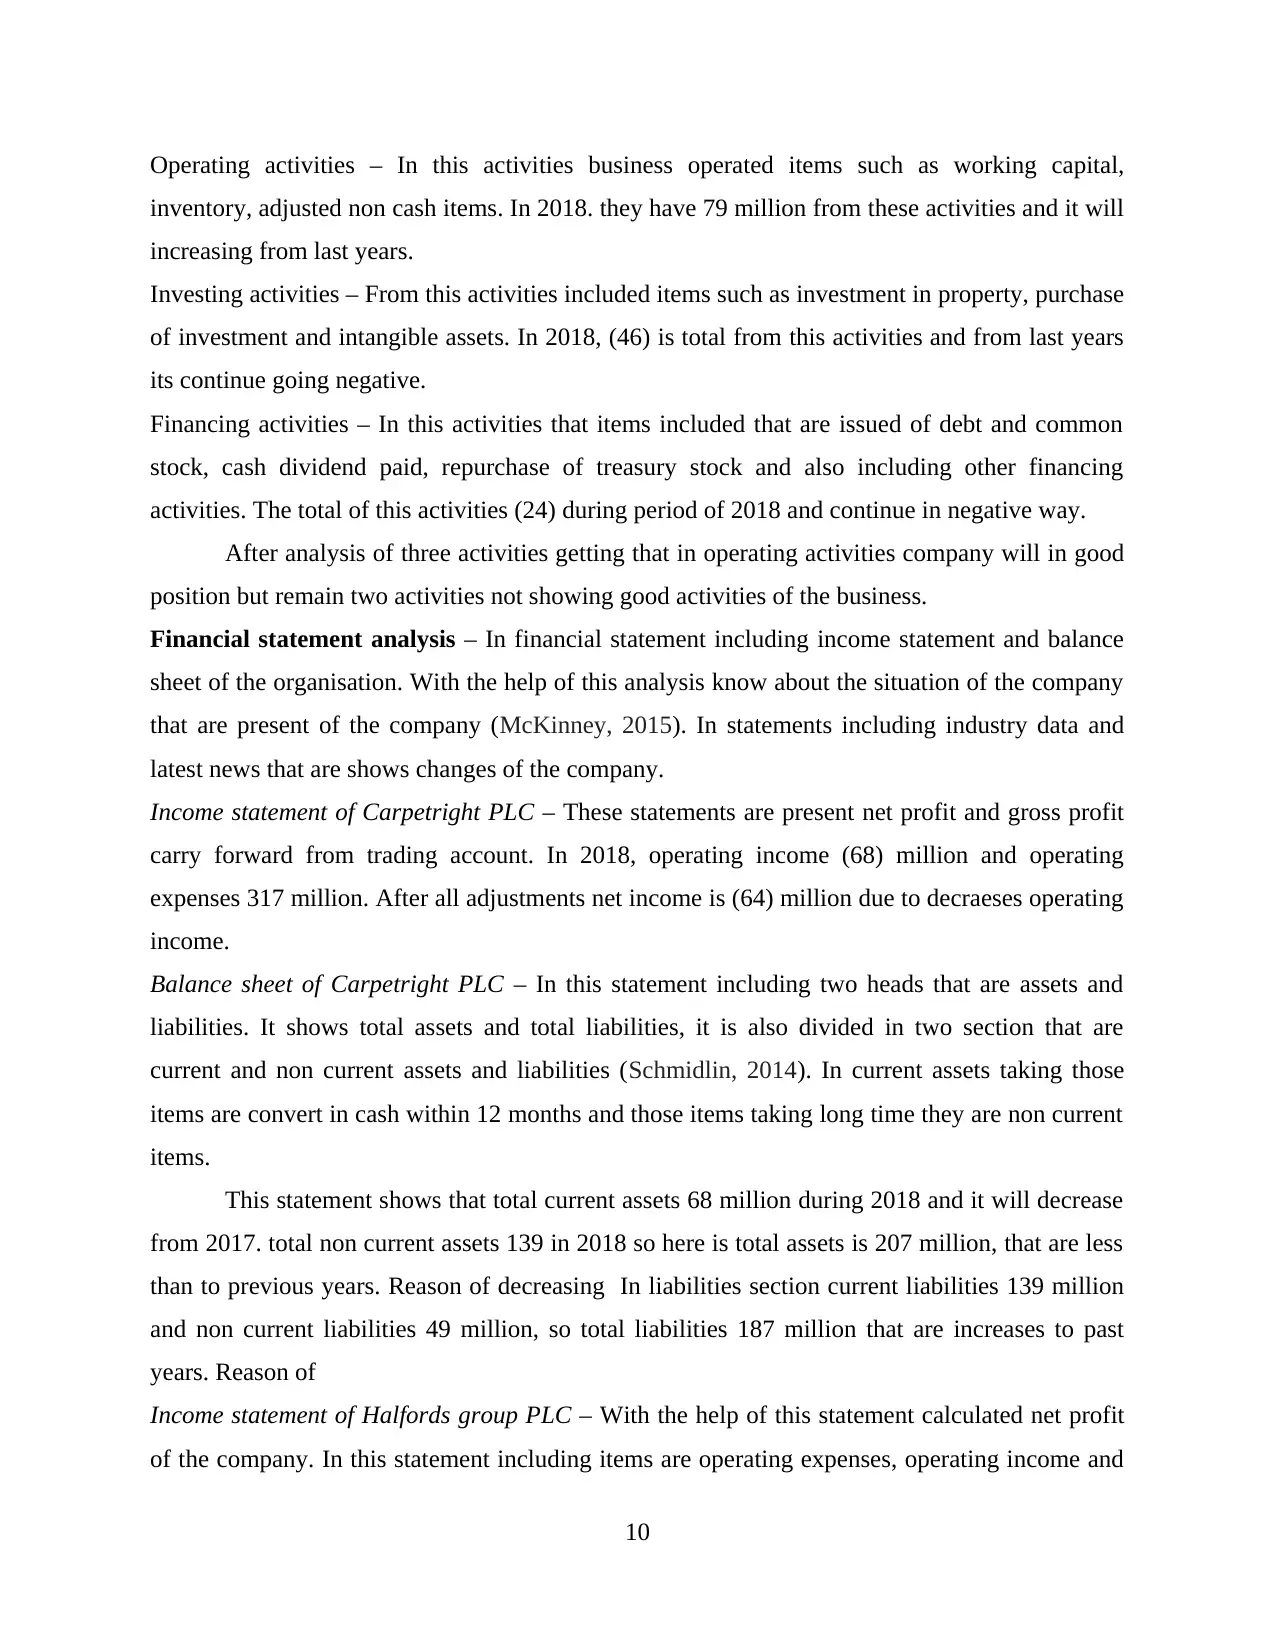
Operating activities – In this activities business operated items such as working capital,
inventory, adjusted non cash items. In 2018. they have 79 million from these activities and it will
increasing from last years.
Investing activities – From this activities included items such as investment in property, purchase
of investment and intangible assets. In 2018, (46) is total from this activities and from last years
its continue going negative.
Financing activities – In this activities that items included that are issued of debt and common
stock, cash dividend paid, repurchase of treasury stock and also including other financing
activities. The total of this activities (24) during period of 2018 and continue in negative way.
After analysis of three activities getting that in operating activities company will in good
position but remain two activities not showing good activities of the business.
Financial statement analysis – In financial statement including income statement and balance
sheet of the organisation. With the help of this analysis know about the situation of the company
that are present of the company (McKinney, 2015). In statements including industry data and
latest news that are shows changes of the company.
Income statement of Carpetright PLC – These statements are present net profit and gross profit
carry forward from trading account. In 2018, operating income (68) million and operating
expenses 317 million. After all adjustments net income is (64) million due to decraeses operating
income.
Balance sheet of Carpetright PLC – In this statement including two heads that are assets and
liabilities. It shows total assets and total liabilities, it is also divided in two section that are
current and non current assets and liabilities (Schmidlin, 2014). In current assets taking those
items are convert in cash within 12 months and those items taking long time they are non current
items.
This statement shows that total current assets 68 million during 2018 and it will decrease
from 2017. total non current assets 139 in 2018 so here is total assets is 207 million, that are less
than to previous years. Reason of decreasing In liabilities section current liabilities 139 million
and non current liabilities 49 million, so total liabilities 187 million that are increases to past
years. Reason of
Income statement of Halfords group PLC – With the help of this statement calculated net profit
of the company. In this statement including items are operating expenses, operating income and
10
⊘ This is a preview!⊘
Do you want full access?
Subscribe today to unlock all pages.
Trusted by 1+ million students worldwide
1 out of 13
Related Documents


Your All-in-One AI-Powered Toolkit for Academic Success.
+13062052269
info@desklib.com
Available 24*7 on WhatsApp / Email
![[object Object]](/_next/static/media/star-bottom.7253800d.svg)
Unlock your academic potential
Copyright © 2020–2026 A2Z Services. All Rights Reserved. Developed and managed by ZUCOL.