Comprehensive Financial Decision Making Report: Roast Ltd. Analysis
VerifiedAdded on 2023/01/17
|17
|4611
|35
Report
AI Summary
This report provides a comprehensive financial analysis of Roast Ltd., an independent coffee house chain operating in the UK. The analysis begins with an industry review of the UK beverage sector, highlighting key players and market trends. The core of the report focuses on the analysis of financial statements, including the statement of profit or loss, statement of financial position (balance sheet), and statement of cash flows for the years 2017 and 2018. Various financial ratios, such as gross profit ratio, net profit ratio, operating profit ratio, current ratio, quick ratio, debt-to-equity ratio, and return on capital employed, are calculated and interpreted to assess the company's performance, profitability, and financial stability. Furthermore, the report explores investment appraisal techniques and discusses potential sources of funding for Roast Ltd., offering insights into its financial decision-making processes and strategic planning. The analysis reveals the company's growth and profitability trends, providing valuable information for stakeholders and decision-makers.
Financial Decision Making
Paraphrase This Document
Need a fresh take? Get an instant paraphrase of this document with our AI Paraphraser
Table of Contents
INTRODUCTION...........................................................................................................................1
PART 1............................................................................................................................................1
Industry Review..........................................................................................................................1
PART 2............................................................................................................................................2
2.1 Statement of profit or loss.....................................................................................................2
2.2 Statement of financial position..............................................................................................4
2.3 Statement of cash Flows........................................................................................................6
PART 3............................................................................................................................................9
3.1 Investment appraisal..............................................................................................................9
3.2 Sources of fund...................................................................................................................10
CONCLUSION..............................................................................................................................11
REFERENCES..............................................................................................................................12

⊘ This is a preview!⊘
Do you want full access?
Subscribe today to unlock all pages.
Trusted by 1+ million students worldwide
INTRODUCTION
Financial decision making includes the process which is related to the formulation of
future strategies that help the organisation in attainment of sustainable growth opportunities. It is
the duty of the management of each organisation to formulate the strategies that are optimum in
nature for the attainment of development in business operations. After the formulation of
effective decisions, attention is provided by the management towards the analysis of financial
situation and position. The different documents upon which focus is provided in this process
includes balance sheet, P&L account and cash flow statements. There effective analysis help to
ascertain the actual status of an organisation along with their presence in market. This is report
is based upon Roast Ltd. It is an independent coffee house chain and having its operations in UK.
This organisation is founded in year 2008. The main aim of this report is about consideration of
different financial documents to build effective decision making (Bond, Edmans and Goldstein,
2012).
This report covers various topics such as industry review, analysis of financial statements
along with their attached balance sheet, cash flow and profit and loss account. Also, analysis is
done in respect to the investment appraisal techniques along sources of funds.
PART 1
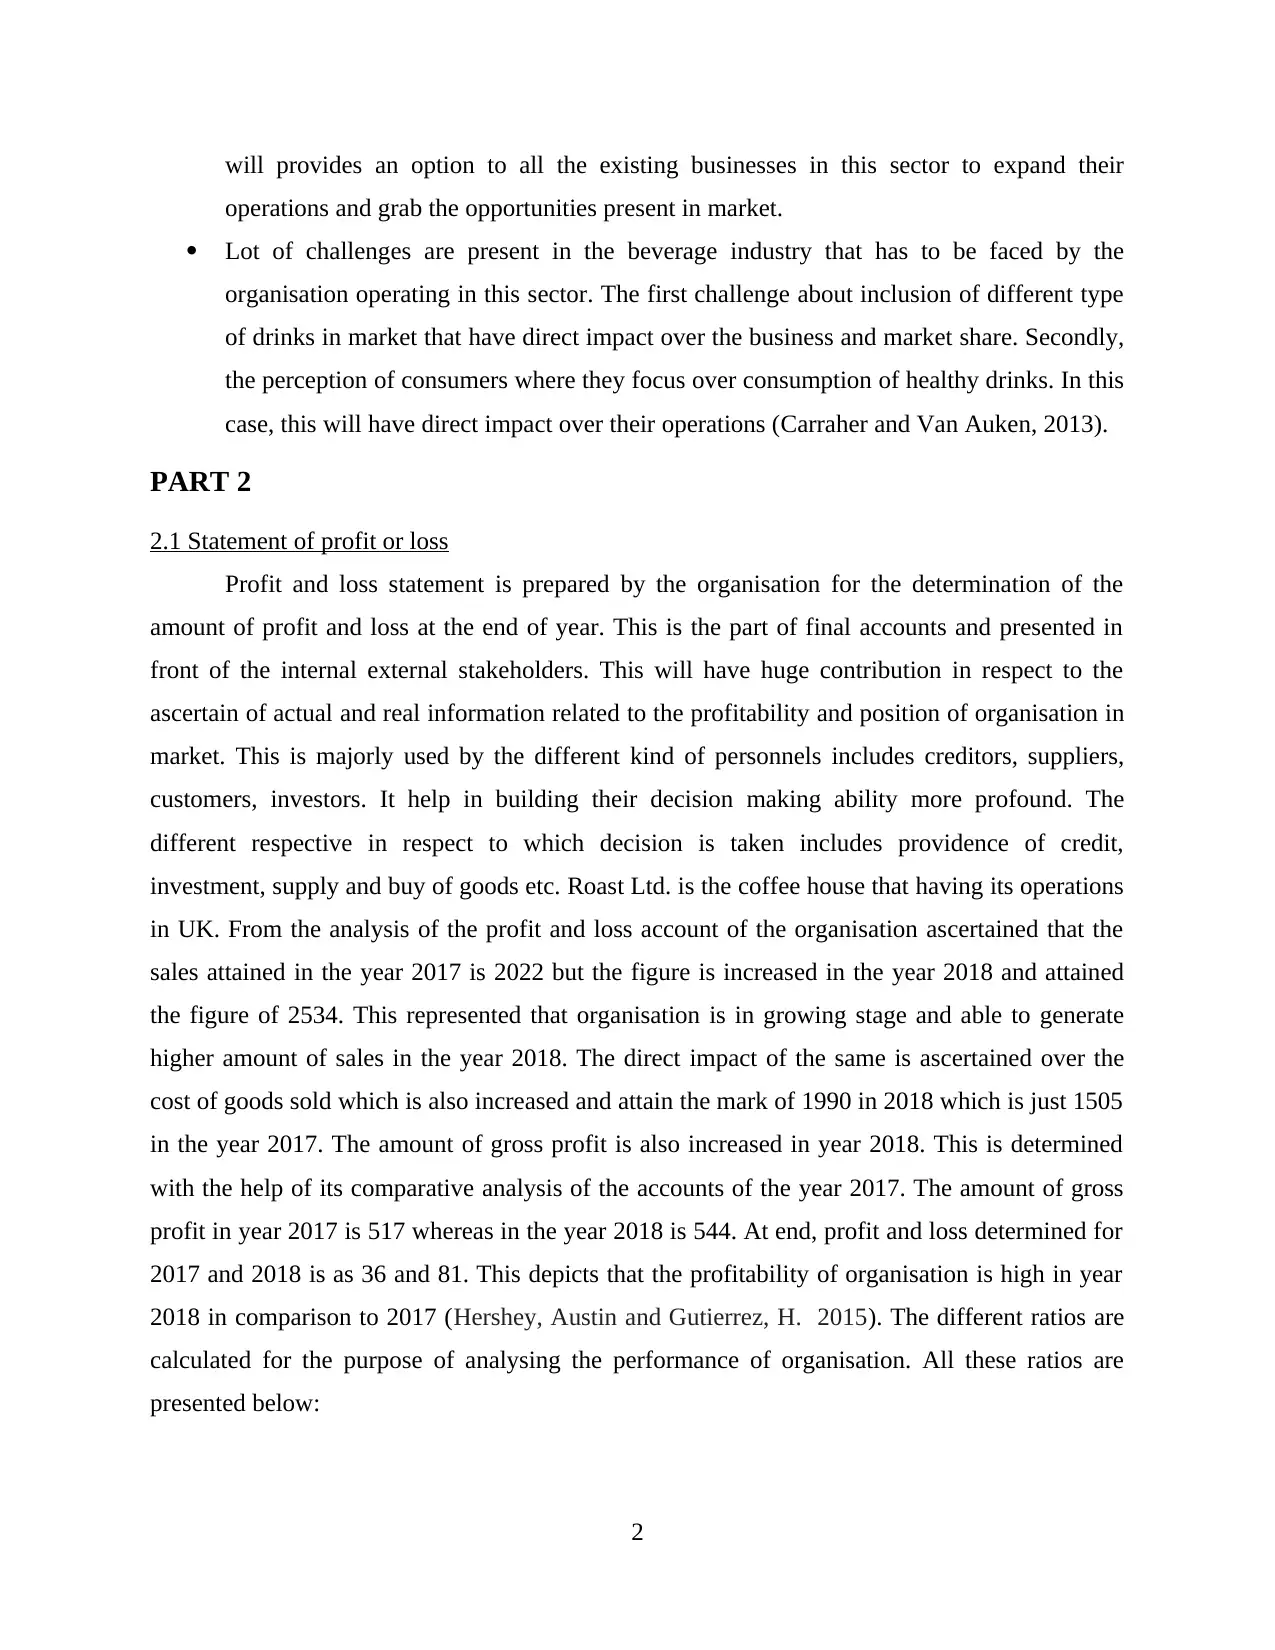
Industry Review
The beverage industry of UK is very big in nature and having significant contribution in
the economy of UK. The different aspects along with information that contributes in the
determination of industry situation are presented below in different points:
The overall contribution of this industry in the GDP of UK is around 3.7 billion pound in
the year 2017.
In the year 2018 noticed that the overall development in beverage industry is around
7.9%.
The main organisations that have significant operations in this industry includes Costa
Coffee, Starbucks, Cafe Nero, Cafe2U, Soho Coffee, AMT Coffee, Coffee republic etc
(Major players in coffee house industry of UK. 2019).
The best opportunity present in this industry is about expansion of business over such
locations where still have no operations are established related to coffee business. This
1
Financial decision making includes the process which is related to the formulation of
future strategies that help the organisation in attainment of sustainable growth opportunities. It is
the duty of the management of each organisation to formulate the strategies that are optimum in
nature for the attainment of development in business operations. After the formulation of
effective decisions, attention is provided by the management towards the analysis of financial
situation and position. The different documents upon which focus is provided in this process
includes balance sheet, P&L account and cash flow statements. There effective analysis help to
ascertain the actual status of an organisation along with their presence in market. This is report
is based upon Roast Ltd. It is an independent coffee house chain and having its operations in UK.
This organisation is founded in year 2008. The main aim of this report is about consideration of
different financial documents to build effective decision making (Bond, Edmans and Goldstein,
2012).
This report covers various topics such as industry review, analysis of financial statements
along with their attached balance sheet, cash flow and profit and loss account. Also, analysis is
done in respect to the investment appraisal techniques along sources of funds.
PART 1
Industry Review
The beverage industry of UK is very big in nature and having significant contribution in
the economy of UK. The different aspects along with information that contributes in the
determination of industry situation are presented below in different points:
The overall contribution of this industry in the GDP of UK is around 3.7 billion pound in
the year 2017.
In the year 2018 noticed that the overall development in beverage industry is around
7.9%.
The main organisations that have significant operations in this industry includes Costa
Coffee, Starbucks, Cafe Nero, Cafe2U, Soho Coffee, AMT Coffee, Coffee republic etc
(Major players in coffee house industry of UK. 2019).
The best opportunity present in this industry is about expansion of business over such
locations where still have no operations are established related to coffee business. This
1
Paraphrase This Document
Need a fresh take? Get an instant paraphrase of this document with our AI Paraphraser
will provides an option to all the existing businesses in this sector to expand their
operations and grab the opportunities present in market.
Lot of challenges are present in the beverage industry that has to be faced by the
organisation operating in this sector. The first challenge about inclusion of different type
of drinks in market that have direct impact over the business and market share. Secondly,
the perception of consumers where they focus over consumption of healthy drinks. In this
case, this will have direct impact over their operations (Carraher and Van Auken, 2013).
PART 2
2.1 Statement of profit or loss
Profit and loss statement is prepared by the organisation for the determination of the
amount of profit and loss at the end of year. This is the part of final accounts and presented in
front of the internal external stakeholders. This will have huge contribution in respect to the
ascertain of actual and real information related to the profitability and position of organisation in
market. This is majorly used by the different kind of personnels includes creditors, suppliers,
customers, investors. It help in building their decision making ability more profound. The
different respective in respect to which decision is taken includes providence of credit,
investment, supply and buy of goods etc. Roast Ltd. is the coffee house that having its operations
in UK. From the analysis of the profit and loss account of the organisation ascertained that the
sales attained in the year 2017 is 2022 but the figure is increased in the year 2018 and attained
the figure of 2534. This represented that organisation is in growing stage and able to generate
higher amount of sales in the year 2018. The direct impact of the same is ascertained over the
cost of goods sold which is also increased and attain the mark of 1990 in 2018 which is just 1505
in the year 2017. The amount of gross profit is also increased in year 2018. This is determined
with the help of its comparative analysis of the accounts of the year 2017. The amount of gross
profit in year 2017 is 517 whereas in the year 2018 is 544. At end, profit and loss determined for
2017 and 2018 is as 36 and 81. This depicts that the profitability of organisation is high in year
2018 in comparison to 2017 (Hershey, Austin and Gutierrez, H. 2015). The different ratios are
calculated for the purpose of analysing the performance of organisation. All these ratios are
presented below:
2
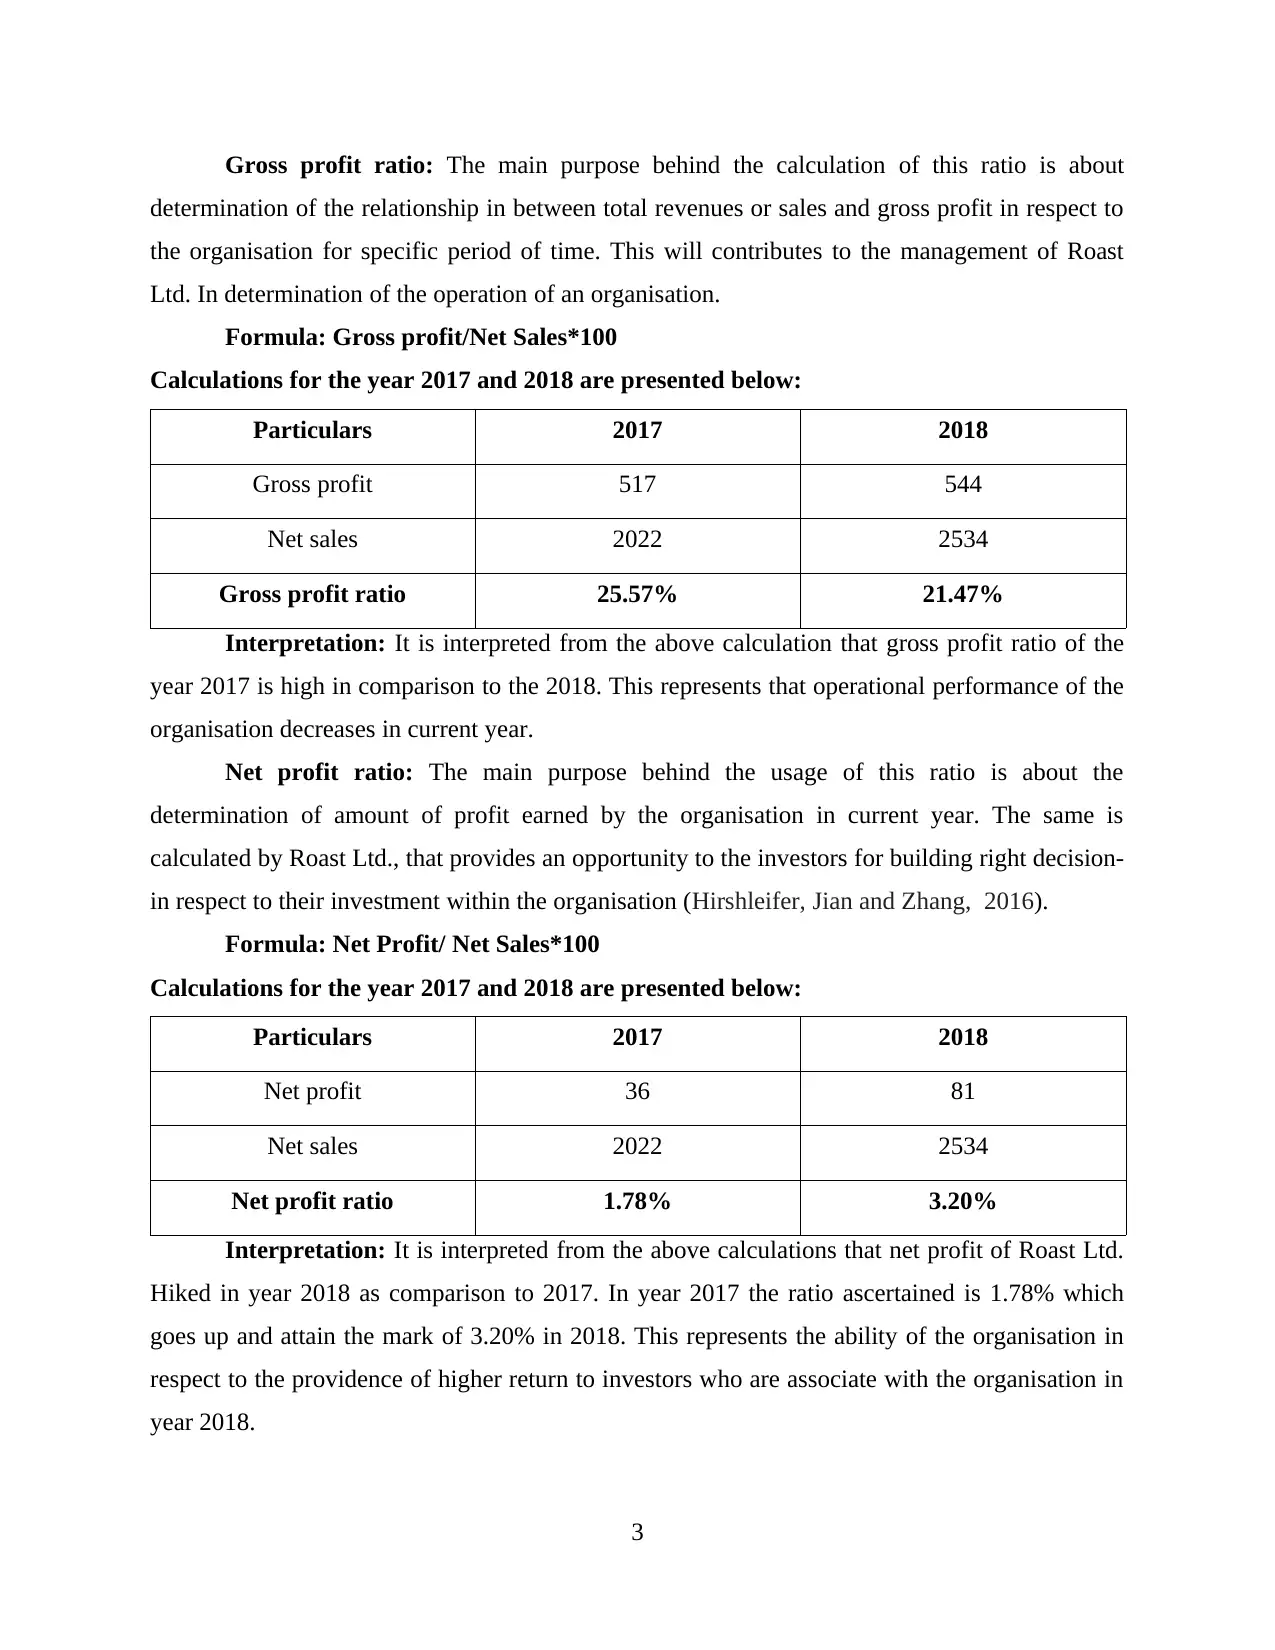
Gross profit ratio: The main purpose behind the calculation of this ratio is about
determination of the relationship in between total revenues or sales and gross profit in respect to
the organisation for specific period of time. This will contributes to the management of Roast
Ltd. In determination of the operation of an organisation.
Formula: Gross profit/Net Sales*100
Calculations for the year 2017 and 2018 are presented below:
Particulars 2017 2018
Gross profit 517 544
Net sales 2022 2534
Gross profit ratio 25.57% 21.47%
Interpretation: It is interpreted from the above calculation that gross profit ratio of the
year 2017 is high in comparison to the 2018. This represents that operational performance of the
organisation decreases in current year.
Net profit ratio: The main purpose behind the usage of this ratio is about the
determination of amount of profit earned by the organisation in current year. The same is
calculated by Roast Ltd., that provides an opportunity to the investors for building right decision-
in respect to their investment within the organisation (Hirshleifer, Jian and Zhang, 2016).
Formula: Net Profit/ Net Sales*100
Calculations for the year 2017 and 2018 are presented below:
Particulars 2017 2018
Net profit 36 81
Net sales 2022 2534
Net profit ratio 1.78% 3.20%
Interpretation: It is interpreted from the above calculations that net profit of Roast Ltd.
Hiked in year 2018 as comparison to 2017. In year 2017 the ratio ascertained is 1.78% which
goes up and attain the mark of 3.20% in 2018. This represents the ability of the organisation in
respect to the providence of higher return to investors who are associate with the organisation in
year 2018.
3
⊘ This is a preview!⊘
Do you want full access?
Subscribe today to unlock all pages.
Trusted by 1+ million students worldwide
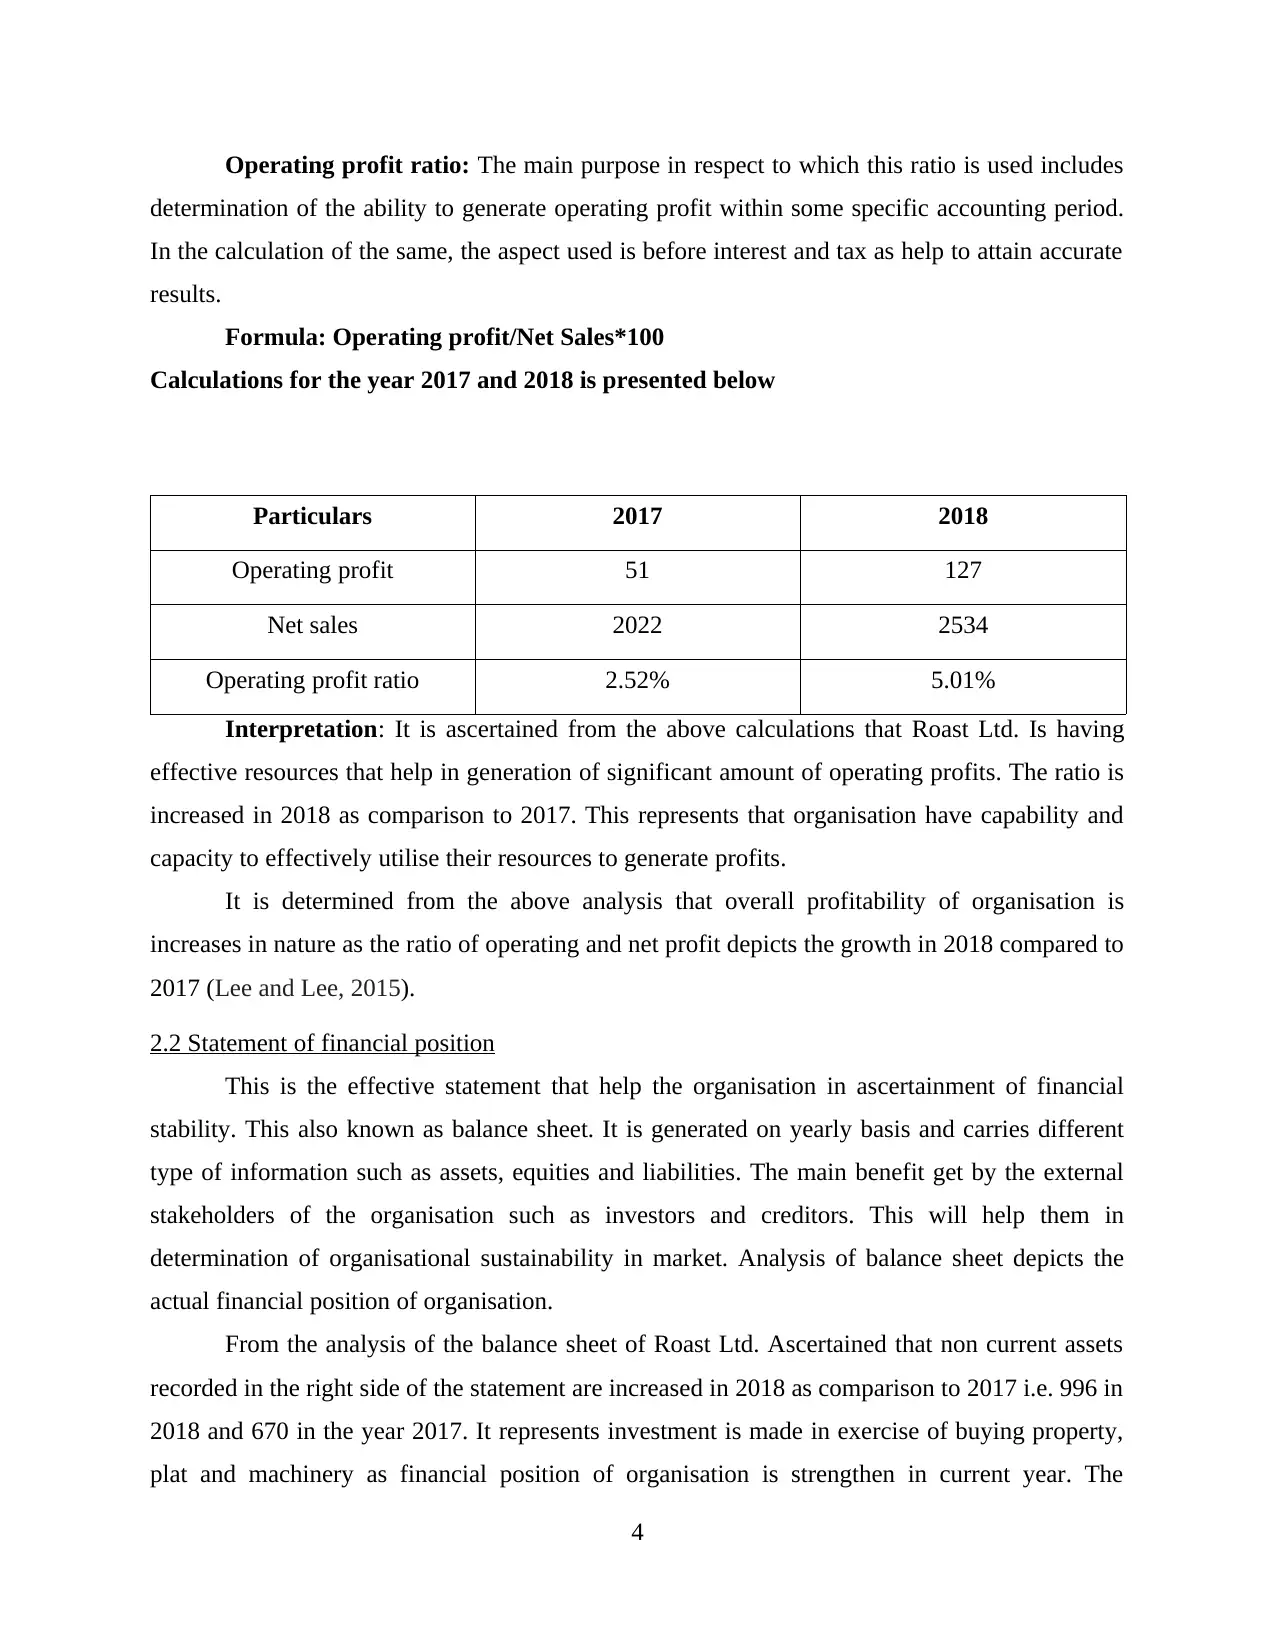
Operating profit ratio: The main purpose in respect to which this ratio is used includes
determination of the ability to generate operating profit within some specific accounting period.
In the calculation of the same, the aspect used is before interest and tax as help to attain accurate
results.
Formula: Operating profit/Net Sales*100
Calculations for the year 2017 and 2018 is presented below
Particulars 2017 2018
Operating profit 51 127
Net sales 2022 2534
Operating profit ratio 2.52% 5.01%
Interpretation: It is ascertained from the above calculations that Roast Ltd. Is having
effective resources that help in generation of significant amount of operating profits. The ratio is
increased in 2018 as comparison to 2017. This represents that organisation have capability and
capacity to effectively utilise their resources to generate profits.
It is determined from the above analysis that overall profitability of organisation is
increases in nature as the ratio of operating and net profit depicts the growth in 2018 compared to
2017 (Lee and Lee, 2015).
2.2 Statement of financial position
This is the effective statement that help the organisation in ascertainment of financial
stability. This also known as balance sheet. It is generated on yearly basis and carries different
type of information such as assets, equities and liabilities. The main benefit get by the external
stakeholders of the organisation such as investors and creditors. This will help them in
determination of organisational sustainability in market. Analysis of balance sheet depicts the
actual financial position of organisation.
From the analysis of the balance sheet of Roast Ltd. Ascertained that non current assets
recorded in the right side of the statement are increased in 2018 as comparison to 2017 i.e. 996 in
2018 and 670 in the year 2017. It represents investment is made in exercise of buying property,
plat and machinery as financial position of organisation is strengthen in current year. The
4
Paraphrase This Document
Need a fresh take? Get an instant paraphrase of this document with our AI Paraphraser
heading of current assets also shows the increment in year 2018 as compared to 2017 i.e. 299
from 120. The increase also visible in trade and receivables of Roast Ltd. as in year 2017 noticed
the figure as 93 and in 2018 attained the mark of 148. The figure of cash and cash equivalent is
same in year 2017 and 2018 i.e. 134. The total of right side in 2018 depicts that increment has
done as compared to 2017 (Lu, Won and Cheng, 2016).
While analysis is done in respect to the left side, share capital for 2018 and 2017 are
same. The difference is visible in the figure of retained earnings which are increase in year 2018
up to the limit of 660 from 579 in 2017. Increase in long term borrowing within the non current
liabilities that depicts the loan is taken by the organisation from the external parties. The current
liabilities of the organisation is also increased and attained the mark of 583 in 2018 which was
238 in 2017. The different ratios calculated for the purpose of analysing performance of the
organisation are presented below:
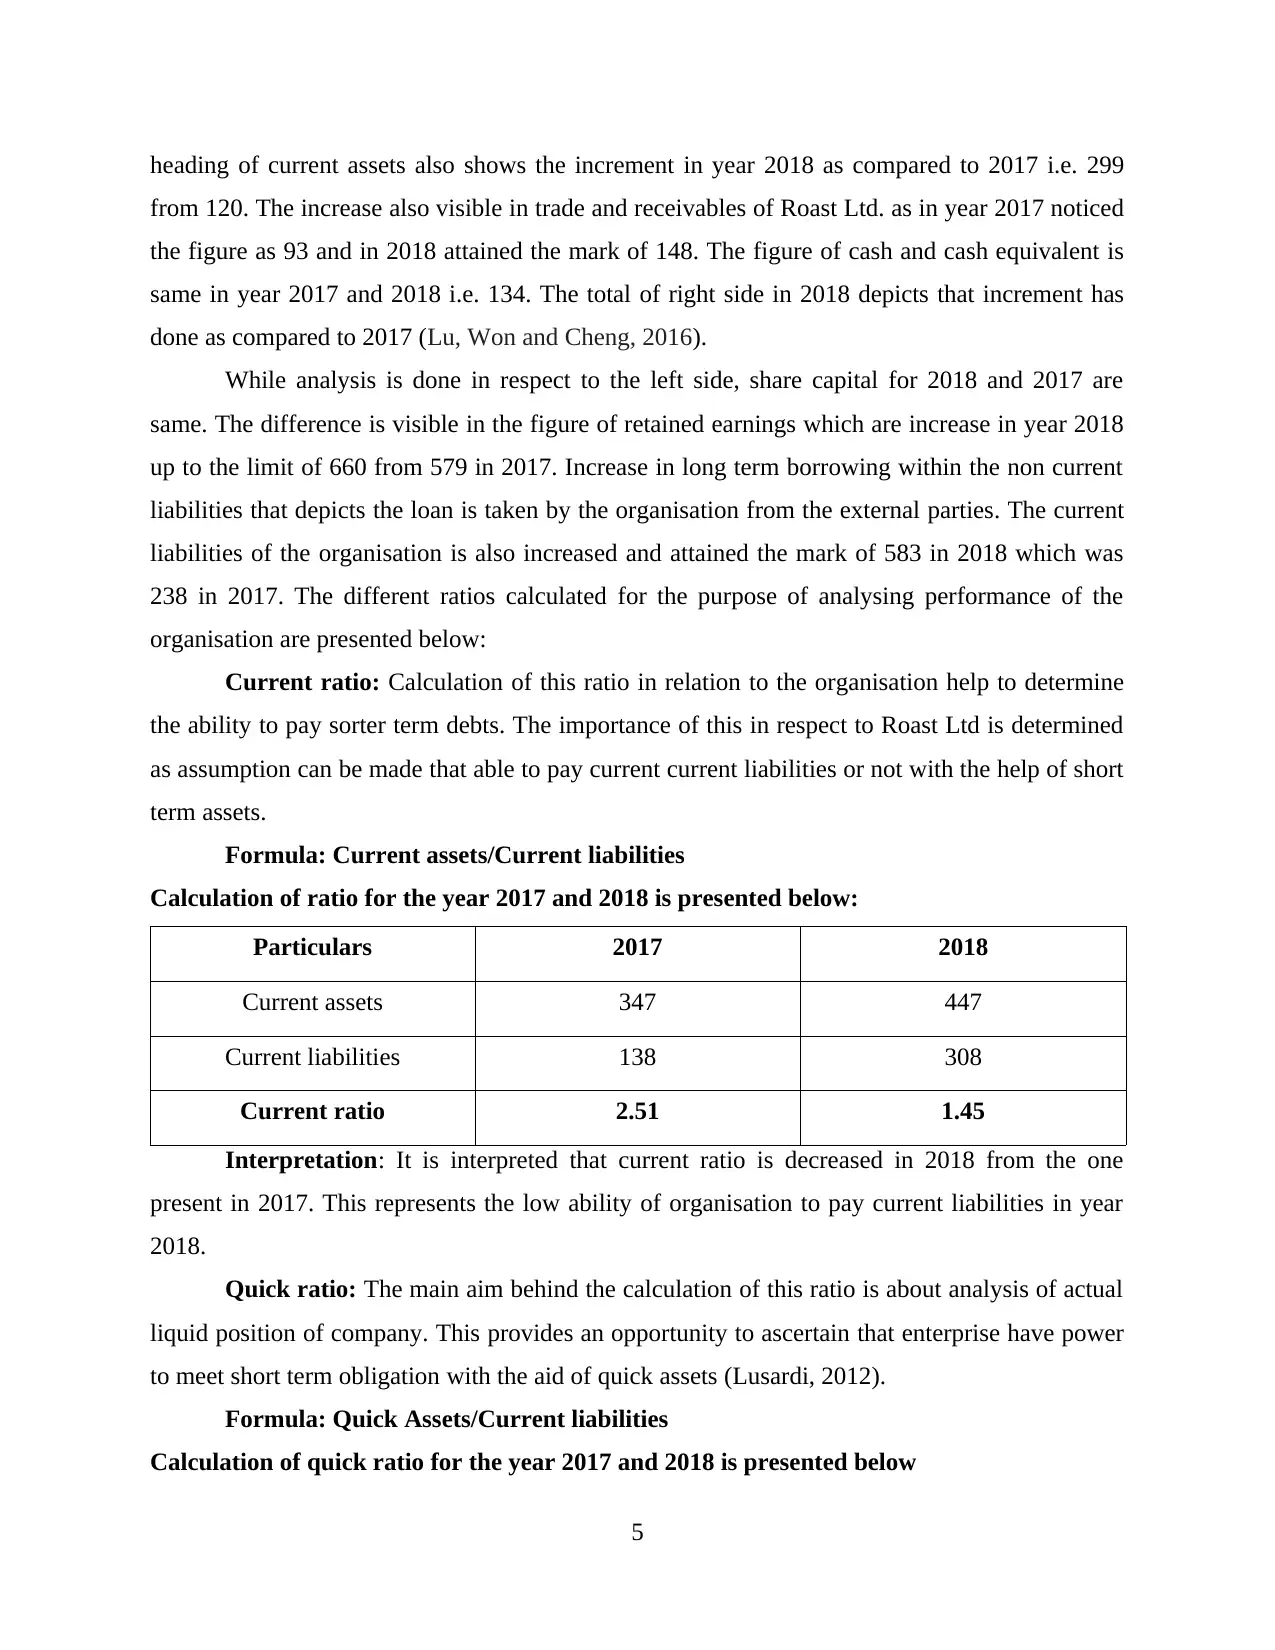
Current ratio: Calculation of this ratio in relation to the organisation help to determine
the ability to pay sorter term debts. The importance of this in respect to Roast Ltd is determined
as assumption can be made that able to pay current current liabilities or not with the help of short
term assets.
Formula: Current assets/Current liabilities
Calculation of ratio for the year 2017 and 2018 is presented below:
Particulars 2017 2018
Current assets 347 447
Current liabilities 138 308
Current ratio 2.51 1.45
Interpretation: It is interpreted that current ratio is decreased in 2018 from the one
present in 2017. This represents the low ability of organisation to pay current liabilities in year
2018.
Quick ratio: The main aim behind the calculation of this ratio is about analysis of actual
liquid position of company. This provides an opportunity to ascertain that enterprise have power
to meet short term obligation with the aid of quick assets (Lusardi, 2012).
Formula: Quick Assets/Current liabilities
Calculation of quick ratio for the year 2017 and 2018 is presented below
5
from 120. The increase also visible in trade and receivables of Roast Ltd. as in year 2017 noticed
the figure as 93 and in 2018 attained the mark of 148. The figure of cash and cash equivalent is
same in year 2017 and 2018 i.e. 134. The total of right side in 2018 depicts that increment has
done as compared to 2017 (Lu, Won and Cheng, 2016).
While analysis is done in respect to the left side, share capital for 2018 and 2017 are
same. The difference is visible in the figure of retained earnings which are increase in year 2018
up to the limit of 660 from 579 in 2017. Increase in long term borrowing within the non current
liabilities that depicts the loan is taken by the organisation from the external parties. The current
liabilities of the organisation is also increased and attained the mark of 583 in 2018 which was
238 in 2017. The different ratios calculated for the purpose of analysing performance of the
organisation are presented below:
Current ratio: Calculation of this ratio in relation to the organisation help to determine
the ability to pay sorter term debts. The importance of this in respect to Roast Ltd is determined
as assumption can be made that able to pay current current liabilities or not with the help of short
term assets.
Formula: Current assets/Current liabilities
Calculation of ratio for the year 2017 and 2018 is presented below:
Particulars 2017 2018
Current assets 347 447
Current liabilities 138 308
Current ratio 2.51 1.45
Interpretation: It is interpreted that current ratio is decreased in 2018 from the one
present in 2017. This represents the low ability of organisation to pay current liabilities in year
2018.
Quick ratio: The main aim behind the calculation of this ratio is about analysis of actual
liquid position of company. This provides an opportunity to ascertain that enterprise have power
to meet short term obligation with the aid of quick assets (Lusardi, 2012).
Formula: Quick Assets/Current liabilities
Calculation of quick ratio for the year 2017 and 2018 is presented below
5
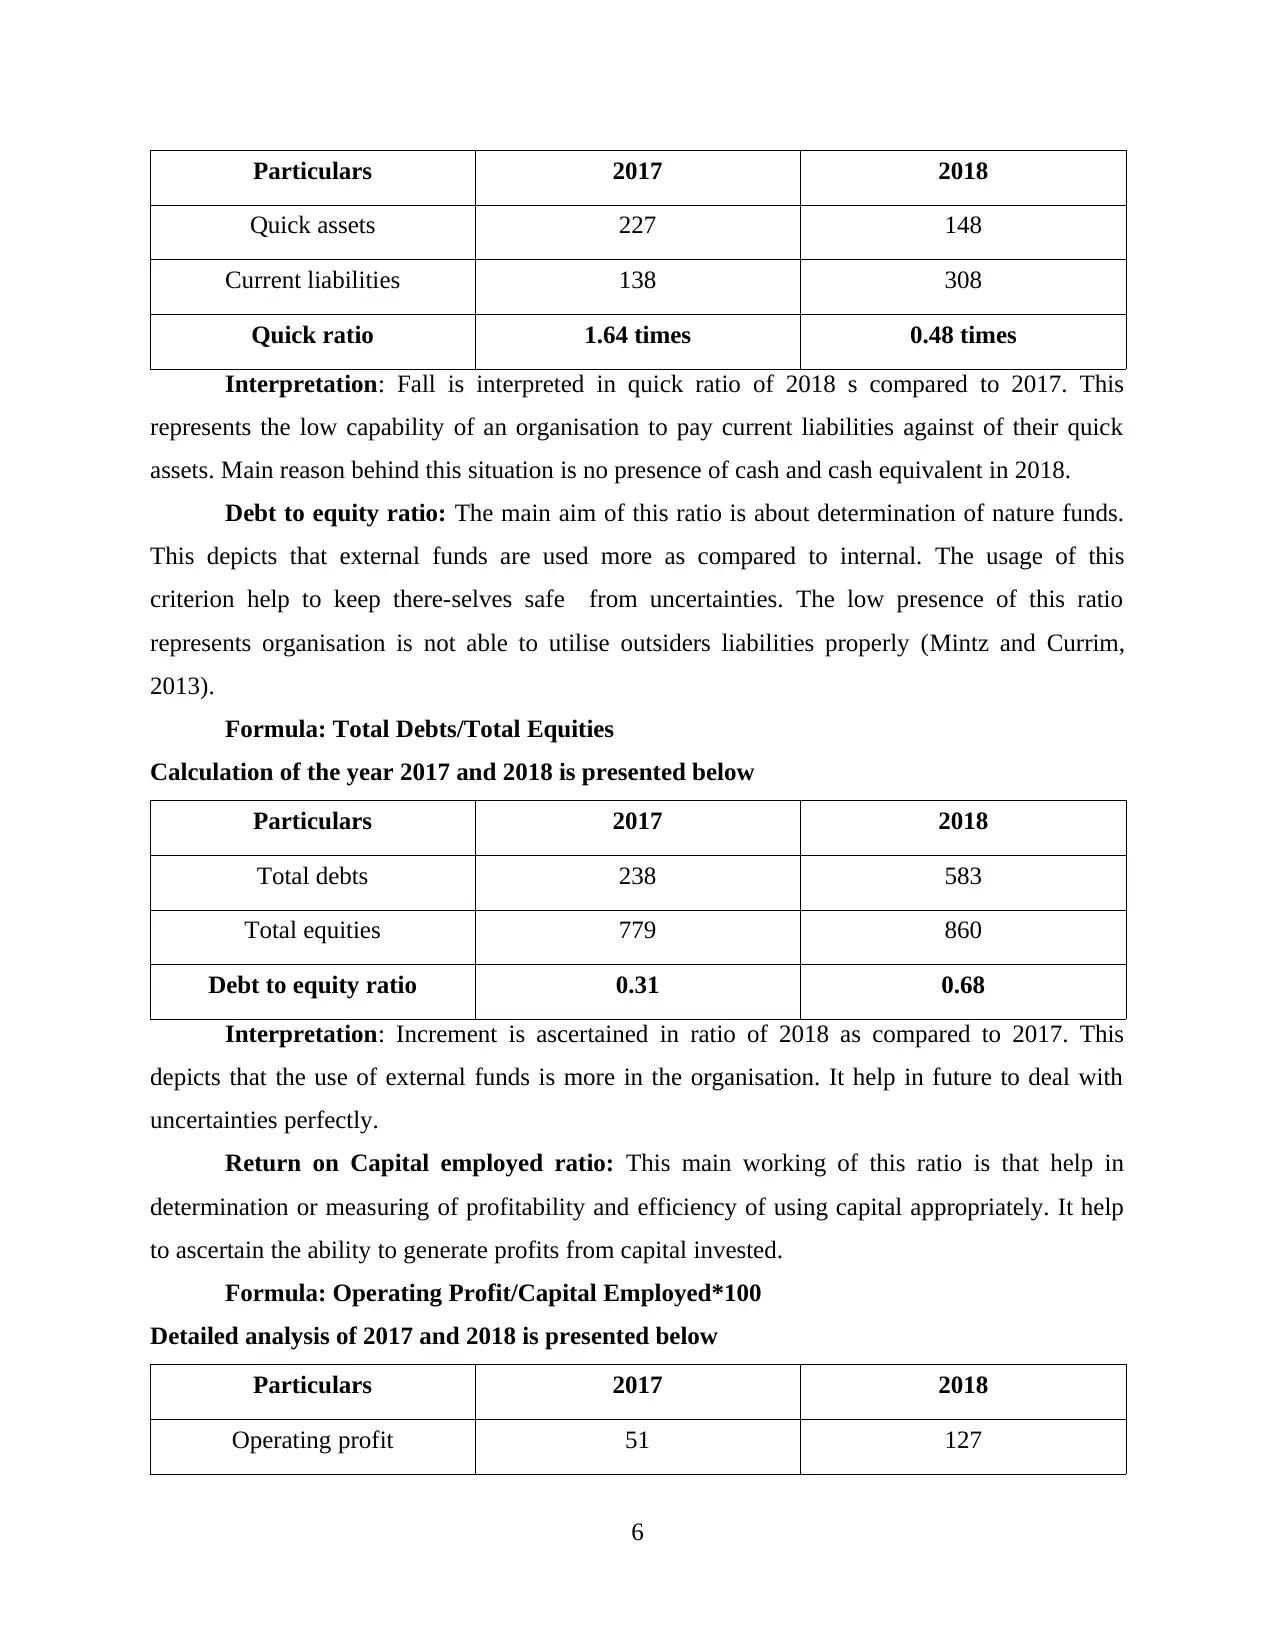
Particulars 2017 2018
Quick assets 227 148
Current liabilities 138 308
Quick ratio 1.64 times 0.48 times
Interpretation: Fall is interpreted in quick ratio of 2018 s compared to 2017. This
represents the low capability of an organisation to pay current liabilities against of their quick
assets. Main reason behind this situation is no presence of cash and cash equivalent in 2018.
Debt to equity ratio: The main aim of this ratio is about determination of nature funds.
This depicts that external funds are used more as compared to internal. The usage of this
criterion help to keep there-selves safe from uncertainties. The low presence of this ratio
represents organisation is not able to utilise outsiders liabilities properly (Mintz and Currim,
2013).
Formula: Total Debts/Total Equities
Calculation of the year 2017 and 2018 is presented below
Particulars 2017 2018
Total debts 238 583
Total equities 779 860
Debt to equity ratio 0.31 0.68
Interpretation: Increment is ascertained in ratio of 2018 as compared to 2017. This
depicts that the use of external funds is more in the organisation. It help in future to deal with
uncertainties perfectly.
Return on Capital employed ratio: This main working of this ratio is that help in
determination or measuring of profitability and efficiency of using capital appropriately. It help
to ascertain the ability to generate profits from capital invested.
Formula: Operating Profit/Capital Employed*100
Detailed analysis of 2017 and 2018 is presented below
Particulars 2017 2018
Operating profit 51 127
6
⊘ This is a preview!⊘
Do you want full access?
Subscribe today to unlock all pages.
Trusted by 1+ million students worldwide
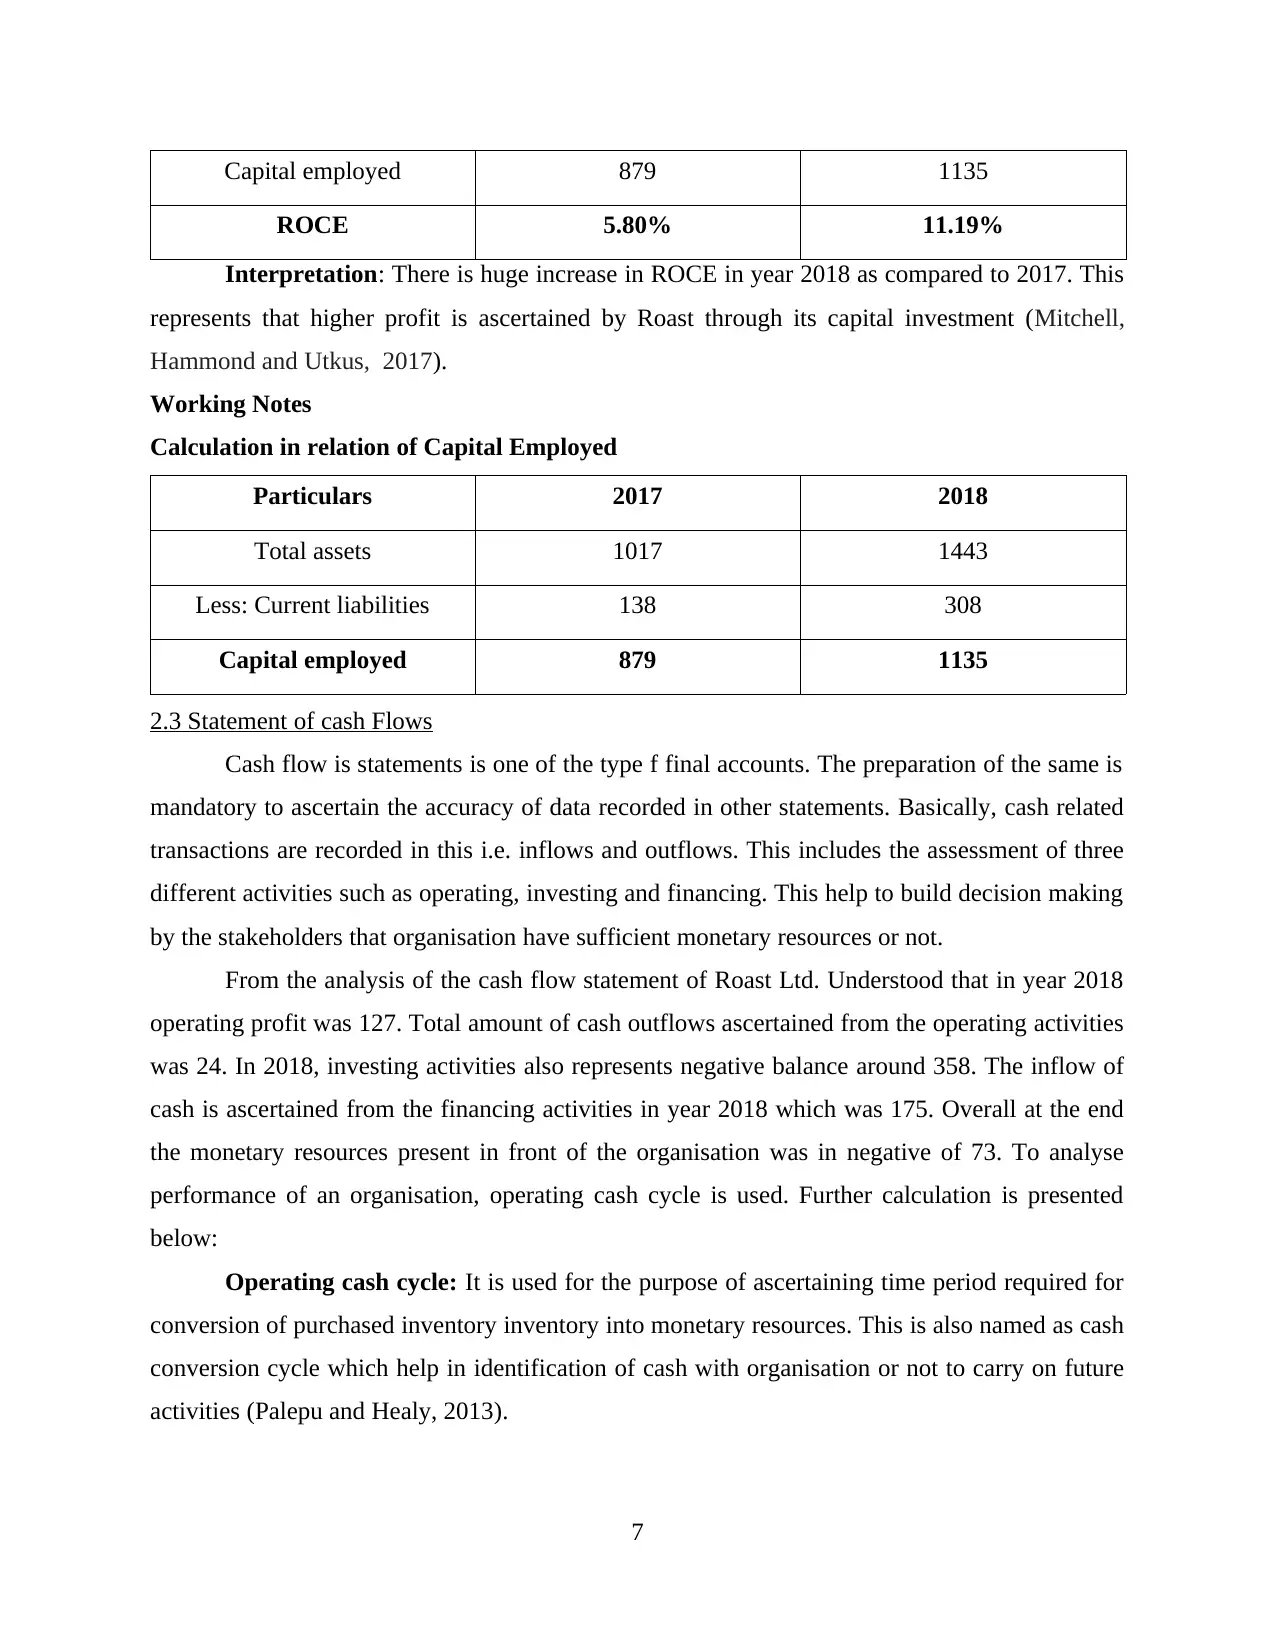
Capital employed 879 1135
ROCE 5.80% 11.19%
Interpretation: There is huge increase in ROCE in year 2018 as compared to 2017. This
represents that higher profit is ascertained by Roast through its capital investment (Mitchell,
Hammond and Utkus, 2017).
Working Notes
Calculation in relation of Capital Employed
Particulars 2017 2018
Total assets 1017 1443
Less: Current liabilities 138 308
Capital employed 879 1135
2.3 Statement of cash Flows
Cash flow is statements is one of the type f final accounts. The preparation of the same is
mandatory to ascertain the accuracy of data recorded in other statements. Basically, cash related
transactions are recorded in this i.e. inflows and outflows. This includes the assessment of three
different activities such as operating, investing and financing. This help to build decision making
by the stakeholders that organisation have sufficient monetary resources or not.
From the analysis of the cash flow statement of Roast Ltd. Understood that in year 2018
operating profit was 127. Total amount of cash outflows ascertained from the operating activities
was 24. In 2018, investing activities also represents negative balance around 358. The inflow of
cash is ascertained from the financing activities in year 2018 which was 175. Overall at the end
the monetary resources present in front of the organisation was in negative of 73. To analyse
performance of an organisation, operating cash cycle is used. Further calculation is presented
below:
Operating cash cycle: It is used for the purpose of ascertaining time period required for
conversion of purchased inventory inventory into monetary resources. This is also named as cash
conversion cycle which help in identification of cash with organisation or not to carry on future
activities (Palepu and Healy, 2013).
7
Paraphrase This Document
Need a fresh take? Get an instant paraphrase of this document with our AI Paraphraser
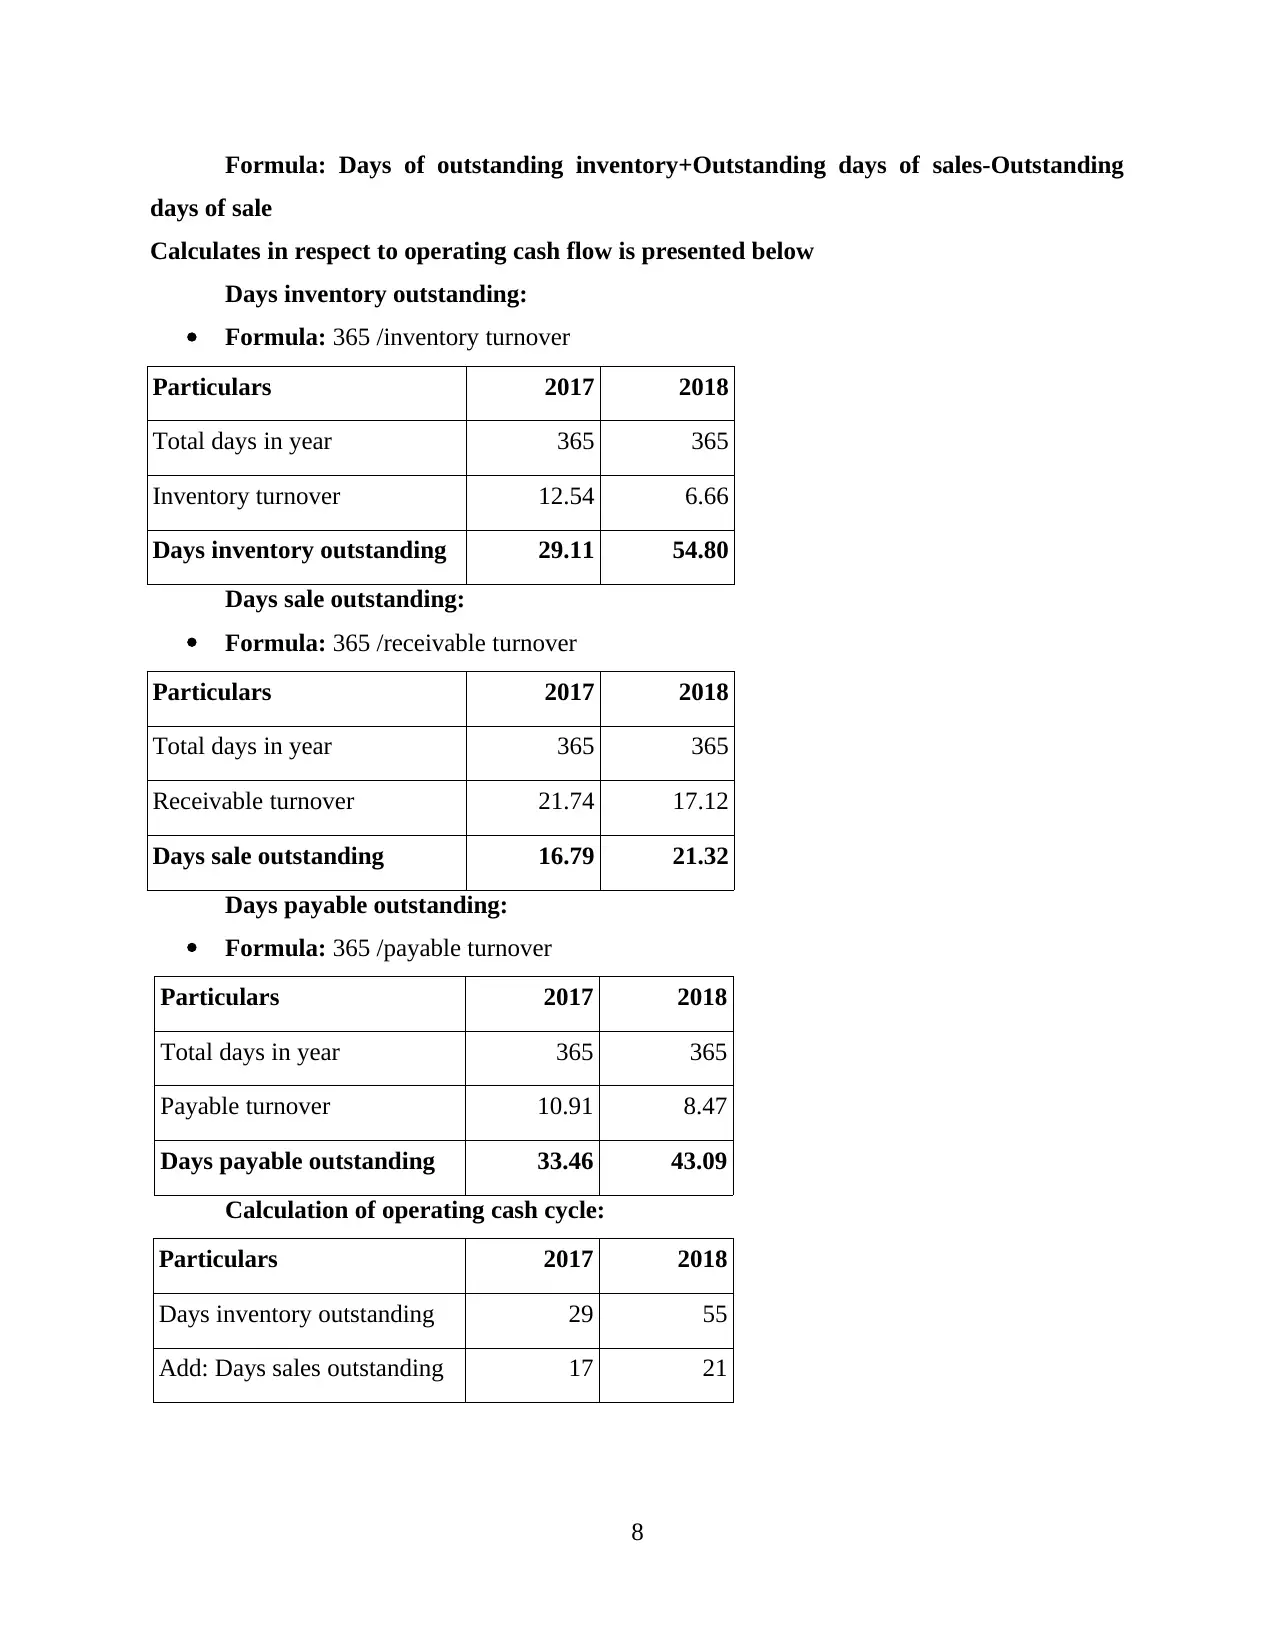
Formula: Days of outstanding inventory+Outstanding days of sales-Outstanding
days of sale
Calculates in respect to operating cash flow is presented below
Days inventory outstanding:
Formula: 365 /inventory turnover
Particulars 2017 2018
Total days in year 365 365
Inventory turnover 12.54 6.66
Days inventory outstanding 29.11 54.80
Days sale outstanding:
Formula: 365 /receivable turnover
Particulars 2017 2018
Total days in year 365 365
Receivable turnover 21.74 17.12
Days sale outstanding 16.79 21.32
Days payable outstanding:
Formula: 365 /payable turnover
Particulars 2017 2018
Total days in year 365 365
Payable turnover 10.91 8.47
Days payable outstanding 33.46 43.09
Calculation of operating cash cycle:
Particulars 2017 2018
Days inventory outstanding 29 55
Add: Days sales outstanding 17 21
8
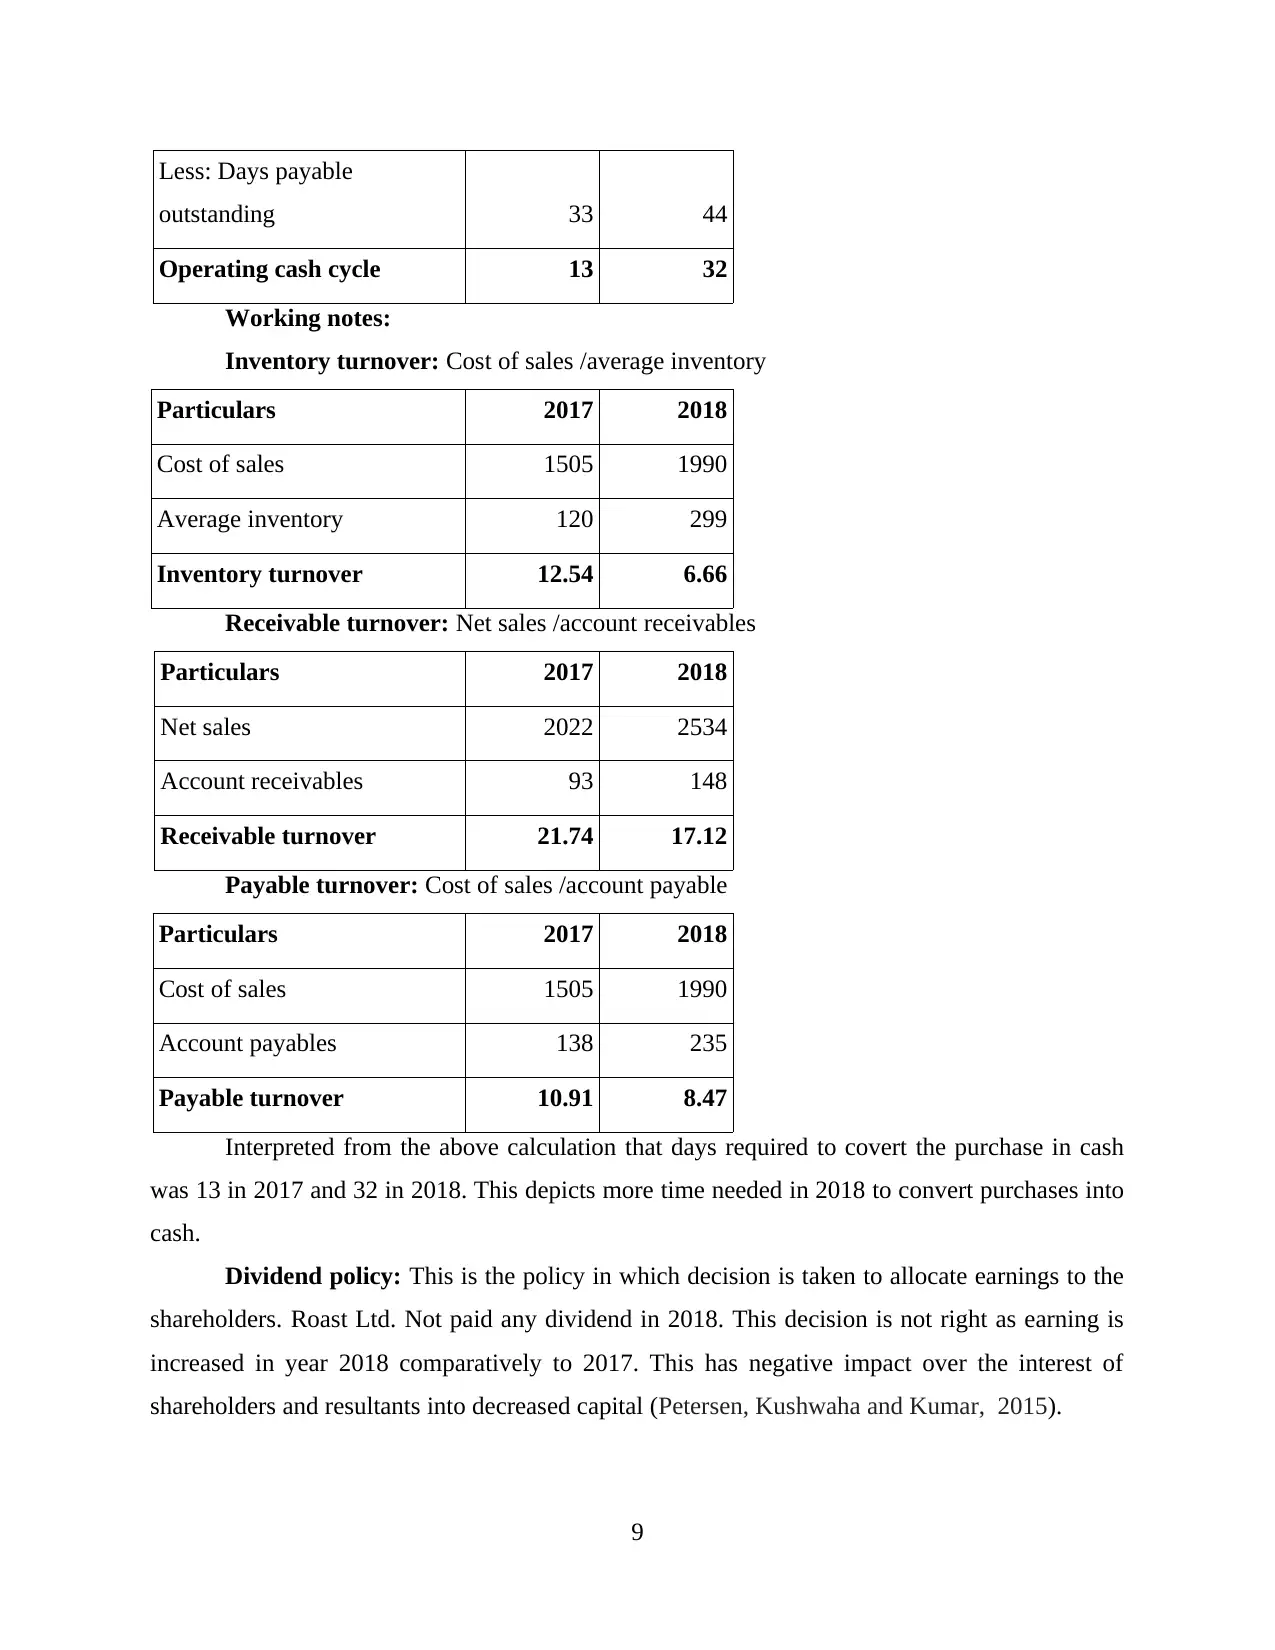
Less: Days payable
outstanding 33 44
Operating cash cycle 13 32
Working notes:
Inventory turnover: Cost of sales /average inventory
Particulars 2017 2018
Cost of sales 1505 1990
Average inventory 120 299
Inventory turnover 12.54 6.66
Receivable turnover: Net sales /account receivables
Particulars 2017 2018
Net sales 2022 2534
Account receivables 93 148
Receivable turnover 21.74 17.12
Payable turnover: Cost of sales /account payable
Particulars 2017 2018
Cost of sales 1505 1990
Account payables 138 235
Payable turnover 10.91 8.47
Interpreted from the above calculation that days required to covert the purchase in cash
was 13 in 2017 and 32 in 2018. This depicts more time needed in 2018 to convert purchases into
cash.
Dividend policy: This is the policy in which decision is taken to allocate earnings to the
shareholders. Roast Ltd. Not paid any dividend in 2018. This decision is not right as earning is
increased in year 2018 comparatively to 2017. This has negative impact over the interest of
shareholders and resultants into decreased capital (Petersen, Kushwaha and Kumar, 2015).
9
⊘ This is a preview!⊘
Do you want full access?
Subscribe today to unlock all pages.
Trusted by 1+ million students worldwide
1 out of 17
Related Documents


Your All-in-One AI-Powered Toolkit for Academic Success.
+13062052269
info@desklib.com
Available 24*7 on WhatsApp / Email
![[object Object]](/_next/static/media/star-bottom.7253800d.svg)
Unlock your academic potential
Copyright © 2020–2026 A2Z Services. All Rights Reserved. Developed and managed by ZUCOL.