BAFI 1070 Assignment: Financial Analysis of Saracen Mineral Holdings
VerifiedAdded on 2022/10/01
|28
|5473
|451
Report
AI Summary
This report provides a comprehensive financial analysis of Saracen Mineral Holdings Limited, examining its internal and external arrangements to determine an investment recommendation. The analysis begins with an executive summary, followed by an introduction to the company and the methodology employed. The methodology includes identifying economic characteristics, company strategies, and assessing financial statement quality. The results and discussion section covers qualitative aspects such as company background, strategies, competitive and economic analysis, Porter's five forces, and industry risk. It delves into historical financial performance, including profitability, balance sheet, liquidity, and market performance ratios, alongside bankruptcy analysis and benchmark comparisons. The report then forecasts financial performance and performs a valuation using the free cash flow model to predict investment opportunities. The analysis concludes with a comparison of valuations and a final recommendation on whether investors should buy, hold, or sell the shares, supported by figures and graphs illustrating key financial data and comparisons. The report uses data from 2013-2019 to support its claims.

BAFI 1070 – FINANCIAL STATEMENTS
ANALYSIS
ANALYSIS
Paraphrase This Document
Need a fresh take? Get an instant paraphrase of this document with our AI Paraphraser
TABLE OF CONTENTS
1. Executive Summary.....................................................................................................................5
2. Introduction..................................................................................................................................6
3. Methodology................................................................................................................................6
Identification of economic characteristics of the industry:..........................................................6
Identification of company strategy..............................................................................................6
Assessment of financial statement quality...................................................................................6
Preparation of the forecasted financial statement........................................................................7
Corporate value............................................................................................................................7
4. Results and Discussion................................................................................................................7
4.1 Qualitative analysis................................................................................................................7
4.1.1 Company background.....................................................................................................7
4.1.2 Strategies adopted by company......................................................................................8
4.1.3 Competitive analysis.......................................................................................................8
4.1.4 Economic analysis..........................................................................................................9
4.1.5 Porter five forces.............................................................................................................9
4.1.6 Industry risk analysis....................................................................................................10
4.2 Historical Financial Performance........................................................................................11
4.2.1 Financial Performance and profitability ratio...............................................................11
4.2.2 Balance sheet and Asset Management ratio.................................................................12
4.2.3 Liquidity ratio...............................................................................................................14
4.2.4 Long Term leverage ratio.............................................................................................15
4.2.5 Market Performance ratio.............................................................................................16
4.2.6 Bankruptcy analysis......................................................................................................17
4.2.7 Ratio comparison with benchmark...............................................................................17
4.3 Forecast Financial Performance..........................................................................................22
4.3.1 Assumption to forecast.................................................................................................22
4.3.2 Forecast.........................................................................................................................23
4.4 Valuation..............................................................................................................................23
4.4.1 Required Rate of Return on Equity Capital..................................................................23
4.4.2 Valuation Method 1 – Free cash flow model................................................................24
4.4.3 Comparison of Valuations and Recommendation........................................................25
Conclusion.............................................................................................................................25
References......................................................................................................................................26
⊘ This is a preview!⊘
Do you want full access?
Subscribe today to unlock all pages.
Trusted by 1+ million students worldwide
LIST OF FIGURES
Figure 1: Chart representing operating profit margin and NPAT in %................................. 12
Figure 2: Chart representing profitability ratios............................................................................12
Figure 3: Chart presenting total asset turnover ratio.....................................................................13
Figure 4: Chart representing account receivable and payable turnover........................................14
Figure 5: Chart presenting liquidity ratios.....................................................................................15
Figure 6: Chart presenting long term leverage ratios....................................................................16
Figure 7: Chart presenting EPS.....................................................................................................17
Figure 8: Chart presenting market performance ratios..................................................................17
Figure 9: Chart representing comparison of current ratio of both the companies.........................19
Figure 10: Chart representing comparison of asset turnover ratio of both the companies............20
Figure 11: Chart representing comparison of current interest coverage of both the companies...20
Figure 12: Graph representing comparison of net margin ratio of both the companies................21
Figure 13: Graph representing comparison of return on asset ratio of both the companies..........22
Figure 14: Graph representing Z-score of both the companies.....................................................22
Figure 15 : Graph representing forecasted as well as actual performance of Saracen Mineral
Holdings Ltd..................................................................................................................................24
Figure 16: Figure representing net present value of forecasted free cash flows...........................25
Paraphrase This Document
Need a fresh take? Get an instant paraphrase of this document with our AI Paraphraser
1. Executive Summary
The primary objective of this study is the critical evaluation of listed company named as Saracen
Mineral Holding Ltd. A detailed examination has been conducted with respect to internal and
external arrangement of the company. On the basis of outcomes a recommendation was made
whether investor should purchase, hold, or sell the shares of Saracen Mineral Holding. In this
study for valuation, dividend discount model and free cash flow model is applied. The main
objective of these techniques is to predict investment opportunities in company. It indicates that
shares of company are undervalued; therefore investor should hold or purchase shares and sell in
the future period for maximization of profit.
2. Introduction
Saracen Mineral Holdings Limited runs as a holding company. The company with its
subsidiaries, discovers and mines gold as well as other related minerals. It serves customers
predominantly in Australia. The company discovers for gold as well as nickel deposits and has
the ownership of 100% interest in the Carosue Dam operations and Thunderbox operations. The
major competitors of the company are Newcrest Mining Limited and Evolution Mining Limited.
The present study was evaluated by considering the macro and microeconomic aspect where
questions were responded of earnings of the business, future growth, efficiency level, financial
stability, and recommendations to the investors. Ratio analysis of the Saracen Moneral Holdings
Limited was examined from 2013 to 2019. Profitability ratio of the company shows about future
growth. Indicators of market performance (EPS and PE) show the positive performance of
company. Overall, historical data and past trend are used for analysis of overall position of
company.
3. Methodology
The overall analysis is followed by considering the below-presented structure:
Identification of economic characteristics of the industry:
In this section, the company background is covered wherein its products and services are
discussed while discussing on the micro-economic factors as well.
Identification of company strategy
Under this sector, the internal, as well as external strategies of the company, are explained, with
putting weight on how the company has attained its goals and objectives, stood apart from the
competitions and how it gained a leading position in the gold industry.
Assessment of financial statement quality
In this part, there has been an examination of three key financial statements conducted, which are
supported by the company performance delivered. The profit and loss statement depicted a
direct link among Earnings before interest and tax, operating profit, and Net profit after tax,
where earnings had increased in subsequent years. On the basis of Balance Sheet of company,
there is slow enhancement in total assets of company as compared with its previous year. On the
⊘ This is a preview!⊘
Do you want full access?
Subscribe today to unlock all pages.
Trusted by 1+ million students worldwide
other hand, it the upcoming year the assets of company would rise because it is in growing
phase.
Preparation of the forecasted financial statement
The forecasted financial statement is prepared on the assumption of good growth in the company
for the next six years. However, it is difficult to predict the performance of the company
Corporate value
On the basis of the overall analysis, this part covers recommendations to the firm on how they
can increase their value.
4. Results and Discussion
4.1 Qualitative analysis
4.1.1 Company background
It is involved in exploration of gold mining as well as minerals, and its segments are inclusive of
Saracen Gold Mines Pty Limited (SGM), which comprise the discovery, production and
administration related with Carosue Dam operations (CDO); and there is Saracen Mineral
Holdings Limited (SAR), which comprise the company administration as well as Saracen Metals
Pty Limited (SME) which covers exploring, developing, producing and administrating associated
with Thunderbox operations (TBO)(Saracen Mineral Holdings Limited, 2014).The company is a
shining instance of the success been enjoyable by the Australian gold miner’s new generation
and their shareholders. Lately, the company was promoted in the ASX 200, as of its growth and
doubled production and sustainable cash flows. Simultaneously, the company has no debts due to
its effective strategies of financing its project developments from cash flows. Saracen Mineral
Holdings Limited has listed on the ASE(Australian Securities Exchange)with the code of SAR.
The segments of the company fall under these key areas namely; Infrastructure &
Facilities:Mining and Exploration (Saracen Mineral Holding Limited, 2019). The production of
Saracen comes from two key WA projects, and these operations have long-term lives with the
broad possibility for further growth with the help of exploration. The integration of strong cash
flows, no debts at all, as well as rising exploration has left company effectively placed to take
full benefit of the existing gold environment. The prominent board and managerial authorities are
Paraphrase This Document
Need a fresh take? Get an instant paraphrase of this document with our AI Paraphraser
highly emphasized on the sustainable growth that adds value to the core stakeholders (Andrews,
2017).
4.1.2 Strategies adopted by the company
The company has crossed a considerable milestone within its strategy to develop mine life and
production at its operations related to gold. In addition, the company is concentrated on two
projects of Western Australia, which are the Carosue Dam Operation and Thunderbox
Operation(Washbourne, 2019). It has disclosed an ore reserve of 2.5 million gold ouncer as on
30 June 2018, rising to 20% from 2.1 million gold ounces as on 30 June 2017. By considering
this aspect, the company has a strategy to develop production by 35000 gold ounces every year.
Saracen has been promoting its flight to 400 based strategies to take its production by 400,000oz
per annum. Production will continue to rise towards the steady-state range of mine by between
60,000t - 80,000t each month at the time of Q1 FY2020 (Saracen Annual Report, 2019). This is
aligned with the strategy of the company of acknowledging bulk underground production in the
direct trucking distance of the mill of CDO. The strategy of the company is to continue work on
the Life of Mine strategy of baseload feed from several sources adjoining to the TBO mill with
bolt over the growth options in order to make increment in production.
4.1.3 Competitive analysis
Consistent profitability has improvised the number of players within the industry over the past
two years, which has placed downward pressure on the profitability as well as on the sales as a
large.Saracen Mineral Limited is considered as the leading gold mining and mineral exploration
company in Western Australia, and the company has seen no debt and double profitability
recently. However, the major firms competing with the gold mining dominator are Newcrest
Mining Limited and Evolution Mining Limited (Piper, 2018). Yet, Saracen has acknowledged
higher market growth and sales as compared to these competitors, with the market capitalization
of $0.00 and a generation of $555.59 million in revenue every year. Further competitors of the
company are BHP Group, , , , , , , , , and .
4.1.4 Economic analysis
Gold mining companies are considered as the main income source and economic growth, with a
significant role in promoting sustainable social and economic development. In contemporary
Australia, gold stays as a large and significant economic element. It is ranked on 3rd position as a
commodity for the economy of Australia, only exceeded by its export-based of coal and iron
ore(Simply Wall St, 2019). Saracen is one of the largest companies of gold mining of Western
Australia, and it is at the forefront of this, its focus in the exploration, mining and selling of gold
products. The largest economic core factors that drive the business of Saracen is the inflation rate
and government rules and regulations. It can be stated that when inflation raises the currency
value drags down and thus, customer tends to retain money in the form of the gold(Washbourne,
2019) . Thus, when inflation stays as high on a long-term time, gold acts as a tool to hedge in
opposition to the inflationary condition. Since, in the uncertain era, the gold mining industry
generally face strict inflation rate, and it identifies the aggregate demand and aggregate
investment in the economy, so, therefore, it impacts intensely. In addition, the company also
faces severe rules and regulations, and various laws to comply with, there are also several legal
documents and aspects to adhere to, which makes the operations more complicated.
4.1.5 Porter five forces
Threats of New Entrants: There is a difficulty for entrants in attaining economies of scale, plus
there is strong product differentiation which makes the threat of entry low. Along with this, in
order to enter in the gold industry, and compete with the leading firm, there us the requirement of
enormous capital, as well as there is the strict requirement of licence and legal documents
thereby making low threat of entrants(Basu and et al. 2015).
Bargaining power of suppliers:There are higher operations of suppliers in comparison of
customers for the cited company; however, the suppliers have less control over prices which
makes their bargaining weak. The company also has the option of switching costs due to fair
standardization, less differentiation of costs with lower switching costs.
Bargaining power of customers: In the concerned industry, the customers generally have few
firms to choose firm, and they do not have significant control over the process, making their
bargaining low. There is higher product differentiation, and customers do not generally switch,
and since they demand higher quality products and are less price-sensitive, which makes their
bargaining lower.
The threat of rivalry:It can be stated that there is intense rivalry, among the few but large firms.
All of the present company in the industry have large market share, and since the gold mining
⊘ This is a preview!⊘
Do you want full access?
Subscribe today to unlock all pages.
Trusted by 1+ million students worldwide
industry is growing every year and is continue to grow more in future so making the stronger
force in the industry(Piper, 2018).
The threat of substitute: It can be seen that there are very few substitutes available for customer,
and these accessible products are comparatively expensive as offered by the Saracen, which
reflects that customers are less expected to switch to alternative products thereby making the
threat of substitute weak.
4.1.6 Industry risk analysis
Industry wherein Saracen Mineral Holding belongs is Gold. In the gold industry, the gold
mining and exploration business have low entry barriers (Eggert, 2017). Gold mining company
face increasing operating cost because grades of mining are decreasing, along with the threat of
significant royalties and taxes, and also keen social responsibility and environmental need
(Adams, 2016). Further, in Australia gold discoveries are less, and exploration efficiency
quantifies that cost of discovery are increasing.
4.2 Historical Financial Performance
4.2.1 Financial Performance and profitability ratio
2013 2014 2015 2016 2017 2018 2019
-40
-30
-20
-10
0
10
20
30
40
Operating margin
NPAT in %
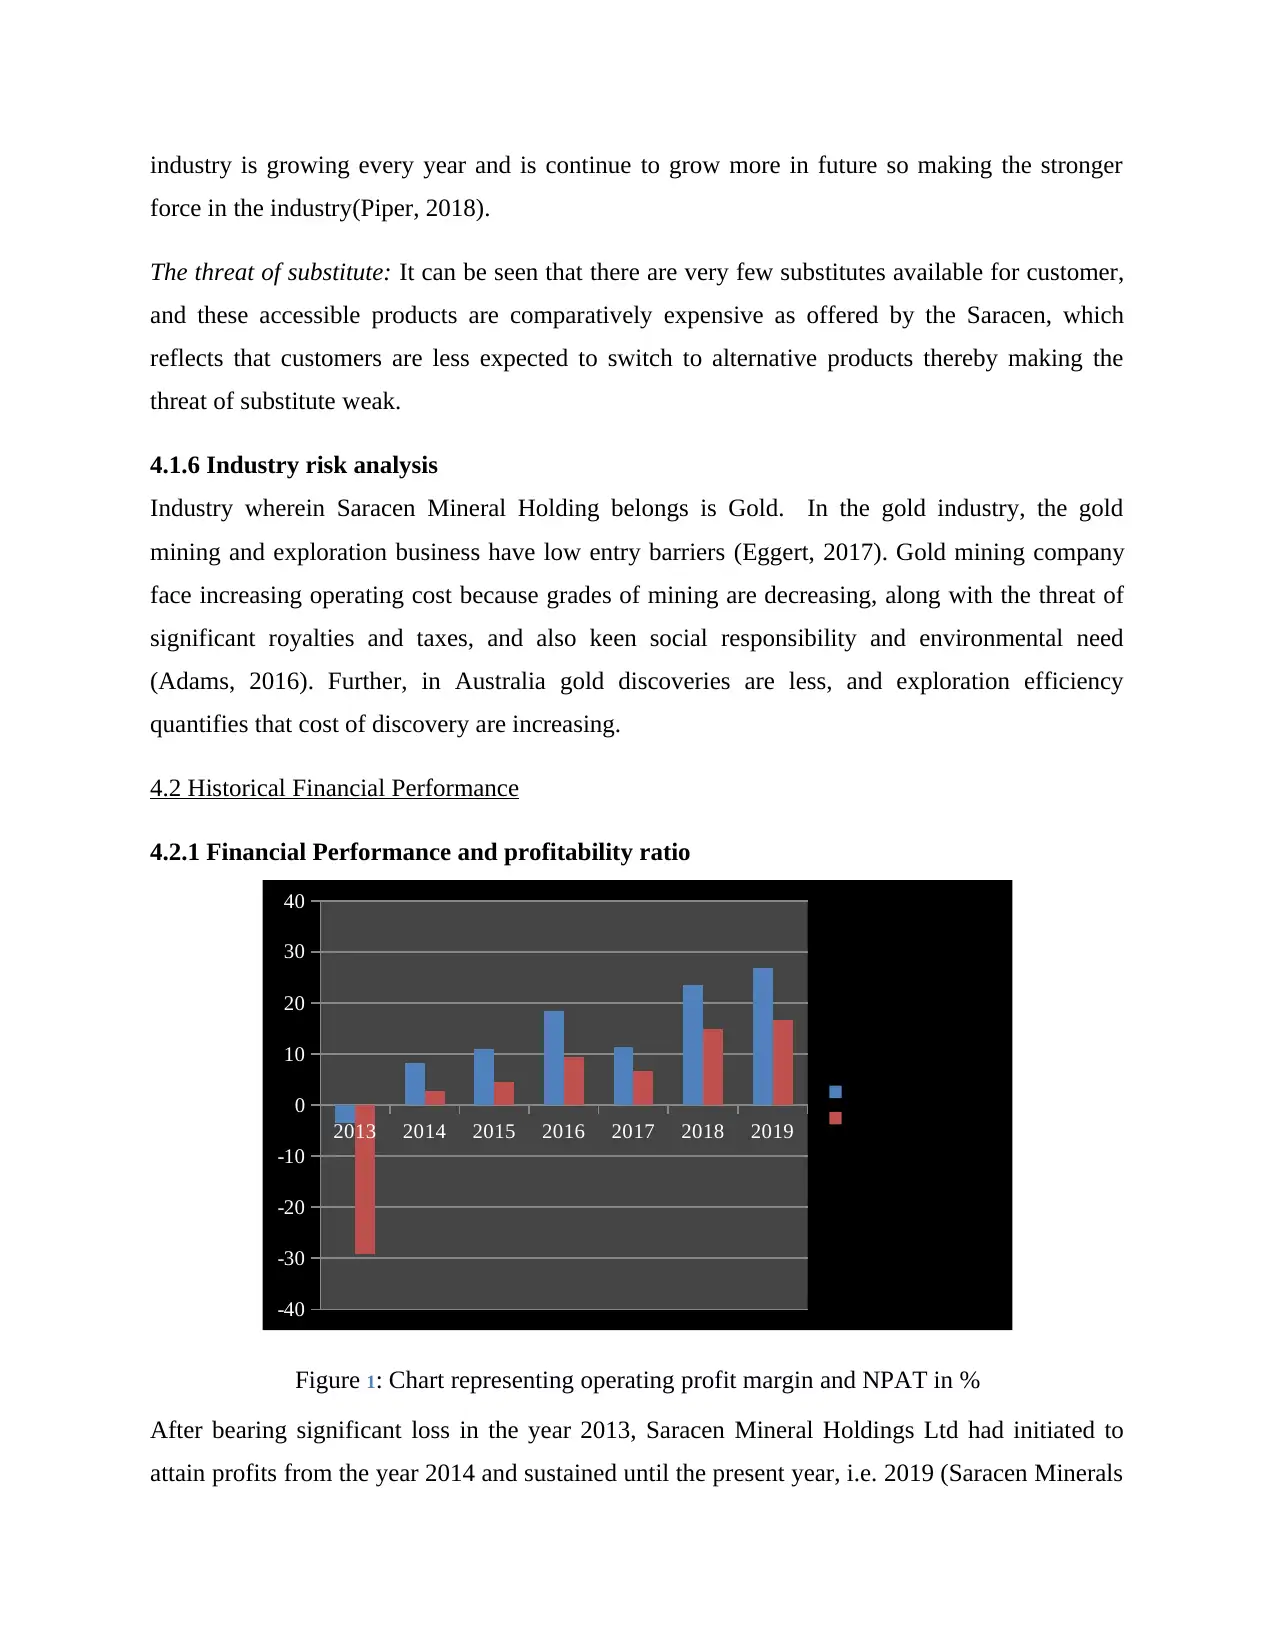
Figure 1: Chart representing operating profit margin and NPAT in %
After bearing significant loss in the year 2013, Saracen Mineral Holdings Ltd had initiated to
attain profits from the year 2014 and sustained until the present year, i.e. 2019 (Saracen Minerals
force in the industry(Piper, 2018).
The threat of substitute: It can be seen that there are very few substitutes available for customer,
and these accessible products are comparatively expensive as offered by the Saracen, which
reflects that customers are less expected to switch to alternative products thereby making the
threat of substitute weak.
4.1.6 Industry risk analysis
Industry wherein Saracen Mineral Holding belongs is Gold. In the gold industry, the gold
mining and exploration business have low entry barriers (Eggert, 2017). Gold mining company
face increasing operating cost because grades of mining are decreasing, along with the threat of
significant royalties and taxes, and also keen social responsibility and environmental need
(Adams, 2016). Further, in Australia gold discoveries are less, and exploration efficiency
quantifies that cost of discovery are increasing.
4.2 Historical Financial Performance
4.2.1 Financial Performance and profitability ratio
2013 2014 2015 2016 2017 2018 2019
-40
-30
-20
-10
0
10
20
30
40
Operating margin
NPAT in %
Figure 1: Chart representing operating profit margin and NPAT in %
After bearing significant loss in the year 2013, Saracen Mineral Holdings Ltd had initiated to
attain profits from the year 2014 and sustained until the present year, i.e. 2019 (Saracen Minerals
Paraphrase This Document
Need a fresh take? Get an instant paraphrase of this document with our AI Paraphraser
Holdings Ltd., 2019). Moreover, the rate of operating profits has increased with a higher pace in
comparison to net profit after tax which represents the efficiency of company in business
operations (Williams, and Dobelman, 2017).
2013 2014 2015 2016 2017 2018 2019
-40
-30
-20
-10
0
10
20
Net Margin Ratio
return on Asset
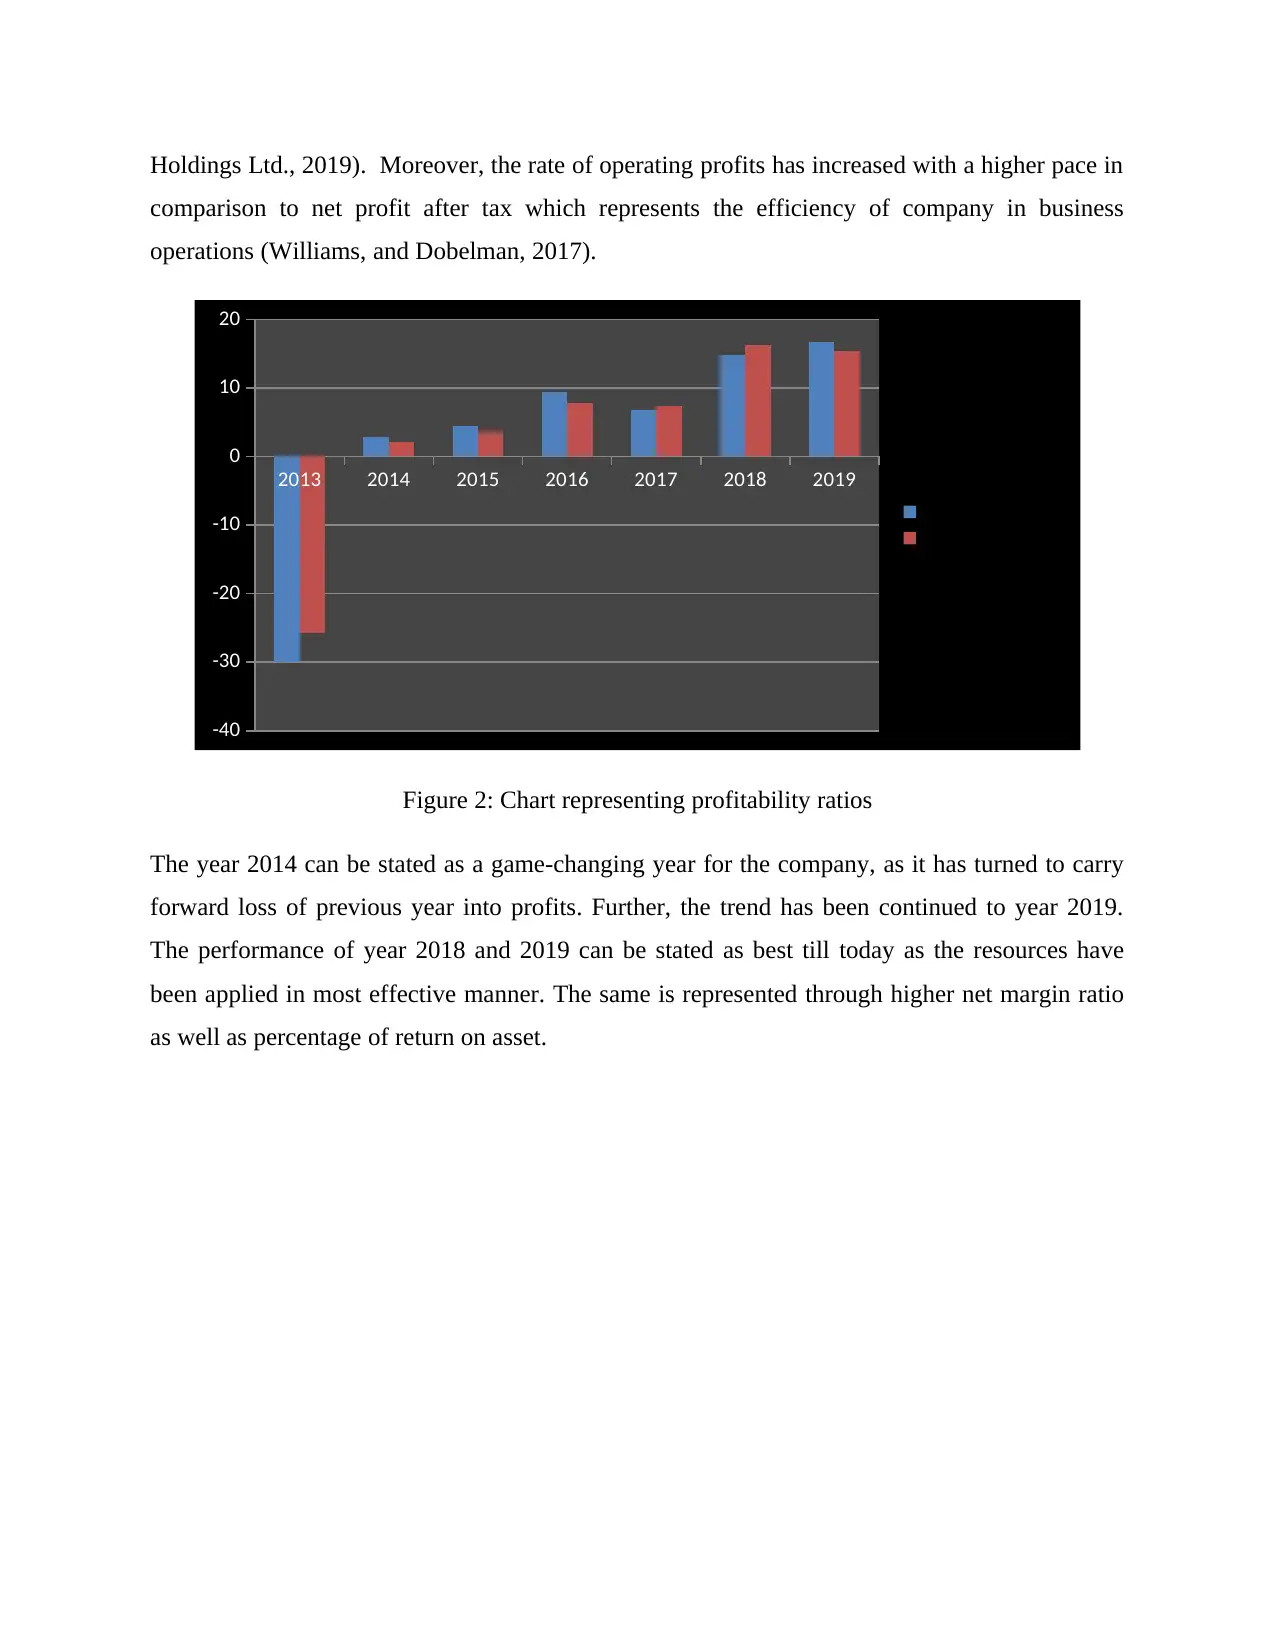
Figure 2: Chart representing profitability ratios
The year 2014 can be stated as a game-changing year for the company, as it has turned to carry
forward loss of previous year into profits. Further, the trend has been continued to year 2019.
The performance of year 2018 and 2019 can be stated as best till today as the resources have
been applied in most effective manner. The same is represented through higher net margin ratio
as well as percentage of return on asset.
comparison to net profit after tax which represents the efficiency of company in business
operations (Williams, and Dobelman, 2017).
2013 2014 2015 2016 2017 2018 2019
-40
-30
-20
-10
0
10
20
Net Margin Ratio
return on Asset
Figure 2: Chart representing profitability ratios
The year 2014 can be stated as a game-changing year for the company, as it has turned to carry
forward loss of previous year into profits. Further, the trend has been continued to year 2019.
The performance of year 2018 and 2019 can be stated as best till today as the resources have
been applied in most effective manner. The same is represented through higher net margin ratio
as well as percentage of return on asset.
4.2.2 Balance sheet and Asset Management ratio
2013 2014 2015 2016 2017 2018 2019
0
0.2
0.4
0.6
0.8
1
1.2
Asset Turnover ratio
Asset Turnover ratio
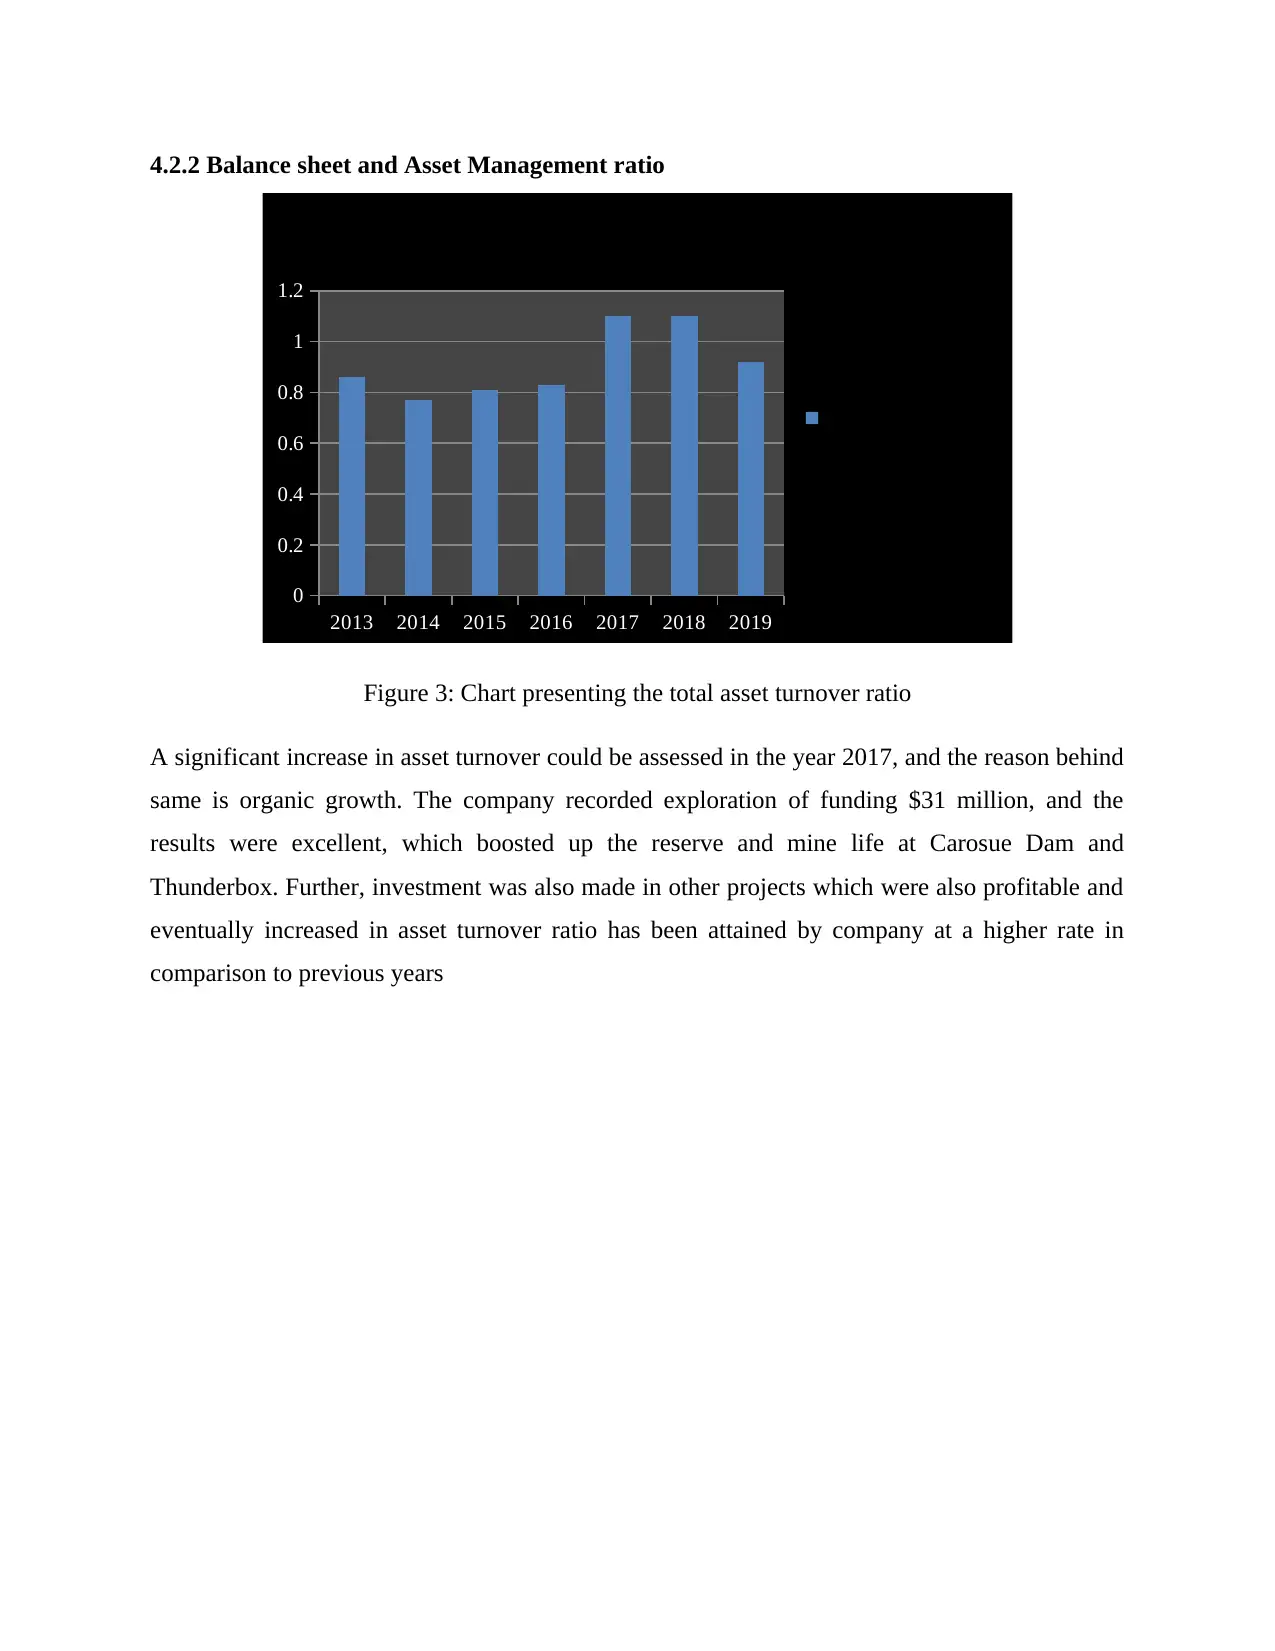
Figure 3: Chart presenting the total asset turnover ratio
A significant increase in asset turnover could be assessed in the year 2017, and the reason behind
same is organic growth. The company recorded exploration of funding $31 million, and the
results were excellent, which boosted up the reserve and mine life at Carosue Dam and
Thunderbox. Further, investment was also made in other projects which were also profitable and
eventually increased in asset turnover ratio has been attained by company at a higher rate in
comparison to previous years
2013 2014 2015 2016 2017 2018 2019
0
0.2
0.4
0.6
0.8
1
1.2
Asset Turnover ratio
Asset Turnover ratio
Figure 3: Chart presenting the total asset turnover ratio
A significant increase in asset turnover could be assessed in the year 2017, and the reason behind
same is organic growth. The company recorded exploration of funding $31 million, and the
results were excellent, which boosted up the reserve and mine life at Carosue Dam and
Thunderbox. Further, investment was also made in other projects which were also profitable and
eventually increased in asset turnover ratio has been attained by company at a higher rate in
comparison to previous years
⊘ This is a preview!⊘
Do you want full access?
Subscribe today to unlock all pages.
Trusted by 1+ million students worldwide
1 out of 28
Related Documents


Your All-in-One AI-Powered Toolkit for Academic Success.
+13062052269
info@desklib.com
Available 24*7 on WhatsApp / Email
![[object Object]](/_next/static/media/star-bottom.7253800d.svg)
Unlock your academic potential
Copyright © 2020–2026 A2Z Services. All Rights Reserved. Developed and managed by ZUCOL.