Comprehensive Financial Statement Analysis of Sony Corporation

Verified

Added on  2023/06/10

|10
|1830
|311
Report
AI Summary
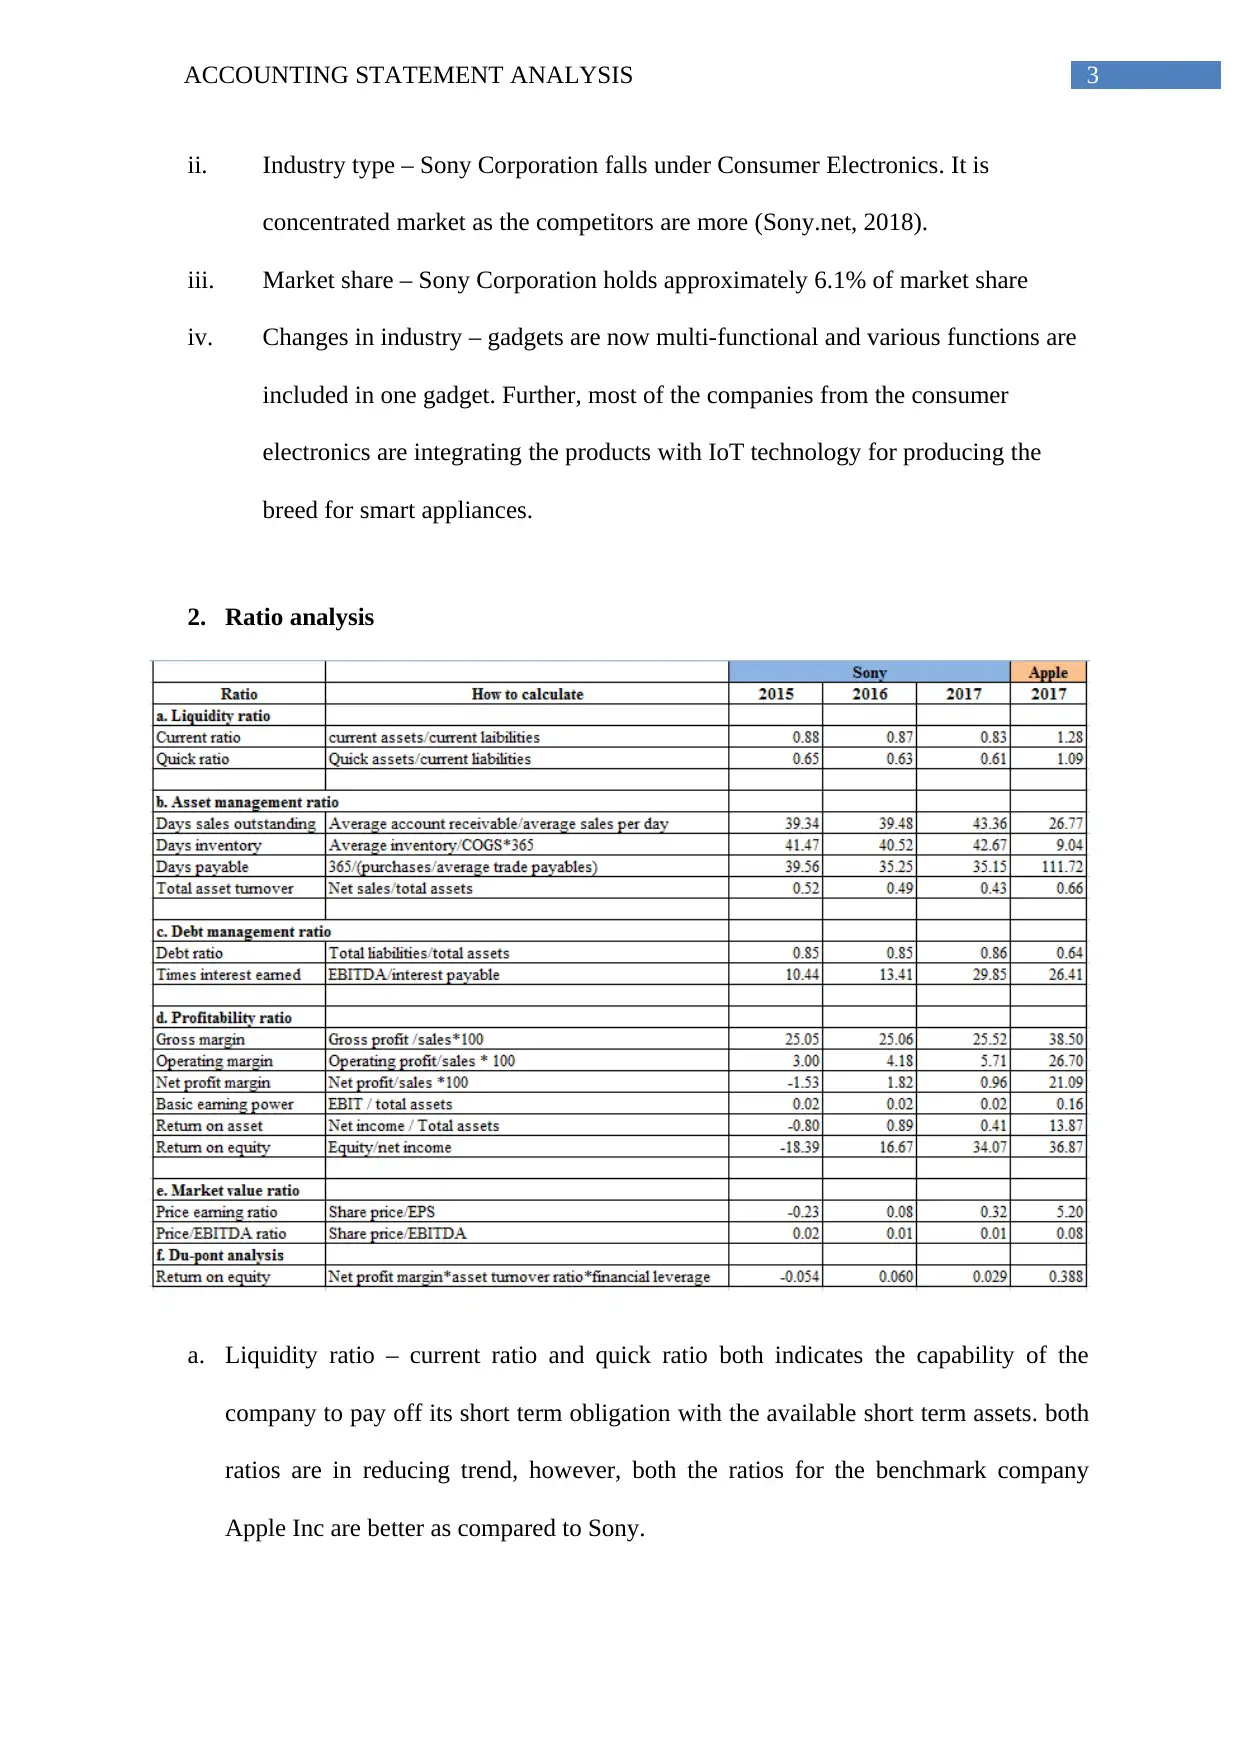
This report provides a comprehensive financial analysis of Sony Corporation, comparing it against a benchmark company (Apple Inc.) within the Consumer Electronics industry. The analysis includes ratio analysis (liquidity, asset management, debt management, profitability, and market value), WACC calculation, free cash flow analysis, and a valuation of operations. The report concludes with a recommendation against investing in Sony's stock due to deteriorating financial performance and negative free cash flow. Additionally, the report touches upon accounting practices, referencing the Enron scandal and emphasizing the importance of ethical accounting. The analysis uses formulas and calculations to provide a detailed financial overview, highlighting strengths and weaknesses in Sony's financial position. Desklib provides solved assignments and past papers for students.
tabler-icon-diamond-filled.svg

Contribute Materials

Your contribution can guide someone’s learning journey. Share your documents today.
Document Page
Running head: ACCOUNTING STATEMENT ANALYSIS
Accounting statement analysis
Name of the student
Name of the university
Student ID
Author note
tabler-icon-diamond-filled.svg

Secure Best Marks with AI Grader

Need help grading? Try our AI Grader for instant feedback on your assignments.
Document Page
1ACCOUNTING STATEMENT ANALYSIS
Table of Contents
FINANCIAL MANAGEMENT................................................................................................2
1. Presentation of the company – Sony Corporation..............................................................2
a. Activity............................................................................................................................2
b. Industry...........................................................................................................................2
2. Ratio analysis......................................................................................................................3
3. WACC................................................................................................................................4
4. Free cash flow.....................................................................................................................5
5. Value of operation..............................................................................................................6
6. Conclusion and recommendation........................................................................................6
ACCOUNTING.........................................................................................................................7
Part 1..........................................................................................................................................7
Part 2..........................................................................................................................................7
Reference....................................................................................................................................9
Document Page
2ACCOUNTING STATEMENT ANALYSIS
FINANCIAL MANAGEMENT
1. Presentation of the company – Sony Corporation
a. Activity
i. Product and services – televisions, projections, sound bars and home theatres,
DVD players and blue ray, headphones, wireless speakers, audio systems, MP3
players, digital voice recorder, audio system, home theatre, boom boxes, radios
and portable CD players.
ii. Geographical markets – Sony products are marketed in Japan, Europe and Unite
States.
iii. CEO and other managers – CEO of Sony is Kenichiro Yoshida and other
managers are Osamu Nagayama, Tin Schaaff, Kanemitsu Anraku, Eikoh Harada,
Joichi Ito, Kazuo Matsunaga, Koichi Miyata, John Roos, Eriko Sakurai and
Takaaki Nimura (Sony.net, 2018).
iv. History of company – Sony Corporation is involved in designing, development,
sale and manufacturing of the electronic devices and equipments and software and
game consoles. The company was founded in Nihonbashi, Tokyo in the year
1964. Primary manufacturing facilities of the company is located in Asia.
v. Recent development – DEAG acquires the outstanding 49% of DEAG Classic AG
from Sony and then sold the shares in Raymond Gubbay Limited.
b. Industry
i. Other major players – Samsung, Life’s Good (LG), Panasonic, Dell, Apple and
Philips. However, Apple Inc has been taken as the benchmark company.
Document Page
3ACCOUNTING STATEMENT ANALYSIS
ii. Industry type – Sony Corporation falls under Consumer Electronics. It is
concentrated market as the competitors are more (Sony.net, 2018).
iii. Market share – Sony Corporation holds approximately 6.1% of market share
iv. Changes in industry – gadgets are now multi-functional and various functions are
included in one gadget. Further, most of the companies from the consumer
electronics are integrating the products with IoT technology for producing the
breed for smart appliances.
2. Ratio analysis
a. Liquidity ratio – current ratio and quick ratio both indicates the capability of the
company to pay off its short term obligation with the available short term assets. both
ratios are in reducing trend, however, both the ratios for the benchmark company
Apple Inc are better as compared to Sony.
tabler-icon-diamond-filled.svg

Secure Best Marks with AI Grader

Need help grading? Try our AI Grader for instant feedback on your assignments.
Document Page
4ACCOUNTING STATEMENT ANALYSIS
b. Asset management ratio – all these ratios determines the efficiency of the company
regarding collection of its debts, selling or replacing the inventories and paying of the
payables. Whereas the day’s sales inventory and day’s inventory are in increasing
trend, days payable and asset turnover are in reducing trend. Moreover, except the
days payable all other asset management ratios of Apple Inc are better (Babalola &
Abiola, 2013).
c. Debt management ratio – debt ratio explains the percentage of debt to total asset
whereas times interest earned explain the EBITDA of the company as compared to
interest obligation. It can be observed that the debt ratio as well as times interest
earned is in increasing trend. Further, times interest earned for Sony is better as
compared to Apple.
d. Profitability ratio – profitability ratios states the profit generating capabilities of the
company from the revenues. Gross profit margin, operating margin, return on asset
and return on equity are in increasing trend whereas net profit margin has no specific
trend and basis earning power remained same for all 3 years. However, all the
profitability ratio of Apple Inc is better as compared to Sony.
e. Market value ratio – these ratios states the value generation capacity of the company
from revenue. P/E ratio is in increasing trend whereas the Price/EBITDA ratio is in
decreasing trend. However, both the ratios of Apple Inc are better as compared to
Sony (Vogel, 2014).
f. Du-Pont analysis – this is used for decomposing various drivers of return on equity.
Return on equity has no specific trend for last 3 years. However, the return on equity
for Apple Inc is better as compared to Sony.
Document Page
5ACCOUNTING STATEMENT ANALYSIS
3. WACC
WACC is the calculation of the company’s cost of capital and in WACC calculation
each category of the capital is weighted proportionately. It includes all the source of
capital, like preferred stock, bond, long-term debt and equity.
In calculating WACC, cost of equity and debt are assumed based on the market and
industry.
CAPM calculation
Cost of equity (Ke) = Rf + β (Rm - Rf) (Zabarankin, Pavlikov & Uryasev, 2014).
Beta = 1.65, Rf = 0.03%, (Rm – Rf) = 6%
Therefore, Ke = 0.03 + (1.65 * 6) = 9.93%
WACC computation
Cost of debt = 1.0977%
Cost of equity = 9.93%
Tax rate = 35.505%
WACC = E / (E + D)*Cost of Equity + D / (E + D)*Cost of Debt * (1 - Tax Rate) (Pricing &
Tribunal, 2013).
= 0.8486*9.93% + 0.1514*1.0977% * (1 - 35.505%)
= 8.53%
Document Page
6ACCOUNTING STATEMENT ANALYSIS
4. Free cash flow
Free cash flow is the amount of cash generated by the business after meeting capital
expenses like equipment or building. It is calculated through subtracting the capital
expenses from the operating cash flow.
Free cash flow for last 3 years
Formula 2015 2016 2017
Free cash flow
Cash flow from operation -
capital expenses - £ 11,65,363 - £ 11,12,038 - £ 11,00,786
5. Value of operation
Value of operation is = OFCF / (k-g)
Where, OFCF = operating free cash flow = -£ 11,00,786, k = discount rate or WACC =
8.53%. g = growth rate = 5%
Therefore, value of operation = -£ 11,00,786 / (0.0853 – 0.05) = - £ 311,83,739.38
6. Conclusion and recommendation
From the above analysis it can be concluded that liquidity position, efficiency and
profitability position of the company is deterioration. Further, the ratios are worse as
compared to the industry benchmark Apple Inc. Moreover, the free cash flow of the company
for last 3 years and operational value of the company is negative. Therefore, it is
recommended to the investors not to buy the stock of the company.
tabler-icon-diamond-filled.svg

Paraphrase This Document

Need a fresh take? Get an instant paraphrase of this document with our AI Paraphraser
Document Page
7ACCOUNTING STATEMENT ANALYSIS
ACCOUNTING
Part 1
At the end of 14 years that is at the age of 78 they will be left with positive cash
balance. However, at the age of 83 the cash balance will be negative.
Part 2
2. Accounting practices used by Enron –
Enron applied the accounting practices those were highly aggressive and were
stretching the GAAP (generally accepted accounting principles) to the outmost limits.
Further, the company was using improper accounting method for 4 Raptors that were used by
Enron for engaging in the off balance sheet activities. Further, outstanding equity of the
Document Page
8ACCOUNTING STATEMENT ANALYSIS
shareholders were reduced by $ 1.2 billion through accounting error. Moreover, it hided the
debts amounting to $ 1 billion, manipulated power market in Texas and bribed foreign
governments for getting abroad contracts (Applied Corporate Governance, 2016).
3. Analysis
a. Selected company is Sony Corporation which was founded in Nihonbashi, Tokyo in the
year 1964. Primary manufacturing facilities of the company is located in Asia. It is engaged
in designing, development, sale and manufacturing of the electronic devices and equipments
and software and game consoles (Sony.net, 2018).
b. Foreign investments, income and expenses are valued at foreign exchange rates and
eventually not converted into domestic rate. It will have an impact on the profit and loss
statement of the company (Langfield-Smith et al., 2017).
c. Sony shall not engage in such practices as this will not portray the actual picture of the
company and the potential investors will be ended up in taking wrong decision based on the
profit and loss statement of the company (Al Momamani, 2013).
Reference
Al Momamani, M. A. (2013). The effect of auditors' ethics on their detection of creative
accounting practices: A field study. International Journal of Business and
Management, 8(13), 118.
Applied Corporate Governance. (2016). Enron Case study. [online] Available at:
https://www.applied-corporate-governance.com/case-study/enron-case-study/
[Accessed 11 Jul. 2018].
Document Page
9ACCOUNTING STATEMENT ANALYSIS
Babalola, Y. A., & Abiola, F. R. (2013). Financial ratio analysis of firms: A tool for decision
making. International journal of management sciences, 1(4), 132-137.
Langfield-Smith, K., Smith, D., Andon, P., Hilton, R., & Thorne, H. (2017). Management
accounting: Information for creating and managing value. McGraw-Hill Education
Australia.
Pricing, I., & Tribunal, R. (2013). Review of WACC methodology. Research–Final report.
Sony.net. (2018). Sony Global - Sony Global Headquarters. [online] Available at:
https://www.sony.net/ [Accessed 11 Jul. 2018].
Vogel, H. L. (2014). Entertainment industry economics: A guide for financial analysis.
Cambridge University Press.
Zabarankin, M., Pavlikov, K., & Uryasev, S. (2014). Capital asset pricing model (CAPM)
with drawdown measure. European Journal of Operational Research, 234(2), 508-
517.
chevron_up_icon
1 out of 10
circle_padding
hide_on_mobile
zoom_out_icon
logo.png

Your All-in-One AI-Powered Toolkit for Academic Success.

Available 24*7 on WhatsApp / Email

[object Object]