Financial Statement Analysis, Ratios, and Project Appraisal Solution

Verified

Added on  2023/06/18

|6
|863
|275
Homework Assignment
AI Summary
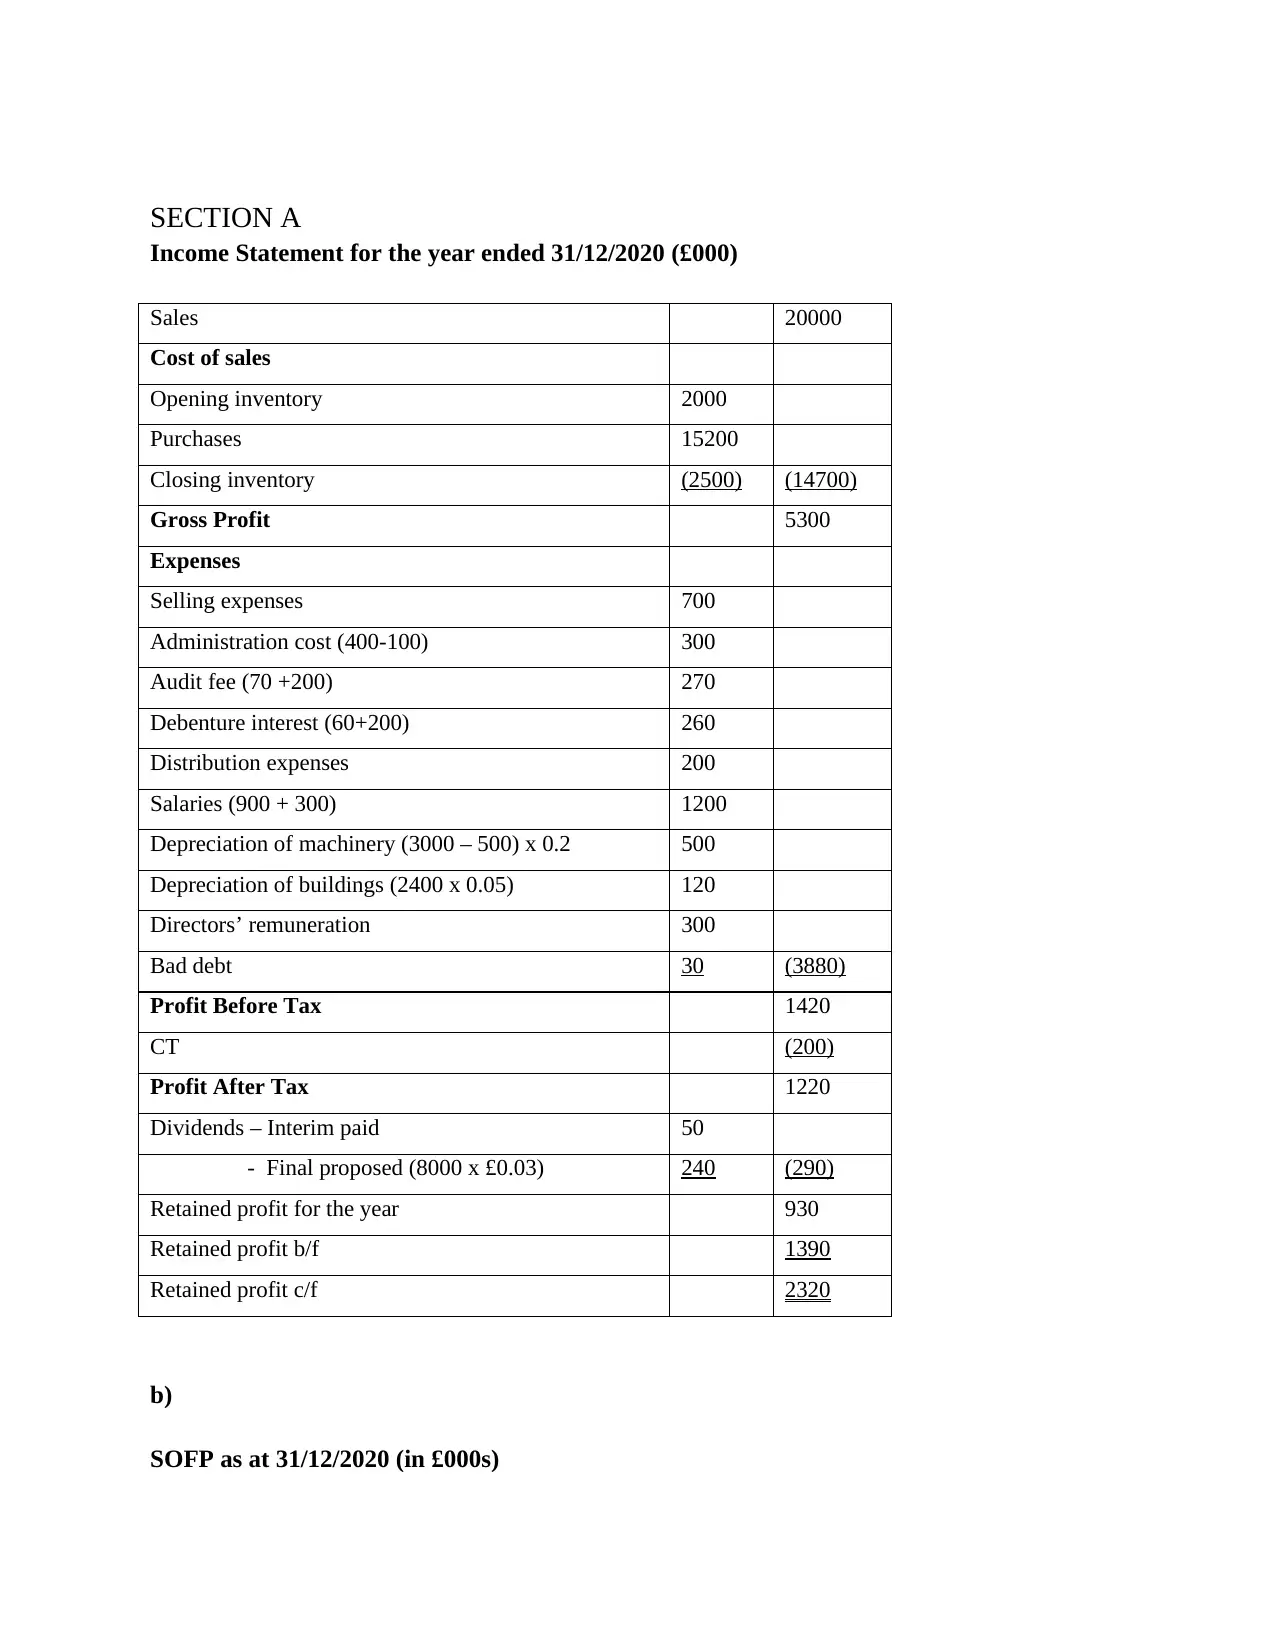
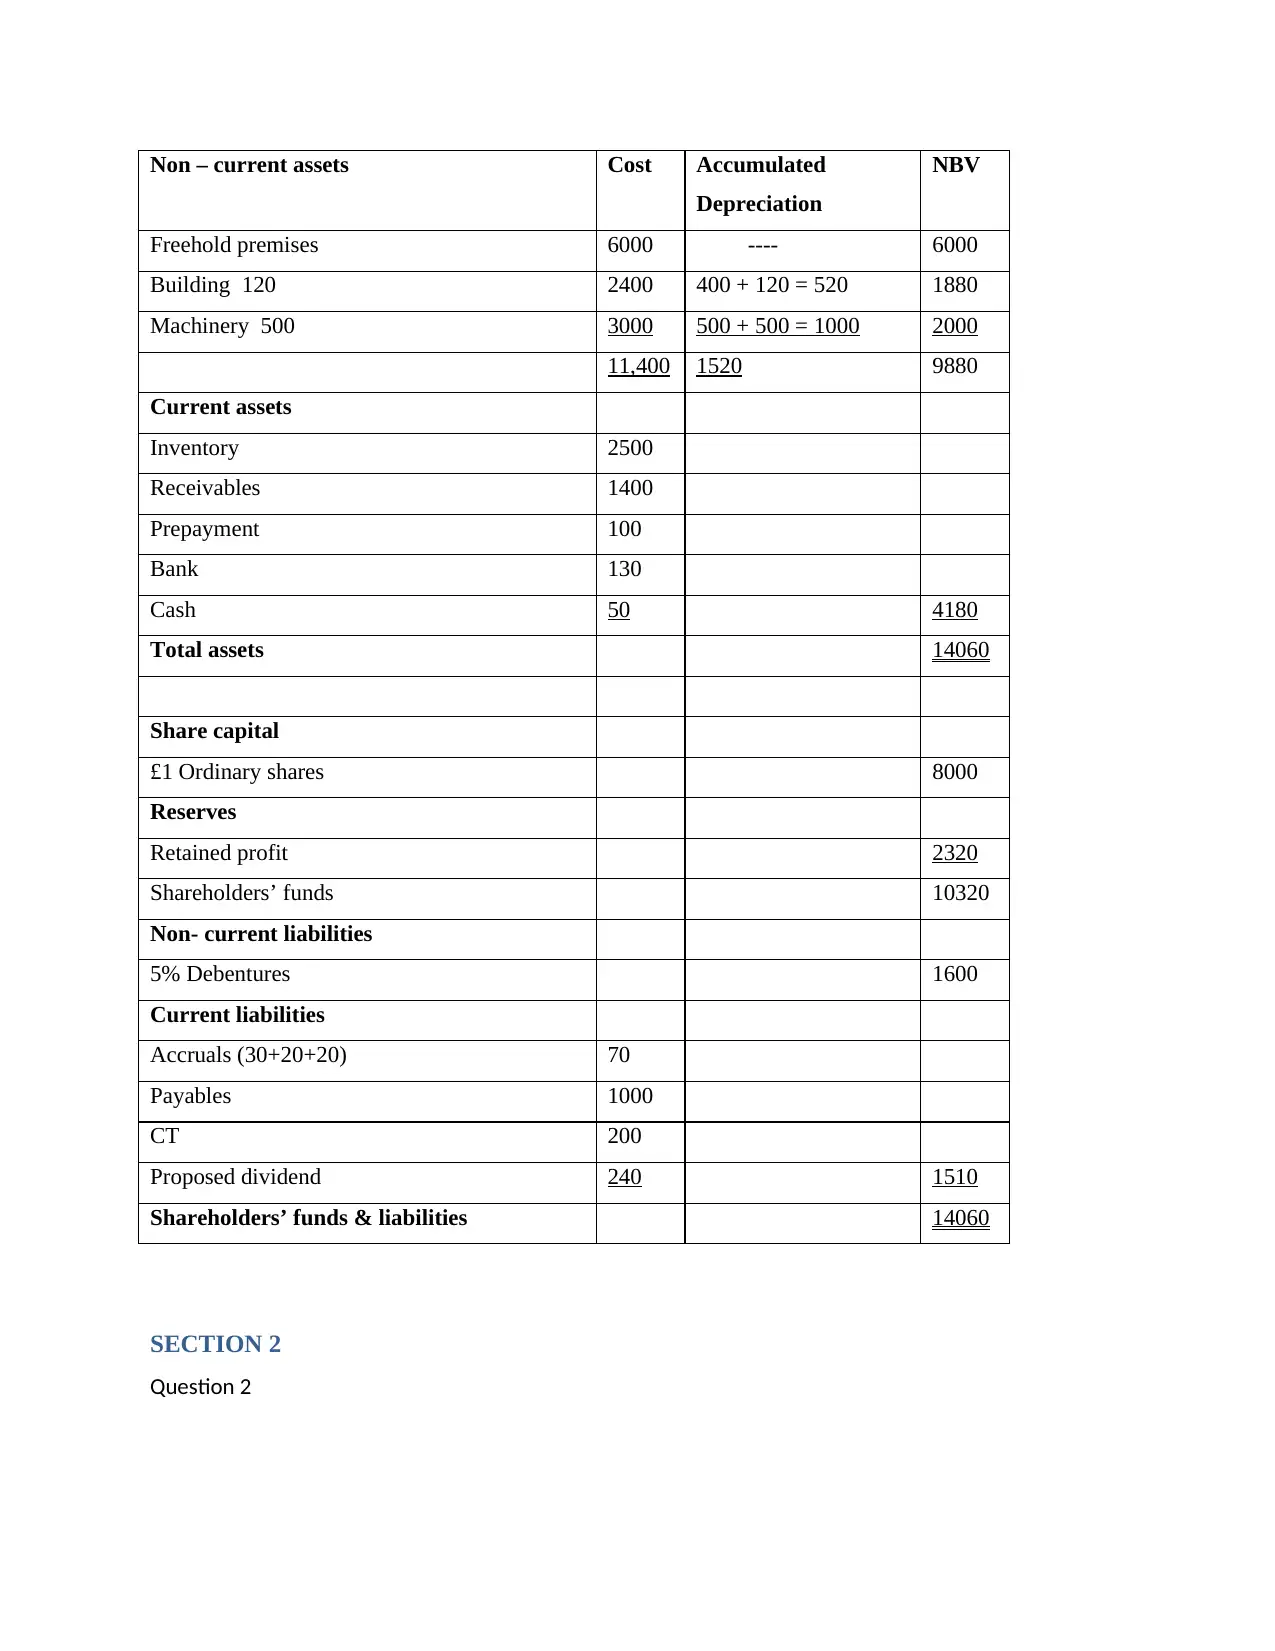
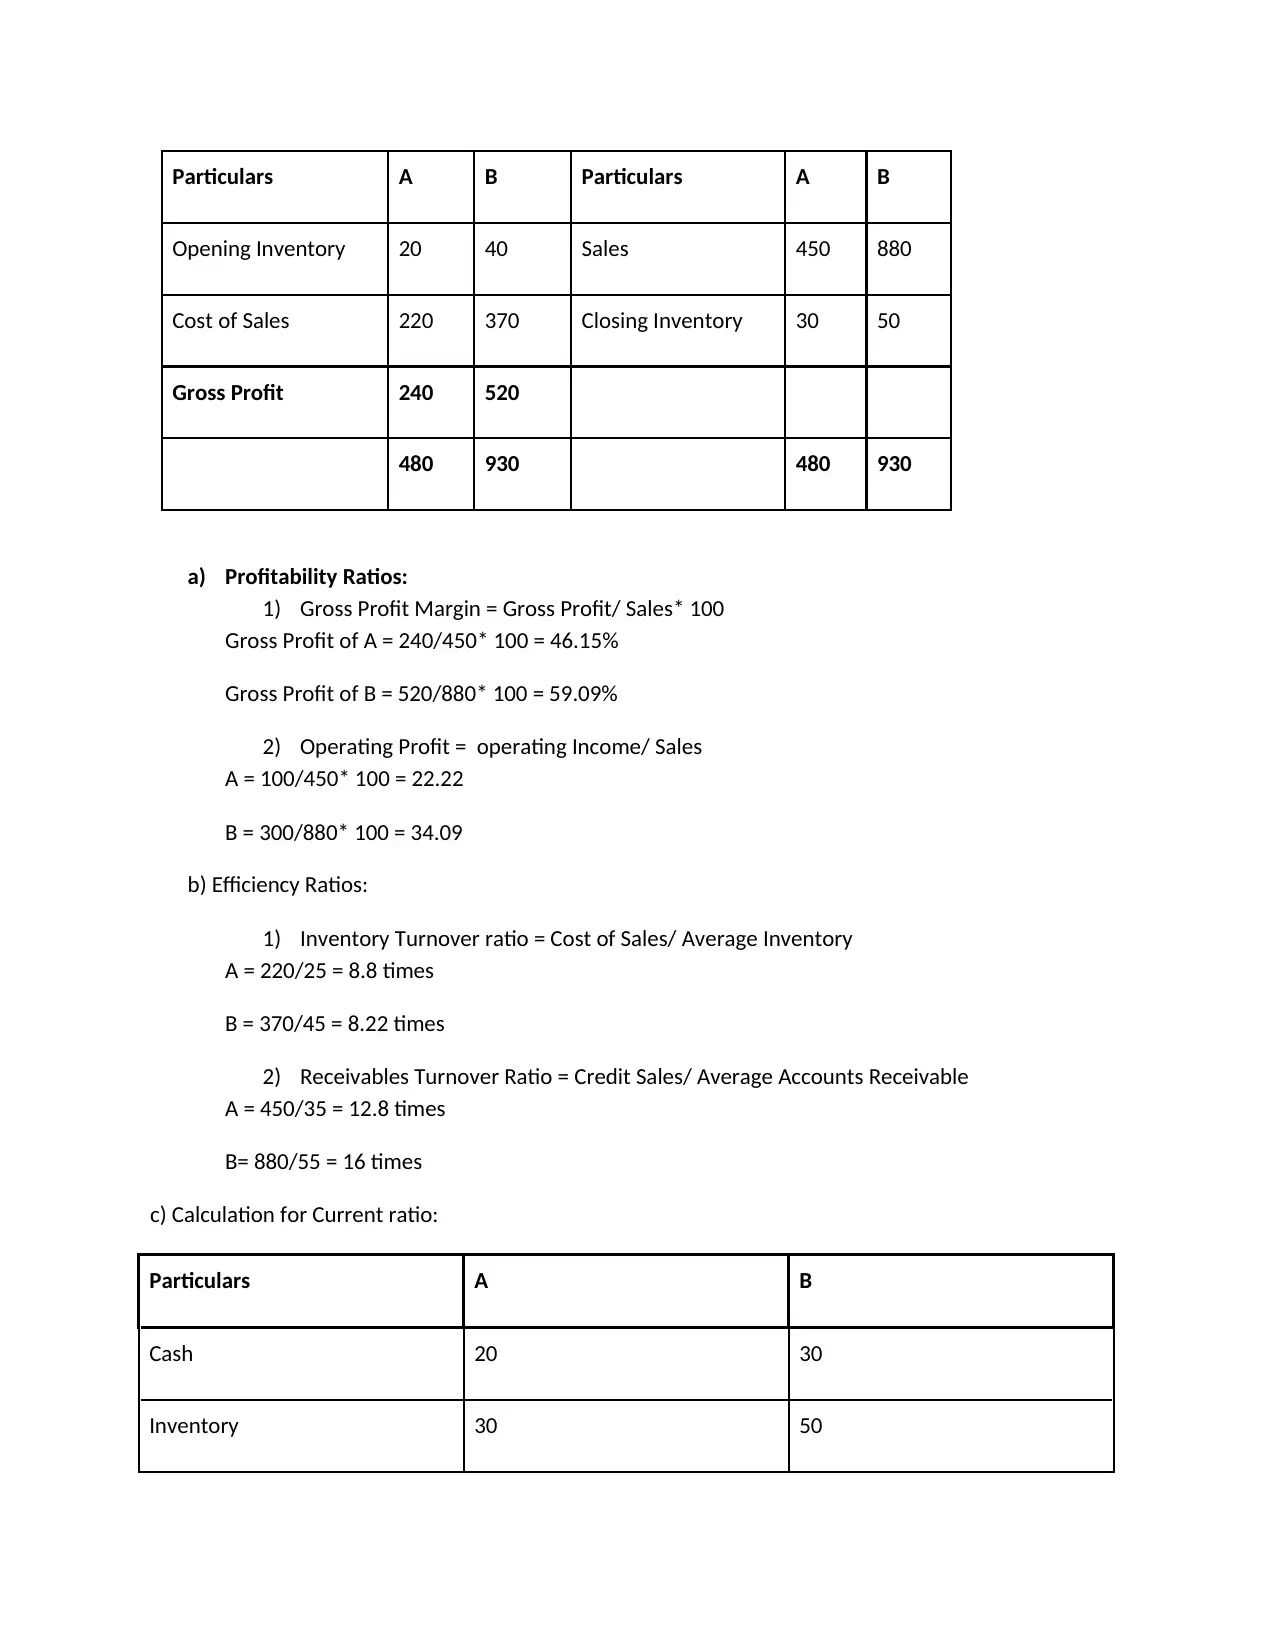
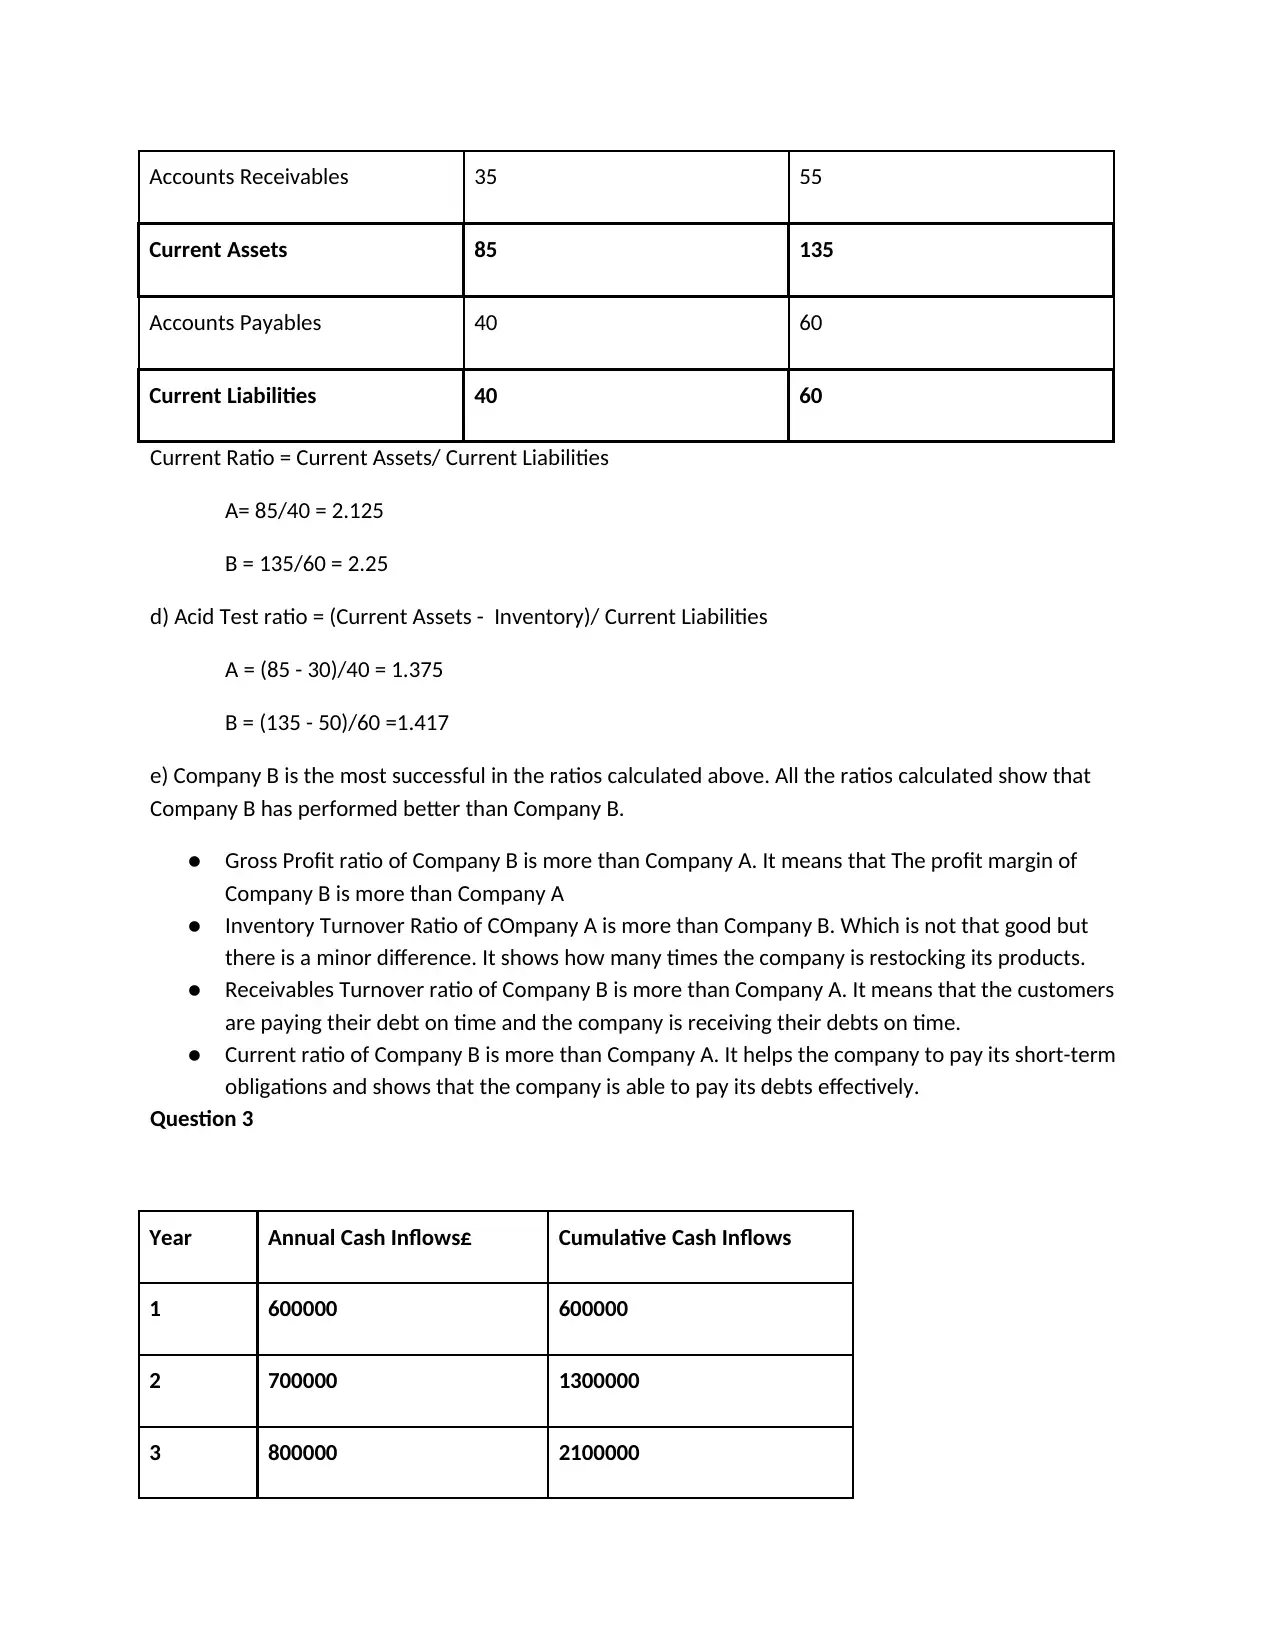
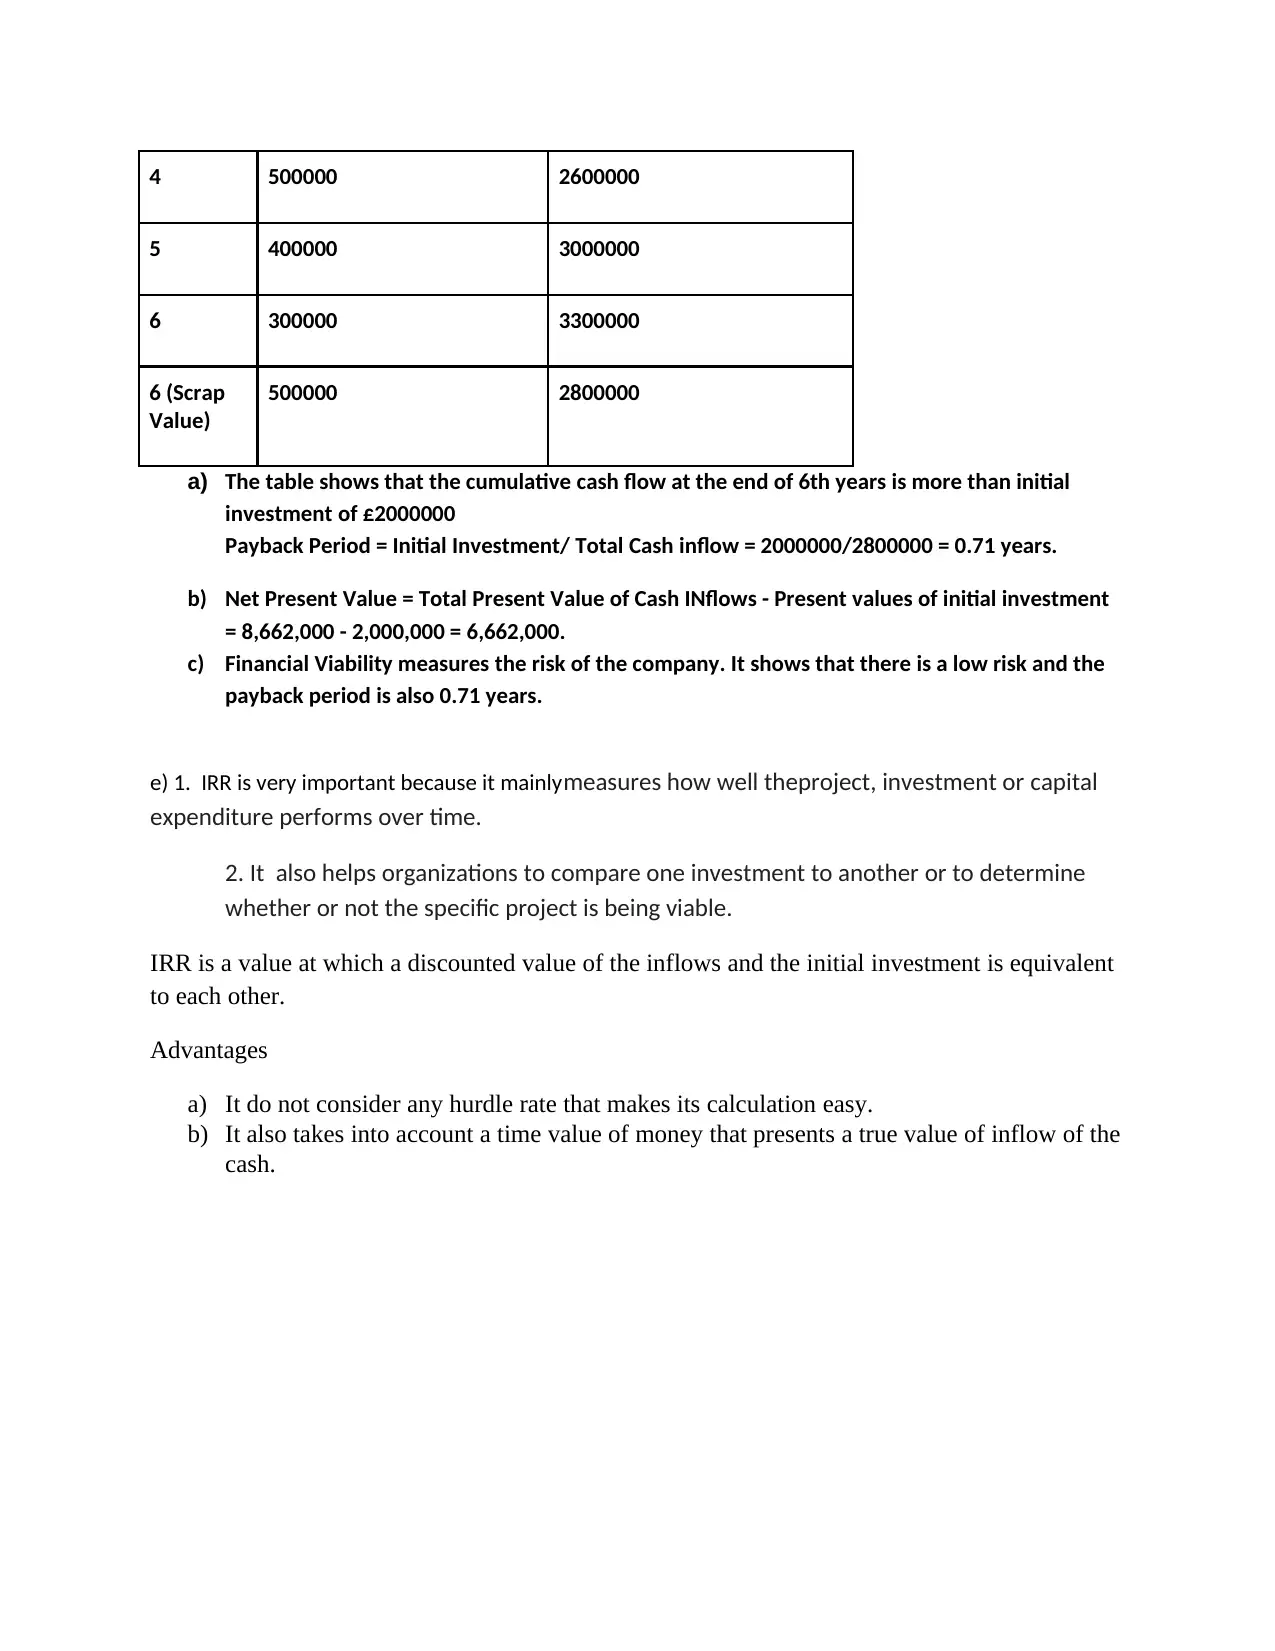
This assignment solution provides a detailed analysis of financial statements, including the preparation of an income statement and statement of financial position (SOFP). It covers the calculation and interpretation of profitability and efficiency ratios, such as gross profit margin, operating profit margin, inventory turnover, and receivables turnover. Furthermore, the solution includes a current ratio and acid-test ratio assessment for Companies A and B, determining Company B to be more successful based on these metrics. The assignment also addresses investment appraisal by calculating the payback period and net present value (NPV) for a project, concluding with an explanation of the importance and advantages of the internal rate of return (IRR). Desklib offers a wide range of solved assignments and past papers to support students in their studies.
Document Page
Online Exam
tabler-icon-diamond-filled.svg

Paraphrase This Document

Need a fresh take? Get an instant paraphrase of this document with our AI Paraphraser
Document Page
SECTION A
Income Statement for the year ended 31/12/2020 (£000)
Sales 20000
Cost of sales
Opening inventory 2000
Purchases 15200
Closing inventory (2500) (14700)
Gross Profit 5300
Expenses
Selling expenses 700
Administration cost (400-100) 300
Audit fee (70 +200) 270
Debenture interest (60+200) 260
Distribution expenses 200
Salaries (900 + 300) 1200
Depreciation of machinery (3000 – 500) x 0.2 500
Depreciation of buildings (2400 x 0.05) 120
Directors’ remuneration 300
Bad debt 30 (3880)
Profit Before Tax 1420
CT (200)
Profit After Tax 1220
Dividends – Interim paid 50
- Final proposed (8000 x £0.03) 240 (290)
Retained profit for the year 930
Retained profit b/f 1390
Retained profit c/f 2320
b)
SOFP as at 31/12/2020 (in £000s)
Document Page
Non – current assets Cost Accumulated
Depreciation
NBV
Freehold premises 6000 ---- 6000
Building 120 2400 400 + 120 = 520 1880
Machinery 500 3000 500 + 500 = 1000 2000
11,400 1520 9880
Current assets
Inventory 2500
Receivables 1400
Prepayment 100
Bank 130
Cash 50 4180
Total assets 14060
Share capital
£1 Ordinary shares 8000
Reserves
Retained profit 2320
Shareholders’ funds 10320
Non- current liabilities
5% Debentures 1600
Current liabilities
Accruals (30+20+20) 70
Payables 1000
CT 200
Proposed dividend 240 1510
Shareholders’ funds & liabilities 14060
SECTION 2
Question 2
Document Page
Particulars A B Particulars A B
Opening Inventory 20 40 Sales 450 880
Cost of Sales 220 370 Closing Inventory 30 50
Gross Profit 240 520
480 930 480 930
a) Profitability Ratios:
1) Gross Profit Margin = Gross Profit/ Sales* 100
Gross Profit of A = 240/450* 100 = 46.15%
Gross Profit of B = 520/880* 100 = 59.09%
2) Operating Profit = operating Income/ Sales
A = 100/450* 100 = 22.22
B = 300/880* 100 = 34.09
b) Efficiency Ratios:
1) Inventory Turnover ratio = Cost of Sales/ Average Inventory
A = 220/25 = 8.8 times
B = 370/45 = 8.22 times
2) Receivables Turnover Ratio = Credit Sales/ Average Accounts Receivable
A = 450/35 = 12.8 times
B= 880/55 = 16 times
c) Calculation for Current ratio:
Particulars A B
Cash 20 30
Inventory 30 50
tabler-icon-diamond-filled.svg

Paraphrase This Document

Need a fresh take? Get an instant paraphrase of this document with our AI Paraphraser
Document Page
Accounts Receivables 35 55
Current Assets 85 135
Accounts Payables 40 60
Current Liabilities 40 60
Current Ratio = Current Assets/ Current Liabilities
A= 85/40 = 2.125
B = 135/60 = 2.25
d) Acid Test ratio = (Current Assets - Inventory)/ Current Liabilities
A = (85 - 30)/40 = 1.375
B = (135 - 50)/60 =1.417
e) Company B is the most successful in the ratios calculated above. All the ratios calculated show that
Company B has performed better than Company B.
Gross Profit ratio of Company B is more than Company A. It means that The profit margin of
Company B is more than Company A
Inventory Turnover Ratio of COmpany A is more than Company B. Which is not that good but
there is a minor difference. It shows how many times the company is restocking its products.
Receivables Turnover ratio of Company B is more than Company A. It means that the customers
are paying their debt on time and the company is receiving their debts on time.
Current ratio of Company B is more than Company A. It helps the company to pay its short-term
obligations and shows that the company is able to pay its debts effectively.
Question 3
Year Annual Cash Inflows£ Cumulative Cash Inflows
1 600000 600000
2 700000 1300000
3 800000 2100000
Document Page
4 500000 2600000
5 400000 3000000
6 300000 3300000
6 (Scrap
Value)
500000 2800000
a) The table shows that the cumulative cash flow at the end of 6th years is more than initial
investment of £2000000
Payback Period = Initial Investment/ Total Cash inflow = 2000000/2800000 = 0.71 years.
b) Net Present Value = Total Present Value of Cash INflows - Present values of initial investment
= 8,662,000 - 2,000,000 = 6,662,000.
c) Financial Viability measures the risk of the company. It shows that there is a low risk and the
payback period is also 0.71 years.
e) 1. IRR is very important because it mainlymeasures how well theproject, investment or capital
expenditure performs over time.
2. It also helps organizations to compare one investment to another or to determine
whether or not the specific project is being viable.
IRR is a value at which a discounted value of the inflows and the initial investment is equivalent
to each other.
Advantages
a) It do not consider any hurdle rate that makes its calculation easy.
b) It also takes into account a time value of money that presents a true value of inflow of the
cash.
chevron_up_icon
1 out of 6
circle_padding
hide_on_mobile
zoom_out_icon
[object Object]