INTI University FIN3234: Financial Statement Analysis of Berjaya Group
VerifiedAdded on 2023/01/17
|16
|2629
|92
Report
AI Summary
This report provides a detailed financial analysis of Berjaya Group Berhad, an investment holding company operating in Malaysia. The analysis covers factors influencing financial statement preparation, expectations of key users, and relevant industry and market factors. It includes a three-year financial analysis using profitability and working capital ratios, with comparisons to industry averages. The report examines the company's financing structure and concludes with a peer comparator analysis, contrasting Berjaya Group Berhad's performance with a competitor, YTL. The analysis reveals both strengths and weaknesses in Berjaya's financial performance, highlighting areas for improvement. The report concludes by summarizing the key findings and offering insights into the company's financial health.

ANALYSING FINANCIAL STATEMENT 1
ANALYSING FINANCIAL STATEMENT
ANALYSING FINANCIAL STATEMENT
Paraphrase This Document
Need a fresh take? Get an instant paraphrase of this document with our AI Paraphraser
ANALYSING FINANCIAL STATEMENT 2
Contents
Company background:...............................................................................................................3
Factors that influence the preparation and presentation of financials:.......................................3
Expectation of key users:...........................................................................................................3
Industry specific and general market factors:............................................................................3
Financial analysis for 3 (THREE) years:...................................................................................4
Financing structure:....................................................................................................................5
Peer comparator analysis:..........................................................................................................6
Conclusion:................................................................................................................................6
References..................................................................................................................................7
Appendix:...................................................................................................................................9
ANALYSING FINANCIAL STATEMENT 3
Company background:
The company undertaken for review is Berjaya Group Berhad which is an investment holding
company that provides the various financial services, property investment, management,
gaming and the lottery management along with the services like travel. Retail, hotel etc. the
earlier name of the company was Inter Pacific Industrial Group Berhad, Berjaya Group
Berhad, which came into existence in the year 1967. The company is situated in Kuala
Lumpur, Malaysia. The company is the subsidiary of Berjaya Corporation (Bloomberg,
2019).
Factors that influence the preparation and presentation of financials:
For the purposes of presenting the financial statements of the company, the company needs to
select and apply the relevant policies of accounting as per the rules of IAS 38. The company
also should follow the complete disclosure policy and must follow the rules such as the going
concern which means that all of the financials of the company should be prepared following
the assumption that the company would have a foreseeable future (Ready ratios, 2019).
Further, the company must record all of its financials in the period in which these take place
and these financials should be prepared by following the similar accounting rules so that
comparison is possible (MCA, 2019).
Expectation of key users:
Each user would want to invest in the company which has been earning profits and which has
a bright future in terms of profitability. For the purposes of making that assessment, he would
require that the relevant facts and figures be contained in the financials so that they can take
apt decision.
⊘ This is a preview!⊘
Do you want full access?
Subscribe today to unlock all pages.
Trusted by 1+ million students worldwide
ANALYSING FINANCIAL STATEMENT 4
Like vendor need to know if the company is able to repay its debt along with the amount of
the interest as and when it becomes due. Government would want to know if the company is
paying the adequate and the apt amount of the taxes. For an investor, he would want to know
the profitability of the company.
Industry specific and general market factors:
The company undertaken for review belongs to the industry of Conglomerates which is
expected to face certain issues in the coming years due to the transfer of the management
control that leads to some of the specific changes that must not be underestimated. There are
certain industry factors such as the maintenance of the control over the business operations.
Due to the reason that the shareholders face an issue with the ownership structure due to the
centralised operations and if these operations are decentralised, then that would become
problematic. Factors like these increases the pressure on the business. These companies are
expected to grow at the rate of 18% for the purposes of maintaining the level of wealth
through the generations. These companies follow the evolutionary process through the 3
phases. These companies also have bene facing a stiff competition from the other companies
and also facing issues due to the need to expand in the foreign markets. There are challenges
for these companies when it comes to the establishment of the strategic alliances and the joint
ventures. But these companies have the advantage of basing their knowledge which is much
better than the knowledge of the local market when compared with the foreign companies.
But there are many institutional and market failures that these companies are exposed to. The
other factors include finding the skilled workforce, lack of the infrastructure, lack of
knowledge of the local customs etc. (KURTOVIĆ, 2013).
In terms of political stability, Malaysia has a parliamentary democracy with the constitutional
monarch. The economy of the country along with the political stability ensures that there are
Paraphrase This Document
Need a fresh take? Get an instant paraphrase of this document with our AI Paraphraser
ANALYSING FINANCIAL STATEMENT 5
more businesses that would want to do business in it. The main attraction to the investors in
this is all about the political stability within the country.
In terms of economic scenario, the company needs to make sure about the purchasing power
of the customers and the way in which the products could be sold to them. The company
undertaken for review considers these factors and also considers the interest, exchange and
the inflation rate of the country.
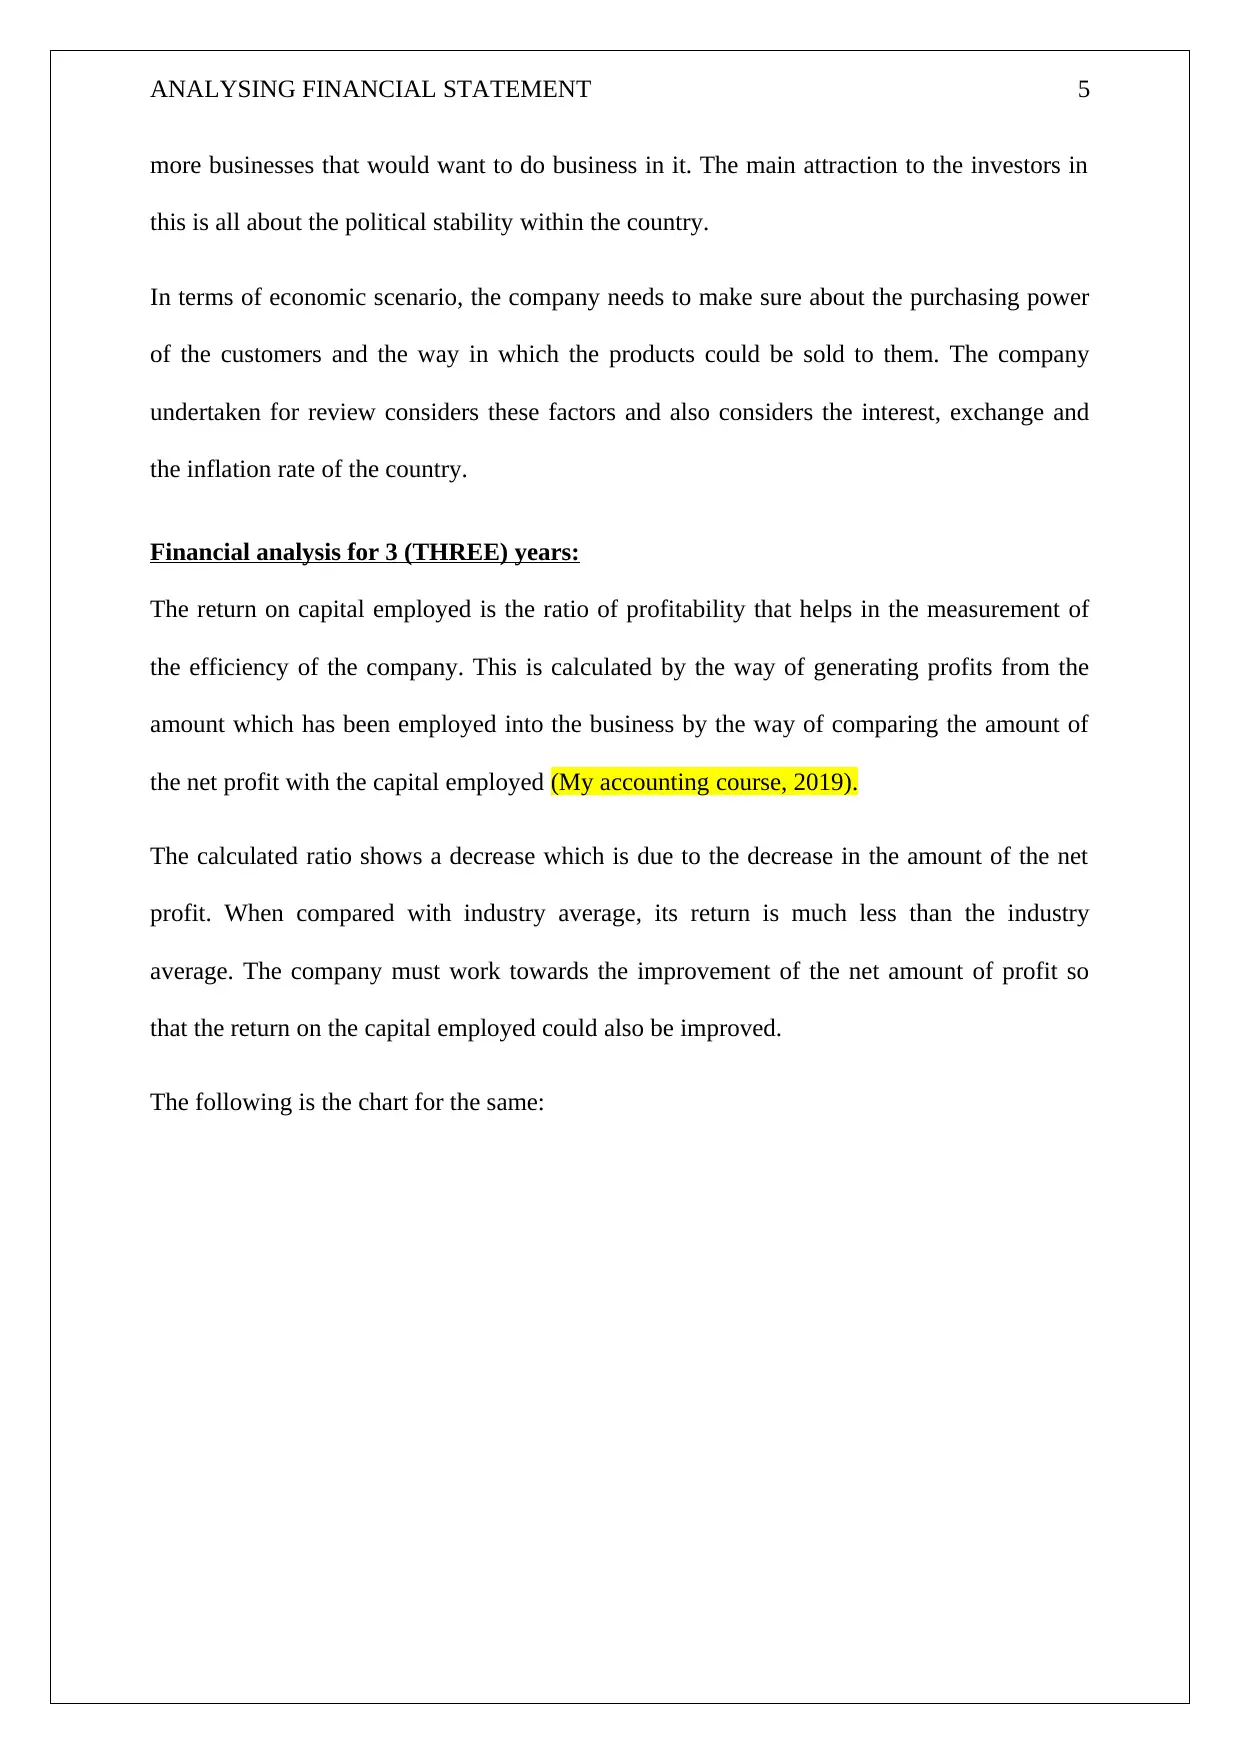
Financial analysis for 3 (THREE) years:
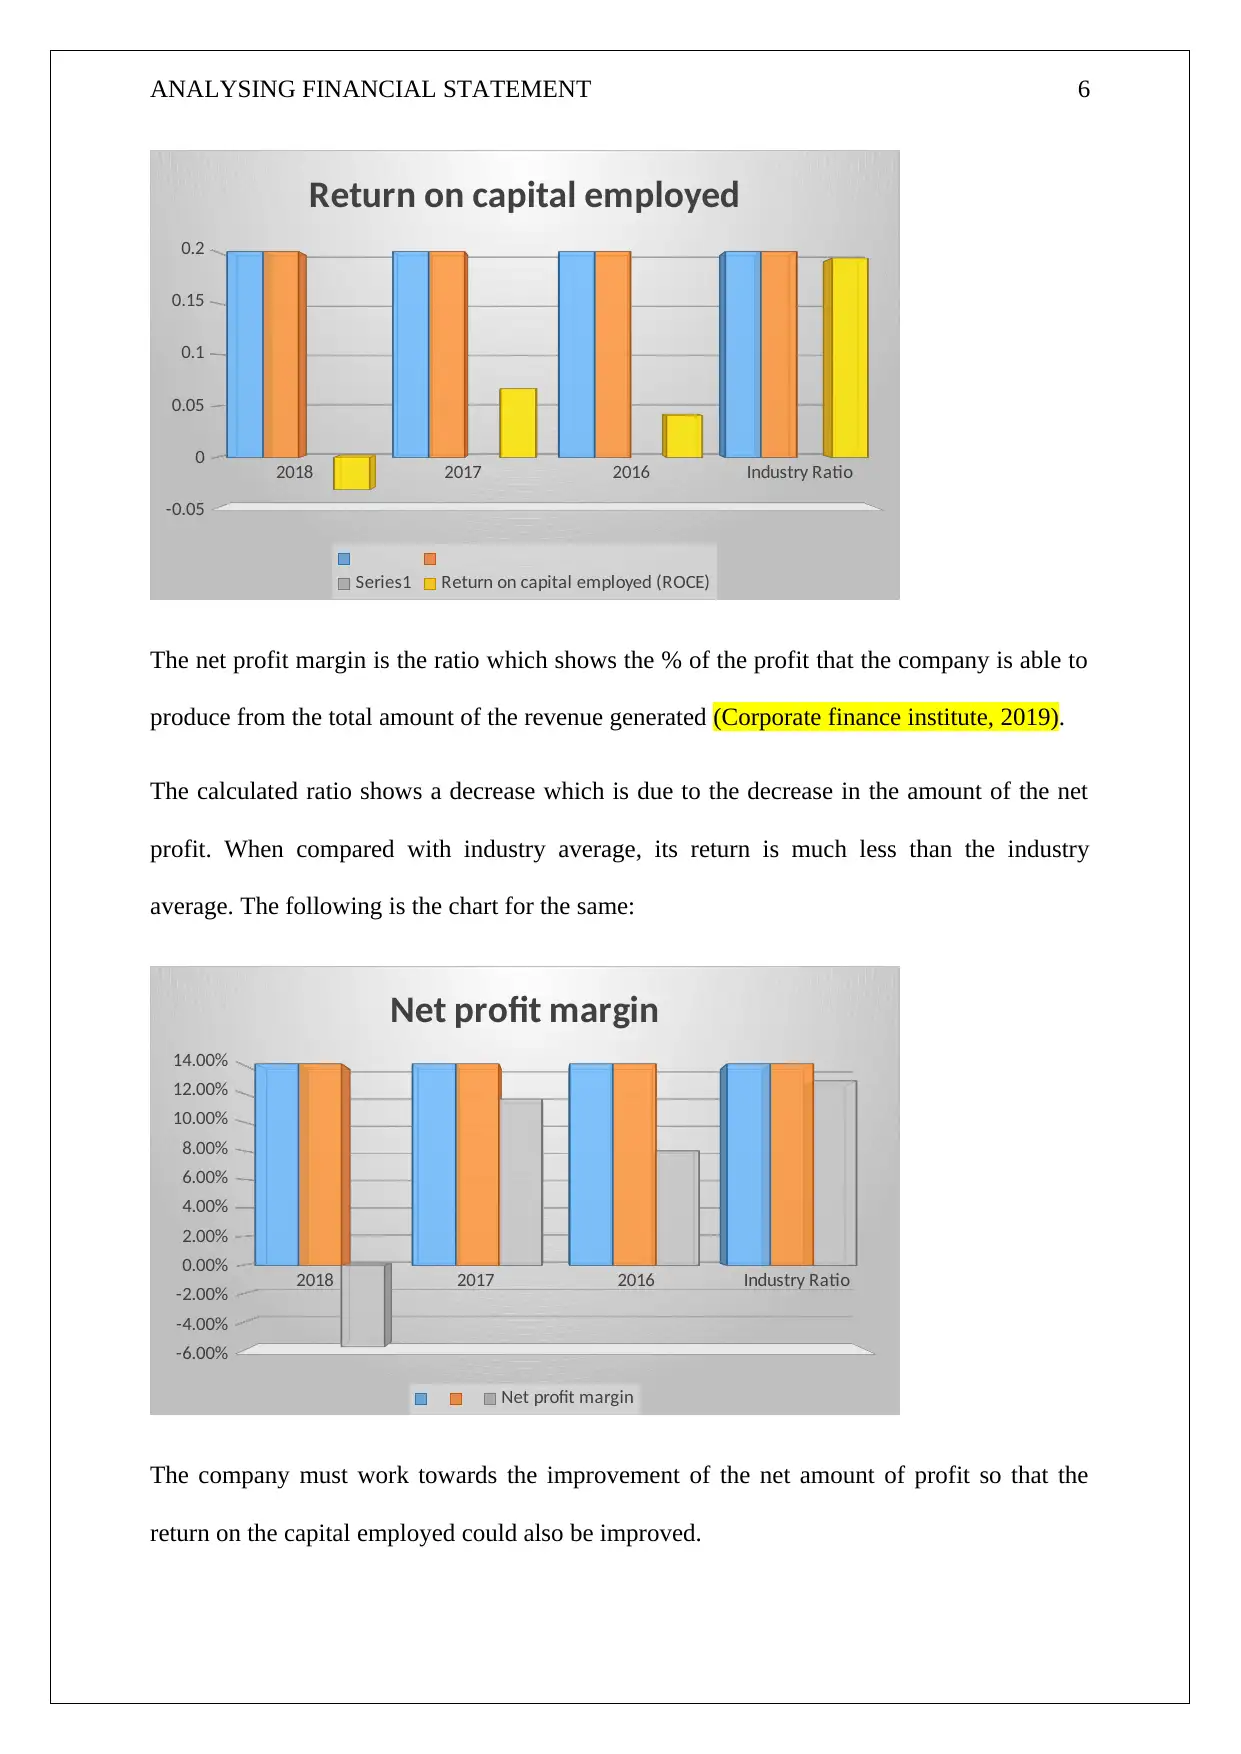
The return on capital employed is the ratio of profitability that helps in the measurement of
the efficiency of the company. This is calculated by the way of generating profits from the
amount which has been employed into the business by the way of comparing the amount of
the net profit with the capital employed (My accounting course, 2019).
The calculated ratio shows a decrease which is due to the decrease in the amount of the net
profit. When compared with industry average, its return is much less than the industry
average. The company must work towards the improvement of the net amount of profit so
that the return on the capital employed could also be improved.
The following is the chart for the same:
more businesses that would want to do business in it. The main attraction to the investors in
this is all about the political stability within the country.
In terms of economic scenario, the company needs to make sure about the purchasing power
of the customers and the way in which the products could be sold to them. The company
undertaken for review considers these factors and also considers the interest, exchange and
the inflation rate of the country.
Financial analysis for 3 (THREE) years:
The return on capital employed is the ratio of profitability that helps in the measurement of
the efficiency of the company. This is calculated by the way of generating profits from the
amount which has been employed into the business by the way of comparing the amount of
the net profit with the capital employed (My accounting course, 2019).
The calculated ratio shows a decrease which is due to the decrease in the amount of the net
profit. When compared with industry average, its return is much less than the industry
average. The company must work towards the improvement of the net amount of profit so
that the return on the capital employed could also be improved.
The following is the chart for the same:
ANALYSING FINANCIAL STATEMENT 6
2018 2017 2016 Industry Ratio
-0.05
0
0.05
0.1
0.15
0.2
Return on capital employed
Series1 Return on capital employed (ROCE)
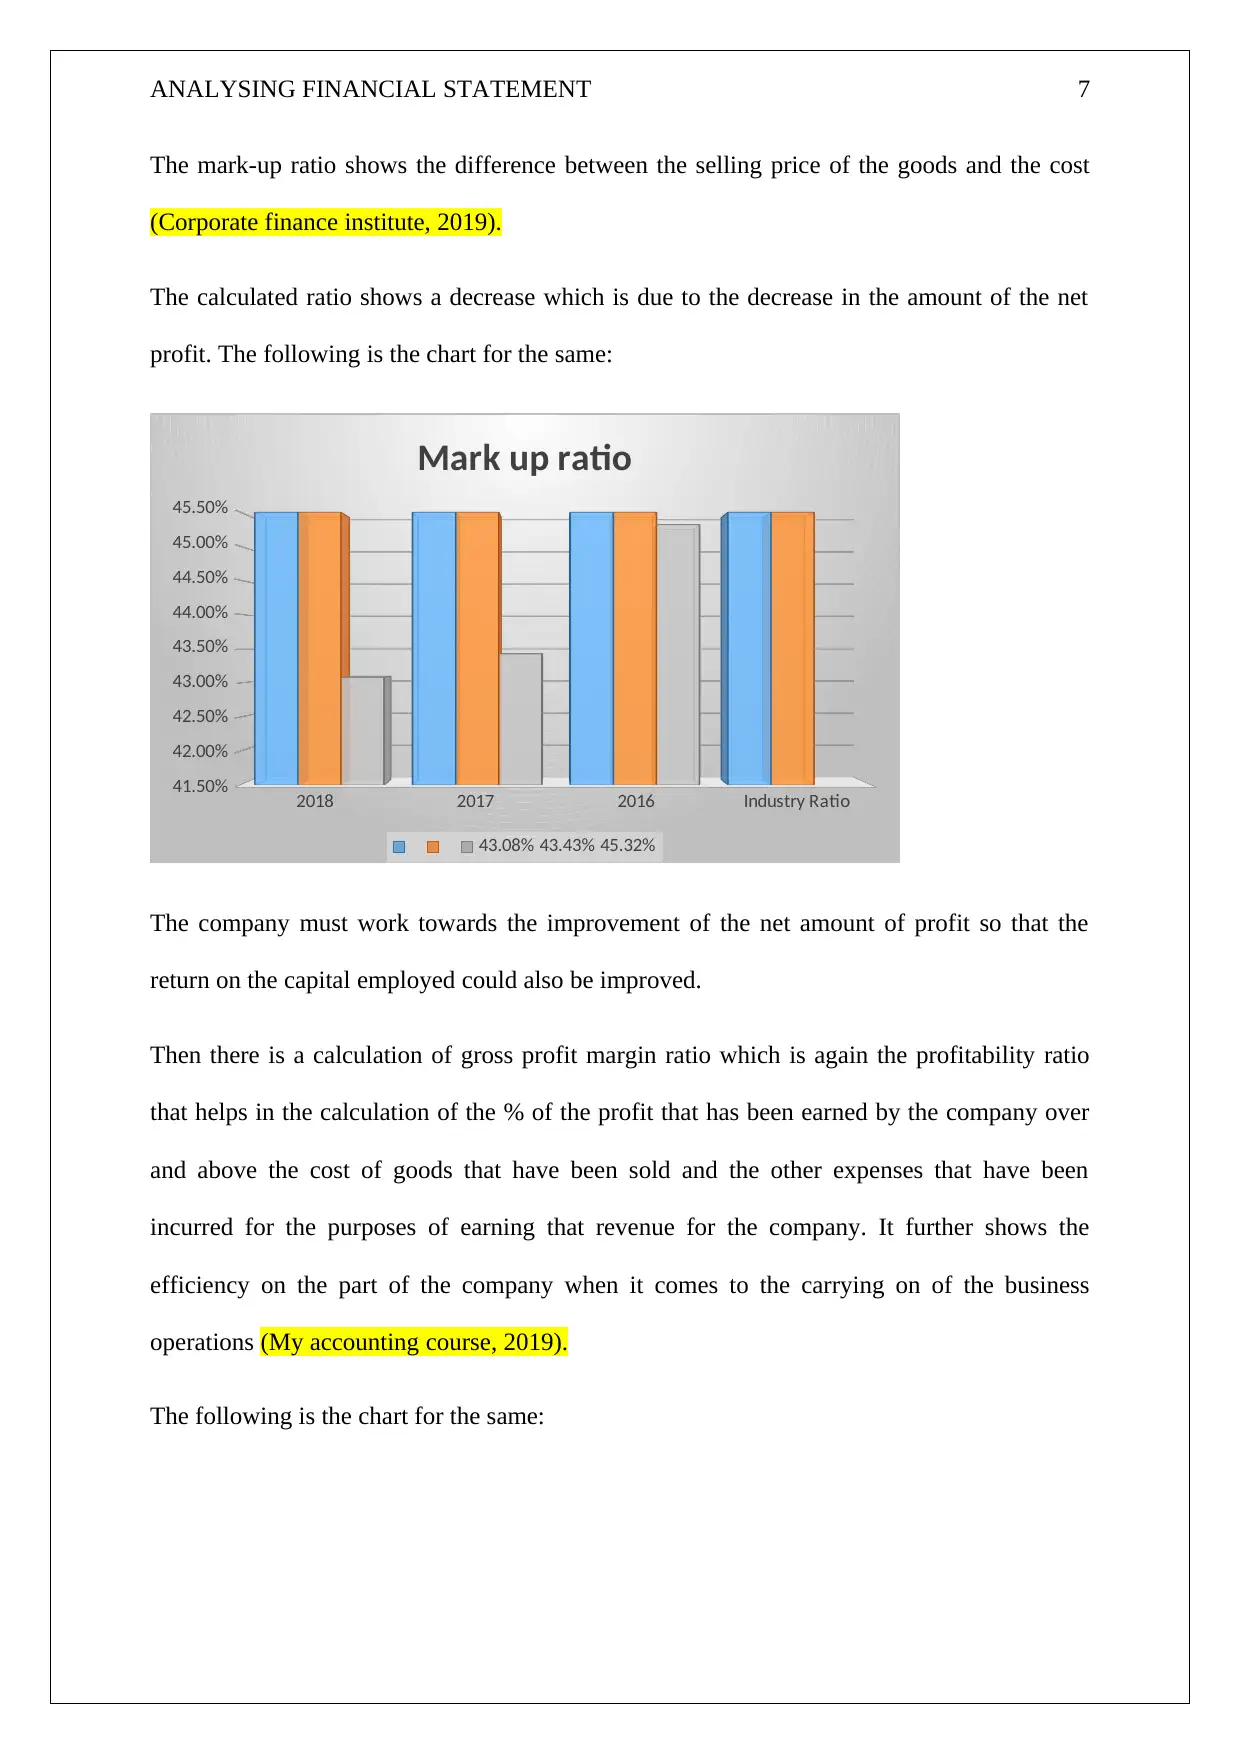
The net profit margin is the ratio which shows the % of the profit that the company is able to
produce from the total amount of the revenue generated (Corporate finance institute, 2019).
The calculated ratio shows a decrease which is due to the decrease in the amount of the net
profit. When compared with industry average, its return is much less than the industry
average. The following is the chart for the same:
2018 2017 2016 Industry Ratio
-6.00%
-4.00%
-2.00%
0.00%
2.00%
4.00%
6.00%
8.00%
10.00%
12.00%
14.00%
Net profit margin
Net profit margin
The company must work towards the improvement of the net amount of profit so that the
return on the capital employed could also be improved.
2018 2017 2016 Industry Ratio
-0.05
0
0.05
0.1
0.15
0.2
Return on capital employed
Series1 Return on capital employed (ROCE)
The net profit margin is the ratio which shows the % of the profit that the company is able to
produce from the total amount of the revenue generated (Corporate finance institute, 2019).
The calculated ratio shows a decrease which is due to the decrease in the amount of the net
profit. When compared with industry average, its return is much less than the industry
average. The following is the chart for the same:
2018 2017 2016 Industry Ratio
-6.00%
-4.00%
-2.00%
0.00%
2.00%
4.00%
6.00%
8.00%
10.00%
12.00%
14.00%
Net profit margin
Net profit margin
The company must work towards the improvement of the net amount of profit so that the
return on the capital employed could also be improved.
⊘ This is a preview!⊘
Do you want full access?
Subscribe today to unlock all pages.
Trusted by 1+ million students worldwide
ANALYSING FINANCIAL STATEMENT 7
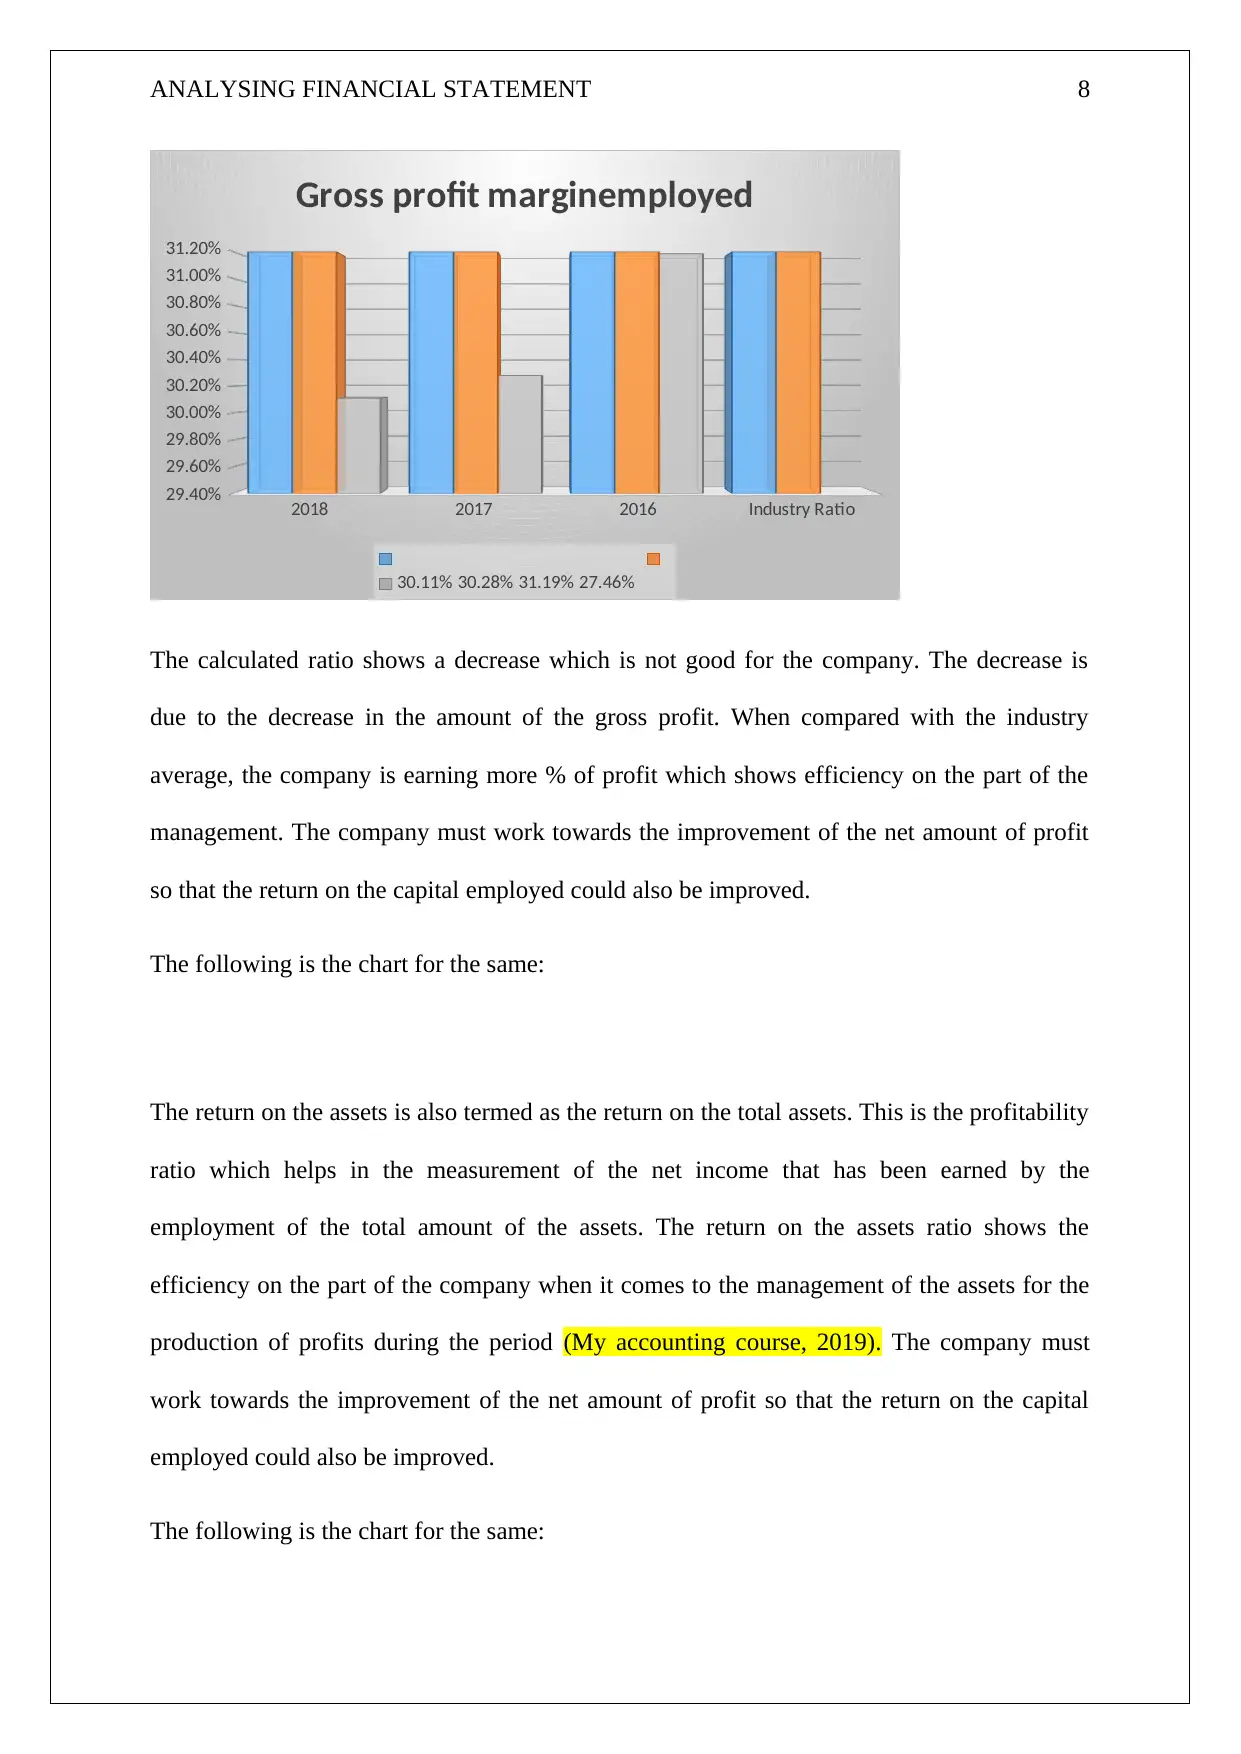
The mark-up ratio shows the difference between the selling price of the goods and the cost
(Corporate finance institute, 2019).
The calculated ratio shows a decrease which is due to the decrease in the amount of the net
profit. The following is the chart for the same:
2018 2017 2016 Industry Ratio
41.50%
42.00%
42.50%
43.00%
43.50%
44.00%
44.50%
45.00%
45.50%
Mark up ratio
43.08% 43.43% 45.32%
The company must work towards the improvement of the net amount of profit so that the
return on the capital employed could also be improved.
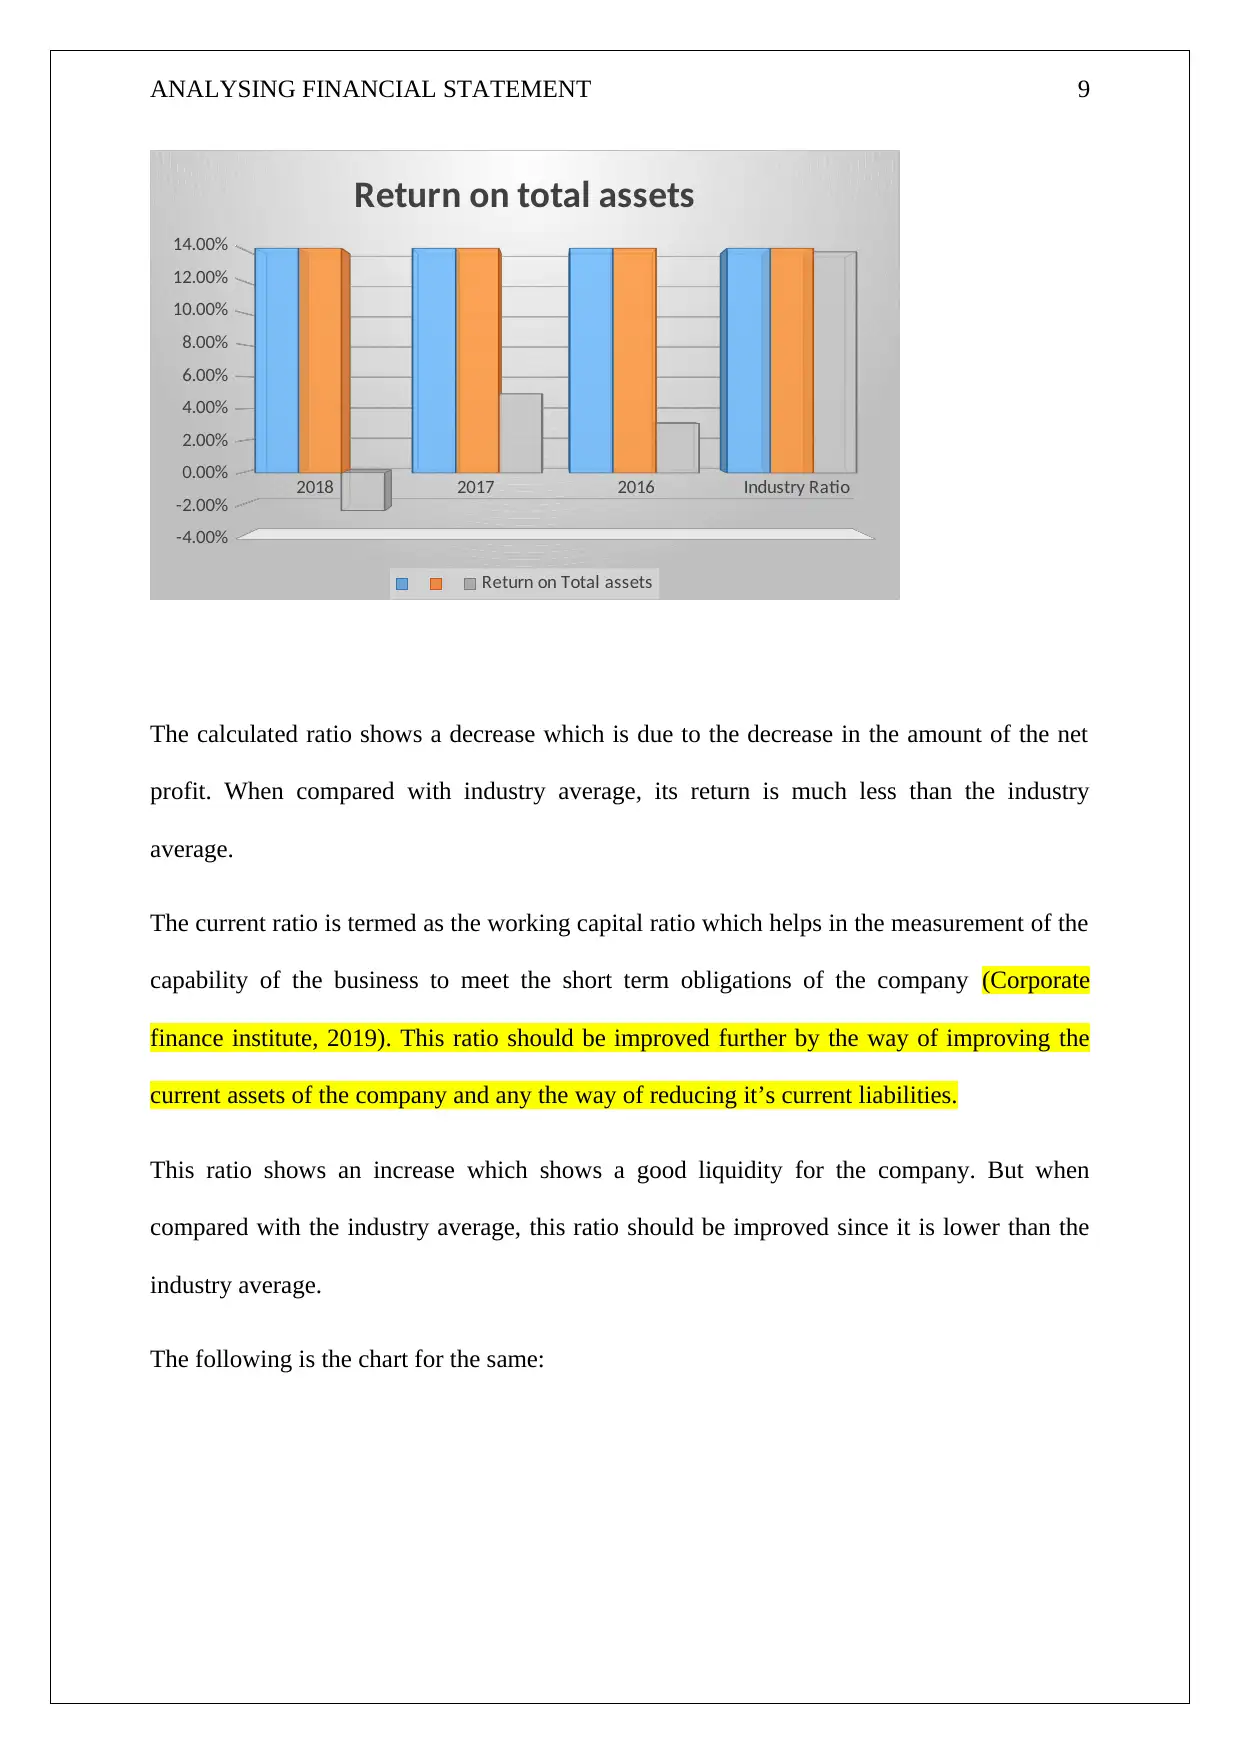
Then there is a calculation of gross profit margin ratio which is again the profitability ratio
that helps in the calculation of the % of the profit that has been earned by the company over
and above the cost of goods that have been sold and the other expenses that have been
incurred for the purposes of earning that revenue for the company. It further shows the
efficiency on the part of the company when it comes to the carrying on of the business
operations (My accounting course, 2019).
The following is the chart for the same:
The mark-up ratio shows the difference between the selling price of the goods and the cost
(Corporate finance institute, 2019).
The calculated ratio shows a decrease which is due to the decrease in the amount of the net
profit. The following is the chart for the same:
2018 2017 2016 Industry Ratio
41.50%
42.00%
42.50%
43.00%
43.50%
44.00%
44.50%
45.00%
45.50%
Mark up ratio
43.08% 43.43% 45.32%
The company must work towards the improvement of the net amount of profit so that the
return on the capital employed could also be improved.
Then there is a calculation of gross profit margin ratio which is again the profitability ratio
that helps in the calculation of the % of the profit that has been earned by the company over
and above the cost of goods that have been sold and the other expenses that have been
incurred for the purposes of earning that revenue for the company. It further shows the
efficiency on the part of the company when it comes to the carrying on of the business
operations (My accounting course, 2019).
The following is the chart for the same:
Paraphrase This Document
Need a fresh take? Get an instant paraphrase of this document with our AI Paraphraser
ANALYSING FINANCIAL STATEMENT 8
2018 2017 2016 Industry Ratio
29.40%
29.60%
29.80%
30.00%
30.20%
30.40%
30.60%
30.80%
31.00%
31.20%
Gross profit marginemployed
30.11% 30.28% 31.19% 27.46%
The calculated ratio shows a decrease which is not good for the company. The decrease is
due to the decrease in the amount of the gross profit. When compared with the industry
average, the company is earning more % of profit which shows efficiency on the part of the
management. The company must work towards the improvement of the net amount of profit
so that the return on the capital employed could also be improved.
The following is the chart for the same:
The return on the assets is also termed as the return on the total assets. This is the profitability
ratio which helps in the measurement of the net income that has been earned by the
employment of the total amount of the assets. The return on the assets ratio shows the
efficiency on the part of the company when it comes to the management of the assets for the
production of profits during the period (My accounting course, 2019). The company must
work towards the improvement of the net amount of profit so that the return on the capital
employed could also be improved.
The following is the chart for the same:
ANALYSING FINANCIAL STATEMENT 9
2018 2017 2016 Industry Ratio
-4.00%
-2.00%
0.00%
2.00%
4.00%
6.00%
8.00%
10.00%
12.00%
14.00%
Return on total assets
Return on Total assets
The calculated ratio shows a decrease which is due to the decrease in the amount of the net
profit. When compared with industry average, its return is much less than the industry
average.
The current ratio is termed as the working capital ratio which helps in the measurement of the
capability of the business to meet the short term obligations of the company (Corporate
finance institute, 2019). This ratio should be improved further by the way of improving the
current assets of the company and any the way of reducing it’s current liabilities.
This ratio shows an increase which shows a good liquidity for the company. But when
compared with the industry average, this ratio should be improved since it is lower than the
industry average.
The following is the chart for the same:
⊘ This is a preview!⊘
Do you want full access?
Subscribe today to unlock all pages.
Trusted by 1+ million students worldwide
ANALYSING FINANCIAL STATEMENT 10
2018 2017 2016 Industry Ratio
0
0.5
1
1.5
2
2.5
Current ratio
Current ratio (1 : 1)
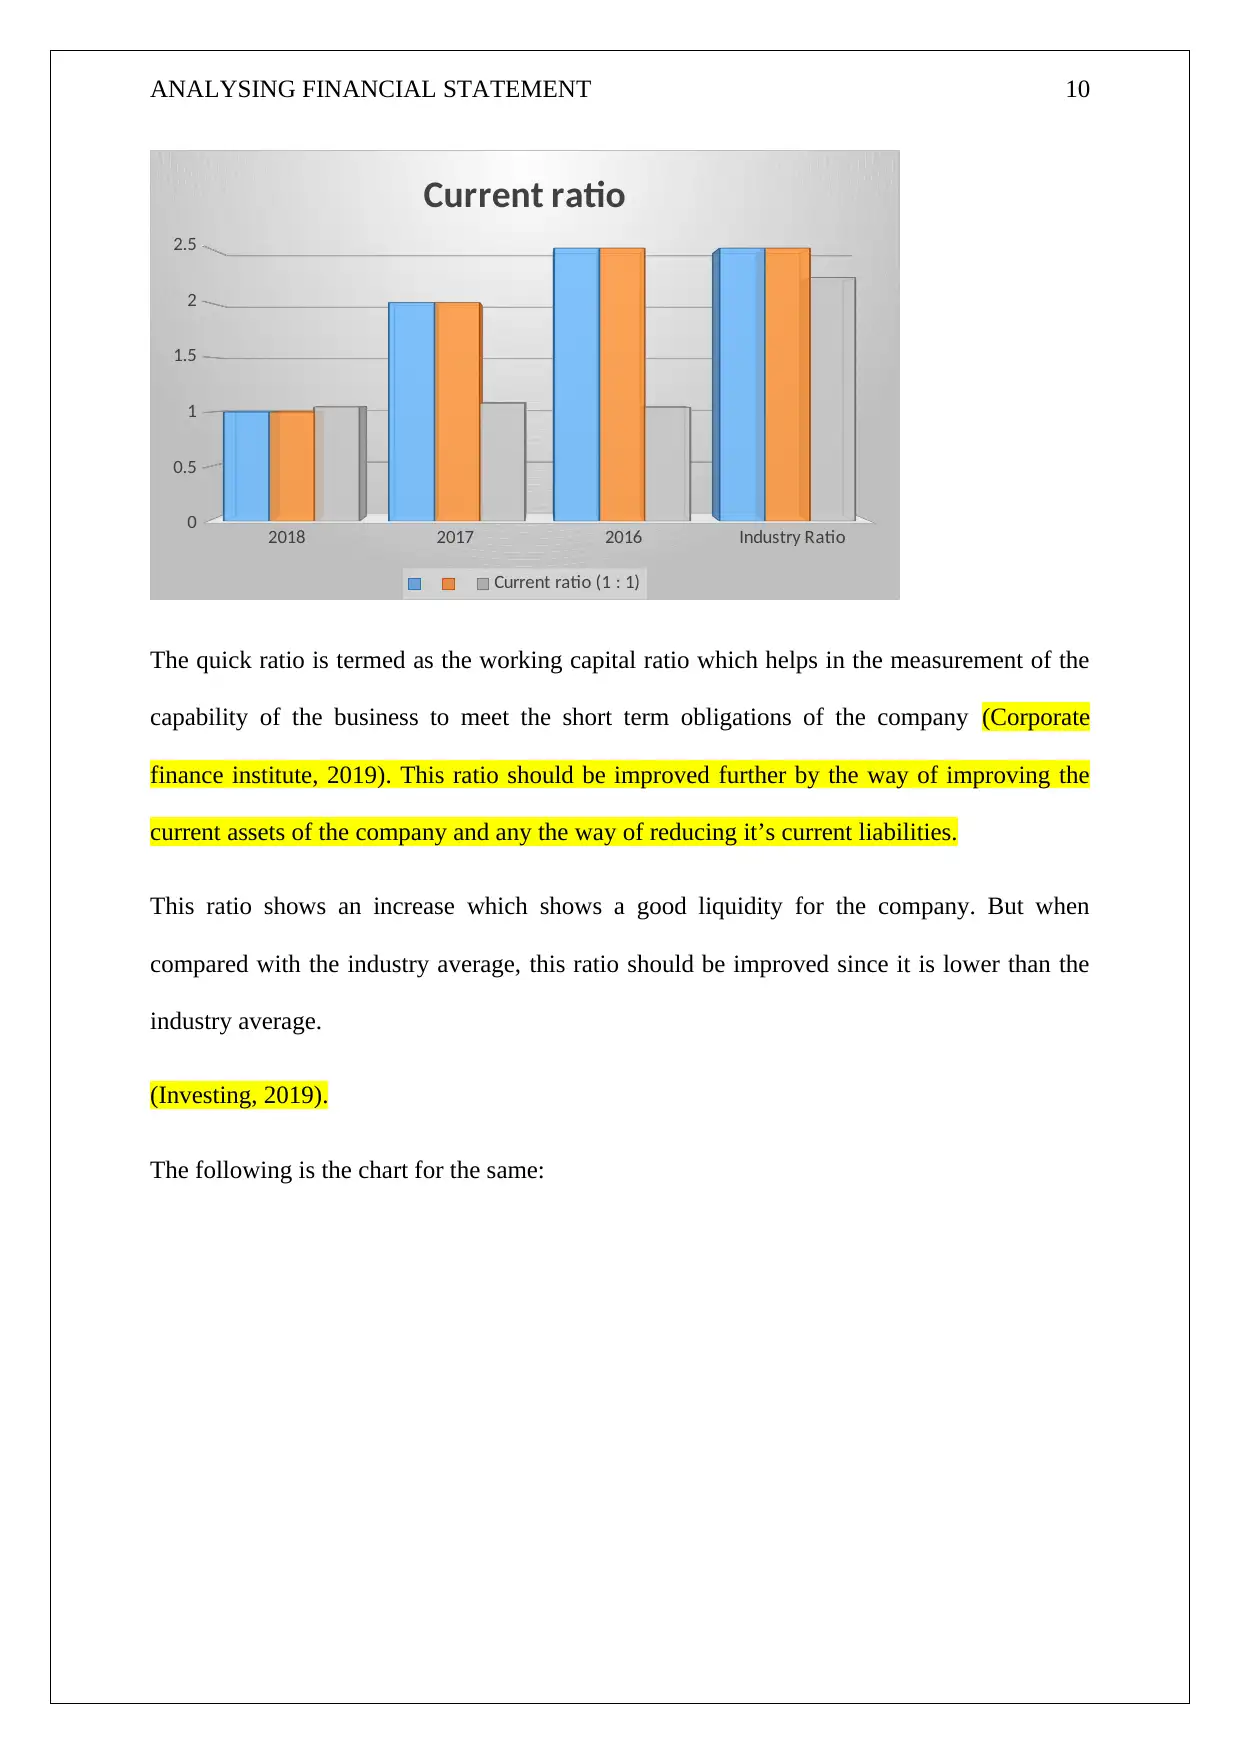
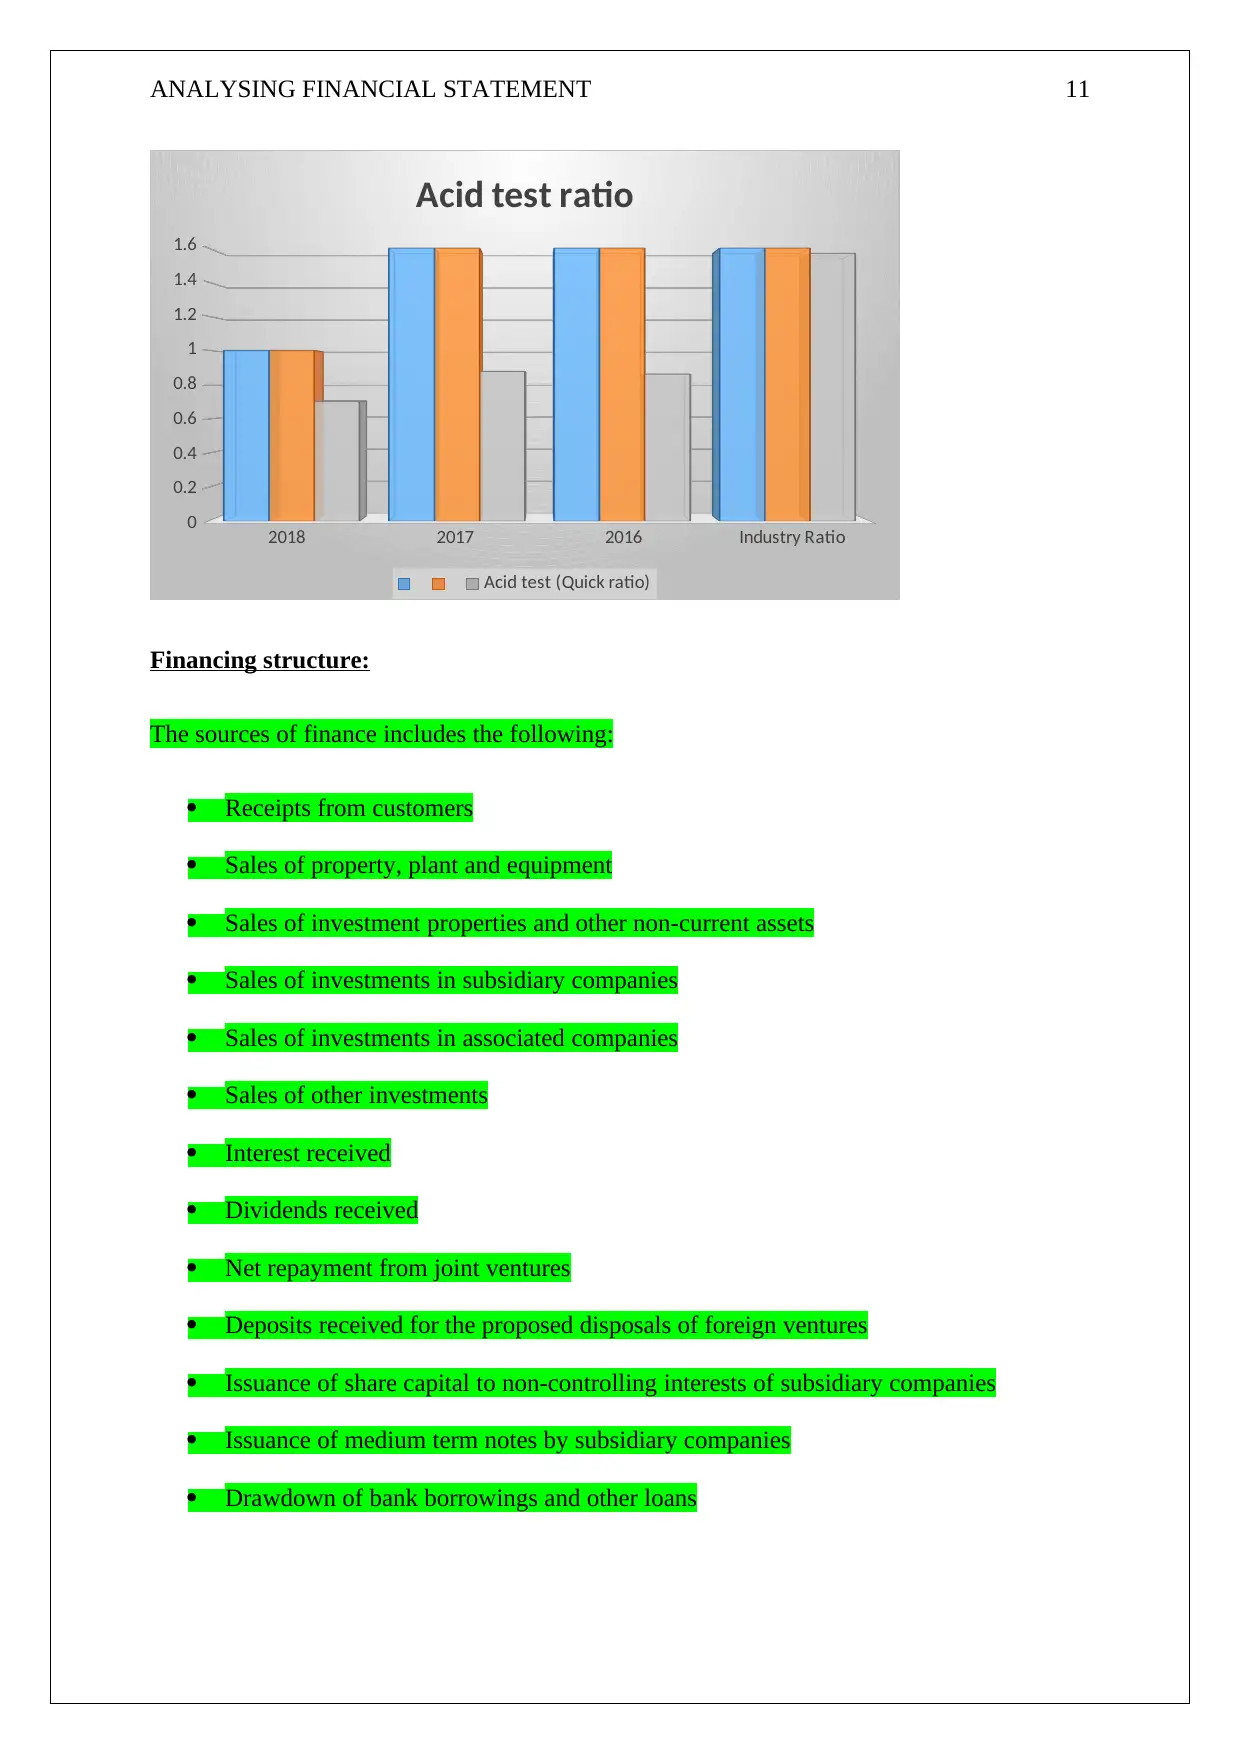
The quick ratio is termed as the working capital ratio which helps in the measurement of the
capability of the business to meet the short term obligations of the company (Corporate
finance institute, 2019). This ratio should be improved further by the way of improving the
current assets of the company and any the way of reducing it’s current liabilities.
This ratio shows an increase which shows a good liquidity for the company. But when
compared with the industry average, this ratio should be improved since it is lower than the
industry average.
(Investing, 2019).
The following is the chart for the same:
2018 2017 2016 Industry Ratio
0
0.5
1
1.5
2
2.5
Current ratio
Current ratio (1 : 1)
The quick ratio is termed as the working capital ratio which helps in the measurement of the
capability of the business to meet the short term obligations of the company (Corporate
finance institute, 2019). This ratio should be improved further by the way of improving the
current assets of the company and any the way of reducing it’s current liabilities.
This ratio shows an increase which shows a good liquidity for the company. But when
compared with the industry average, this ratio should be improved since it is lower than the
industry average.
(Investing, 2019).
The following is the chart for the same:
Paraphrase This Document
Need a fresh take? Get an instant paraphrase of this document with our AI Paraphraser
ANALYSING FINANCIAL STATEMENT 11
2018 2017 2016 Industry Ratio
0
0.2
0.4
0.6
0.8
1
1.2
1.4
1.6
Acid test ratio
Acid test (Quick ratio)
Financing structure:
The sources of finance includes the following:
Receipts from customers
Sales of property, plant and equipment
Sales of investment properties and other non-current assets
Sales of investments in subsidiary companies
Sales of investments in associated companies
Sales of other investments
Interest received
Dividends received
Net repayment from joint ventures
Deposits received for the proposed disposals of foreign ventures
Issuance of share capital to non-controlling interests of subsidiary companies
Issuance of medium term notes by subsidiary companies
Drawdown of bank borrowings and other loans
ANALYSING FINANCIAL STATEMENT 12
Withdrawal from/(Placement in) banks as security pledged for borrowings (Annual
report, 2019).
Peer comparator analysis:
In respect of the peer analysis, the following are the points:
The return on the capital employed of the competitor company (YTL) is lower than
the return on capital employed of Berjaya Corporation.
The net profit margin of the competitor company (YTL) is lower than net profit
margin of Berjaya Corporation.
The mark up ratio of the competitor company (YTL) is higher than the mark up ratio
of Berjaya Corporation.
The gross profit ratio of the competitor company (YTL) is higher than the gross profit
ratio of Berjaya Corporation.
The return on total assets of the competitor company (YTL) is lower than the return
on total assets of Berjaya Corporation.
The current ratio of the competitor company (YTL) is lower than the current ratio of
Berjaya Corporation.
The acid test ratio of the competitor company (YTL) is lower than the acid test ratio
of Berjaya Corporation.
(YTL annual report, 2019).
Conclusion:
In the nutshell, the company undertaken for review has been performing badly when to
comes to its business operations. It needs to work hard for the purposes of improving its sales
revenue and also to reduce the amount of the expenses that it incurs for the purposes of
earning that revenue.
⊘ This is a preview!⊘
Do you want full access?
Subscribe today to unlock all pages.
Trusted by 1+ million students worldwide
1 out of 16
Related Documents


Your All-in-One AI-Powered Toolkit for Academic Success.
+13062052269
info@desklib.com
Available 24*7 on WhatsApp / Email
![[object Object]](/_next/static/media/star-bottom.7253800d.svg)
Unlock your academic potential
Copyright © 2020–2026 A2Z Services. All Rights Reserved. Developed and managed by ZUCOL.