Financial Statement Analysis for Business FIN 924 Assignment
VerifiedAdded on 2023/06/18
|11
|2229
|141
Homework Assignment
AI Summary
This document presents a solved assignment for the course FIN 924, Financial Statement Analysis for Business. It covers various aspects of financial analysis including the calculation of abnormal earnings growth, long-term growth rate, intrinsic value, effective tax rate, and free cash flow using different methods. The assignment also delves into the interpretation of financial ratios like P/E, P/B, and ROE, and their implications for a company's financial health. Furthermore, it analyzes the return on capital employed and return on net assets for Everest Ltd, evaluating the company's financial performance and competitive advantage based on provided data. The solution includes detailed calculations, explanations, and references to support the analysis.
Financial Statement Analysis
For Business FIN 924
For Business FIN 924
Paraphrase This Document
Need a fresh take? Get an instant paraphrase of this document with our AI Paraphraser
TABLE OF CONTENTS
QUESTION 1...................................................................................................................................3
A..................................................................................................................................................3
B..................................................................................................................................................3
C..................................................................................................................................................3
D..................................................................................................................................................3
QUESTION 2...................................................................................................................................4
a...................................................................................................................................................4
b...................................................................................................................................................4
c...................................................................................................................................................5
QUESTION 3...................................................................................................................................6
Calculation of free cash flow......................................................................................................6
QUESTION 4...................................................................................................................................7
a...................................................................................................................................................7
b...................................................................................................................................................7
c...................................................................................................................................................7
d...................................................................................................................................................8
e...................................................................................................................................................8
QUESTION 5...................................................................................................................................8
A..................................................................................................................................................8
B..................................................................................................................................................9
C..................................................................................................................................................9
D................................................................................................................................................10
E................................................................................................................................................10
REFERENCES..............................................................................................................................11
QUESTION 1
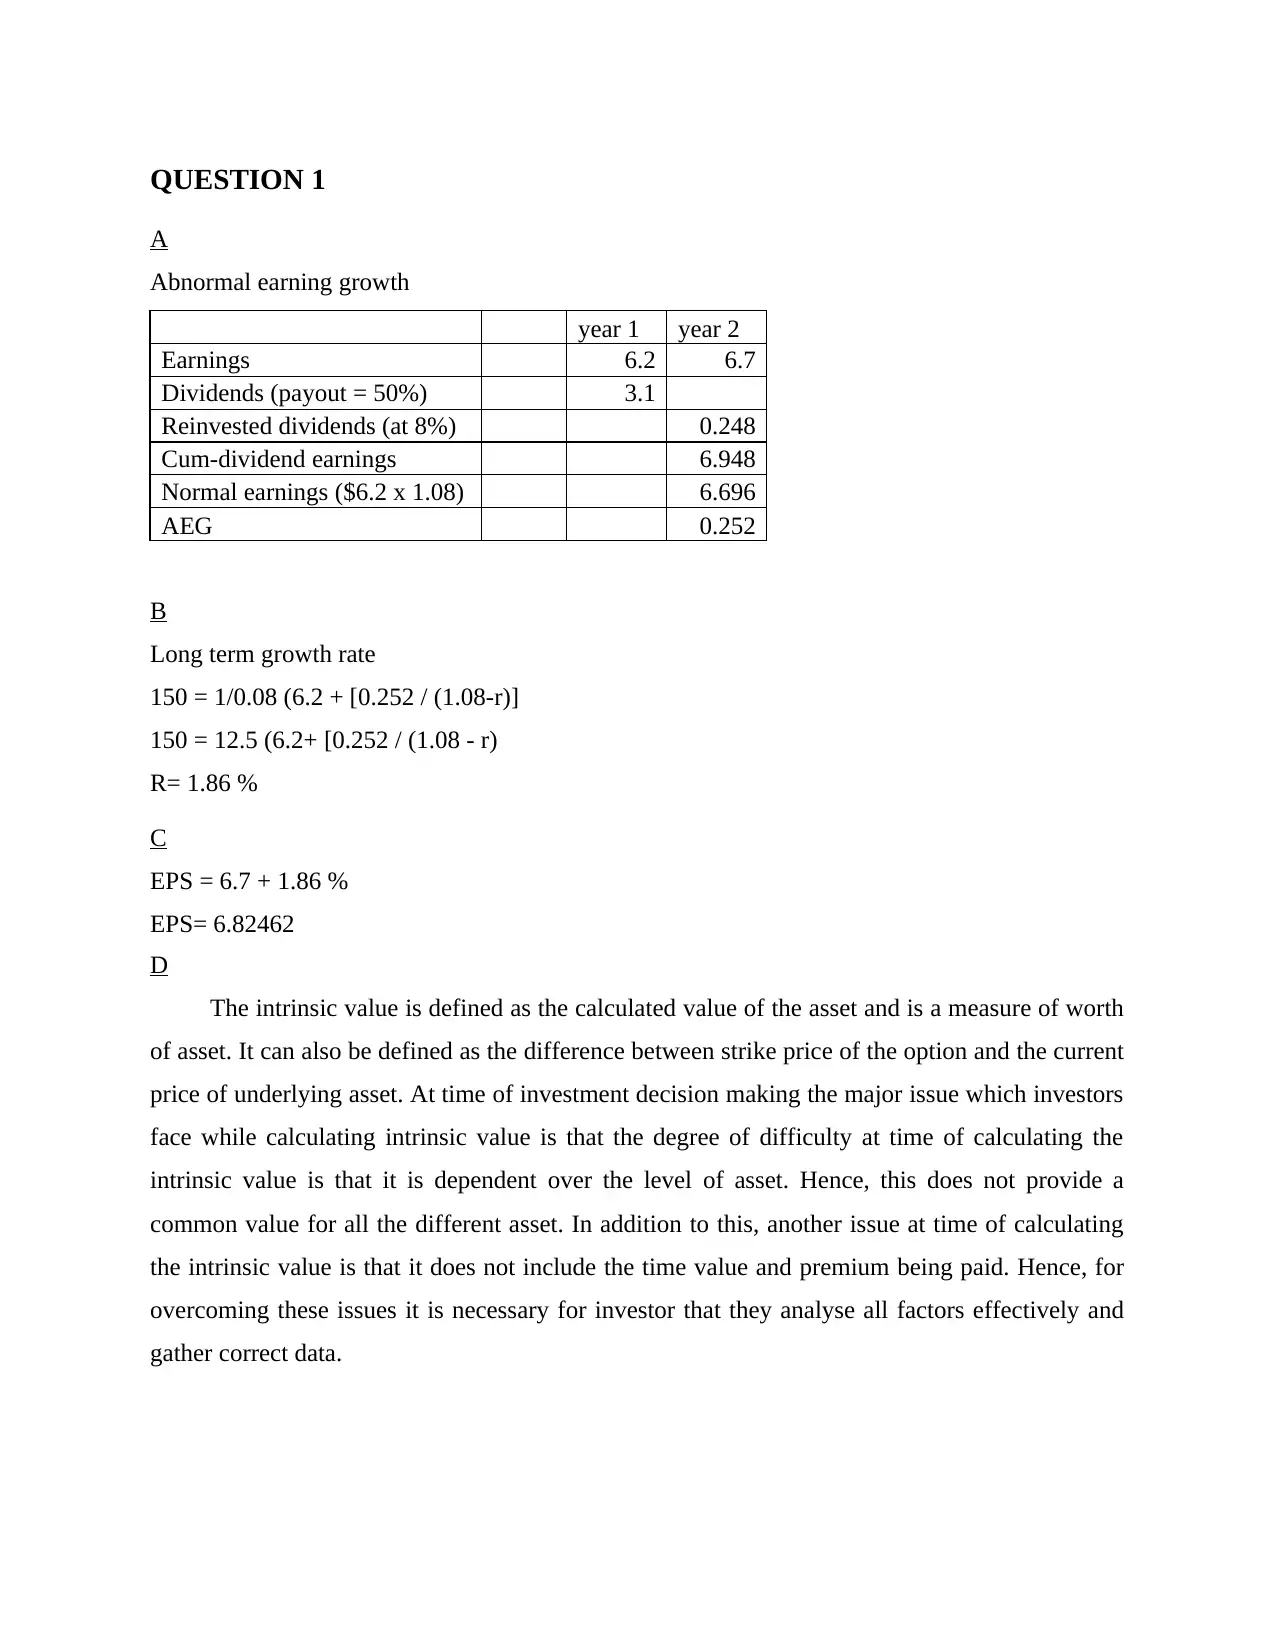
A
Abnormal earning growth
year 1 year 2
Earnings 6.2 6.7
Dividends (payout = 50%) 3.1
Reinvested dividends (at 8%) 0.248
Cum-dividend earnings 6.948
Normal earnings ($6.2 x 1.08) 6.696
AEG 0.252
B
Long term growth rate
150 = 1/0.08 (6.2 + [0.252 / (1.08-r)]
150 = 12.5 (6.2+ [0.252 / (1.08 - r)
R= 1.86 %
C
EPS = 6.7 + 1.86 %
EPS= 6.82462
D
The intrinsic value is defined as the calculated value of the asset and is a measure of worth
of asset. It can also be defined as the difference between strike price of the option and the current
price of underlying asset. At time of investment decision making the major issue which investors
face while calculating intrinsic value is that the degree of difficulty at time of calculating the
intrinsic value is that it is dependent over the level of asset. Hence, this does not provide a
common value for all the different asset. In addition to this, another issue at time of calculating
the intrinsic value is that it does not include the time value and premium being paid. Hence, for
overcoming these issues it is necessary for investor that they analyse all factors effectively and
gather correct data.
⊘ This is a preview!⊘
Do you want full access?
Subscribe today to unlock all pages.
Trusted by 1+ million students worldwide
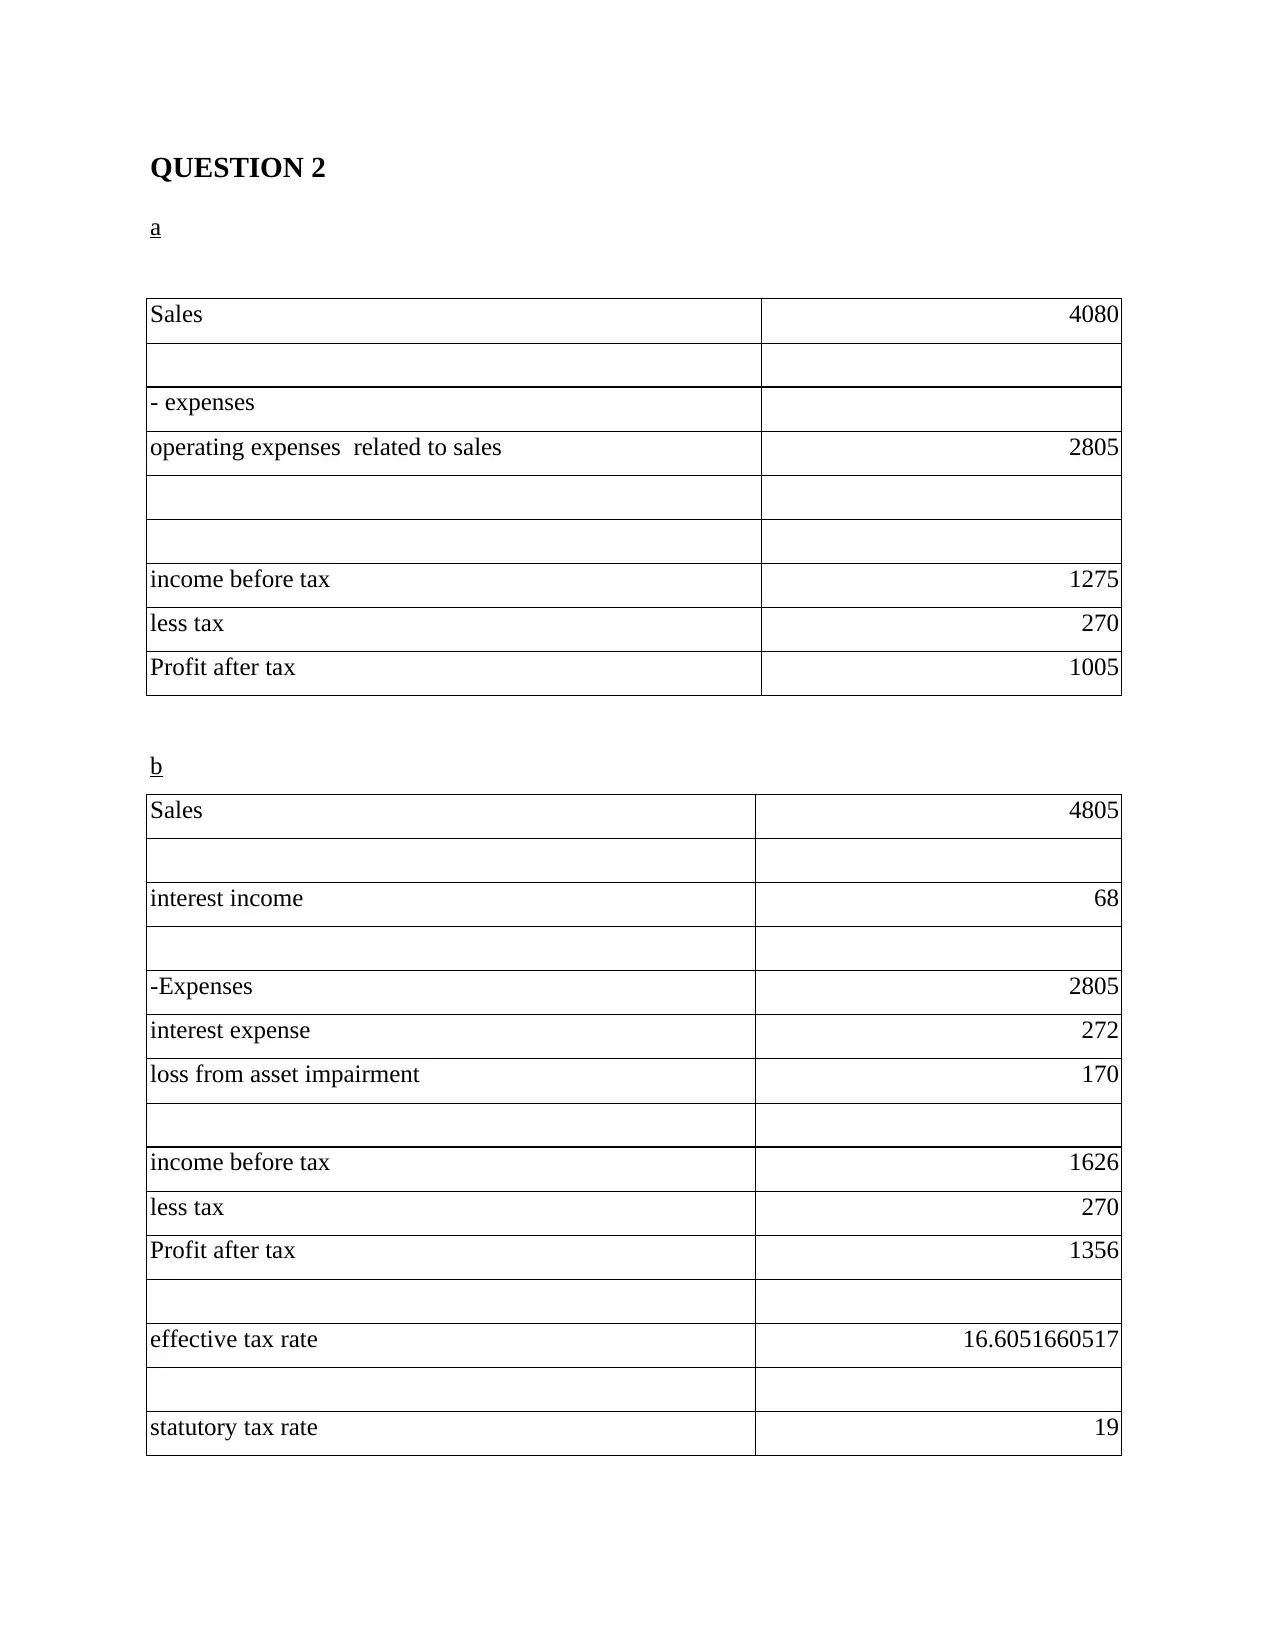
QUESTION 2
a
Sales 4080
- expenses
operating expenses related to sales 2805
income before tax 1275
less tax 270
Profit after tax 1005
b
Sales 4805
interest income 68
-Expenses 2805
interest expense 272
loss from asset impairment 170
income before tax 1626
less tax 270
Profit after tax 1356
effective tax rate 16.6051660517
statutory tax rate 19
Paraphrase This Document
Need a fresh take? Get an instant paraphrase of this document with our AI Paraphraser
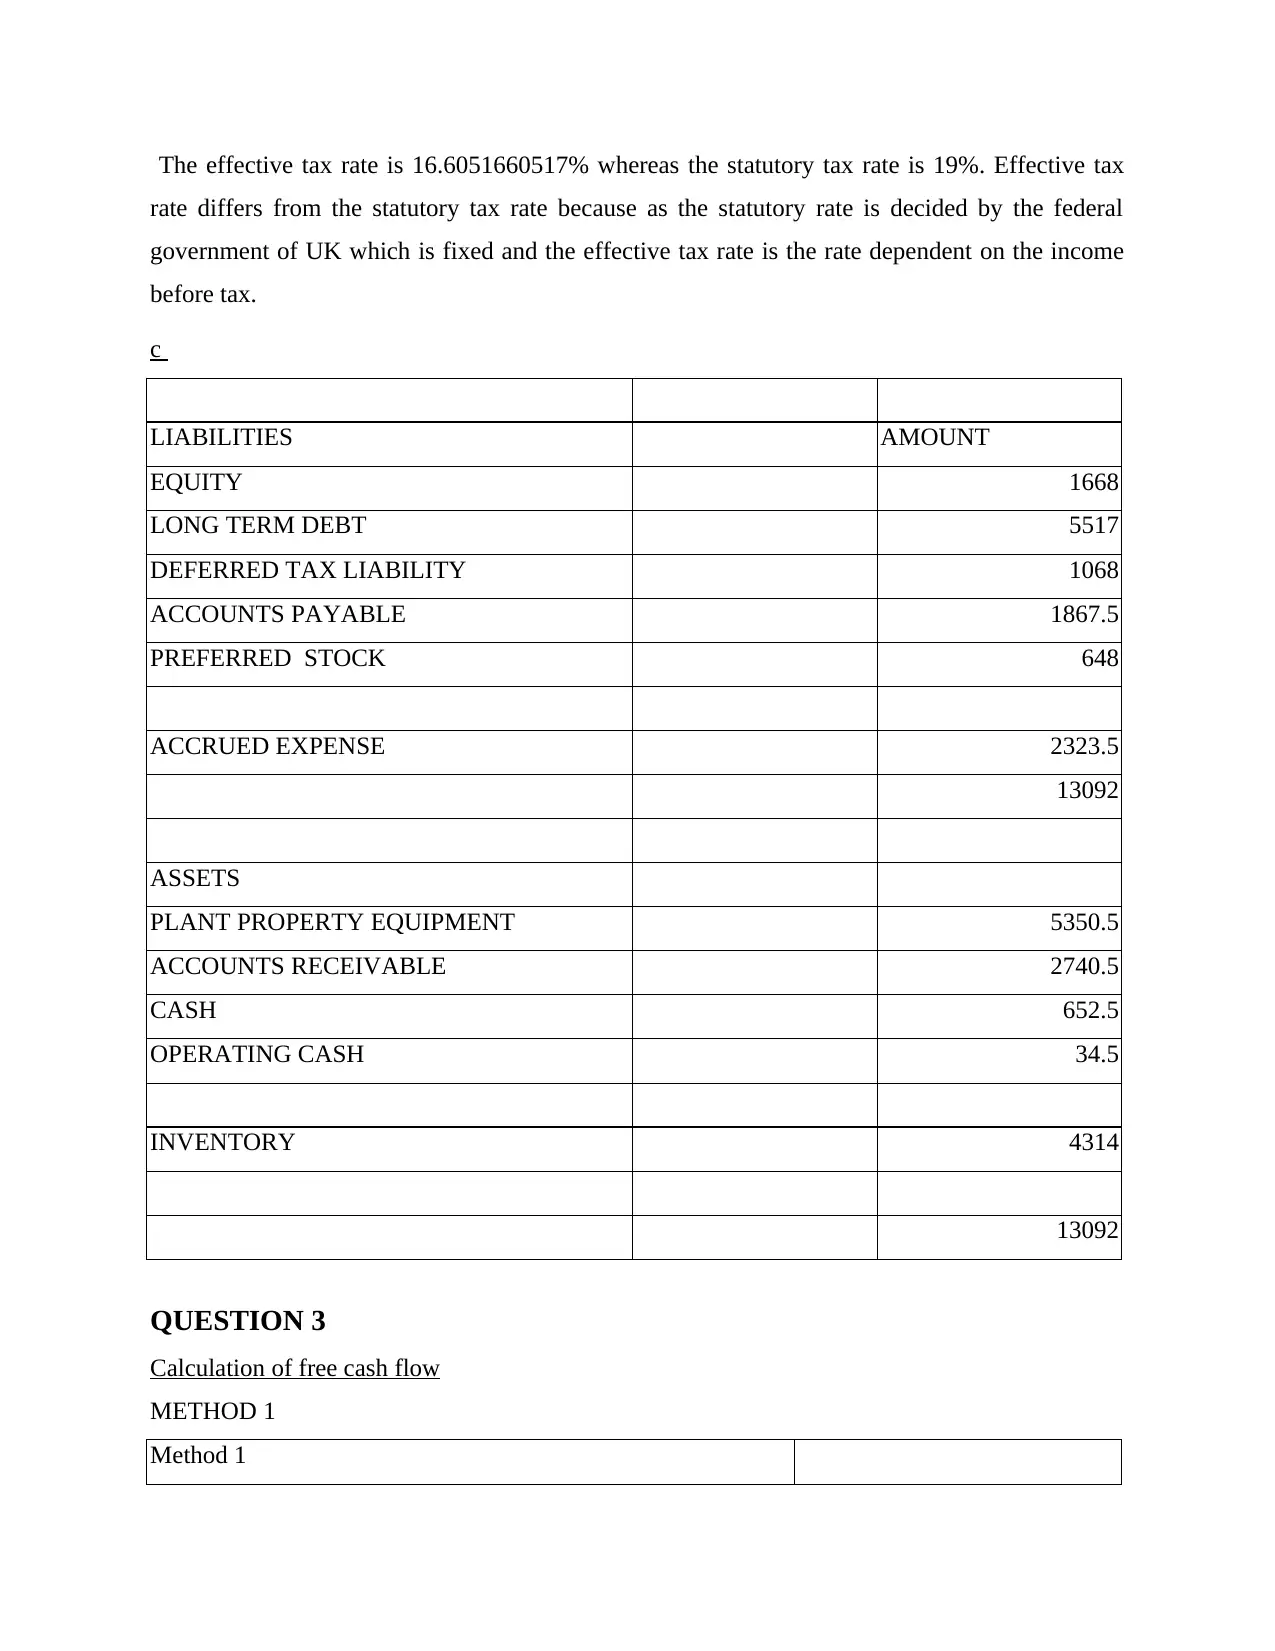
The effective tax rate is 16.6051660517% whereas the statutory tax rate is 19%. Effective tax
rate differs from the statutory tax rate because as the statutory rate is decided by the federal
government of UK which is fixed and the effective tax rate is the rate dependent on the income
before tax.
c
LIABILITIES AMOUNT
EQUITY 1668
LONG TERM DEBT 5517
DEFERRED TAX LIABILITY 1068
ACCOUNTS PAYABLE 1867.5
PREFERRED STOCK 648
ACCRUED EXPENSE 2323.5
13092
ASSETS
PLANT PROPERTY EQUIPMENT 5350.5
ACCOUNTS RECEIVABLE 2740.5
CASH 652.5
OPERATING CASH 34.5
INVENTORY 4314
13092
QUESTION 3
Calculation of free cash flow
METHOD 1
Method 1
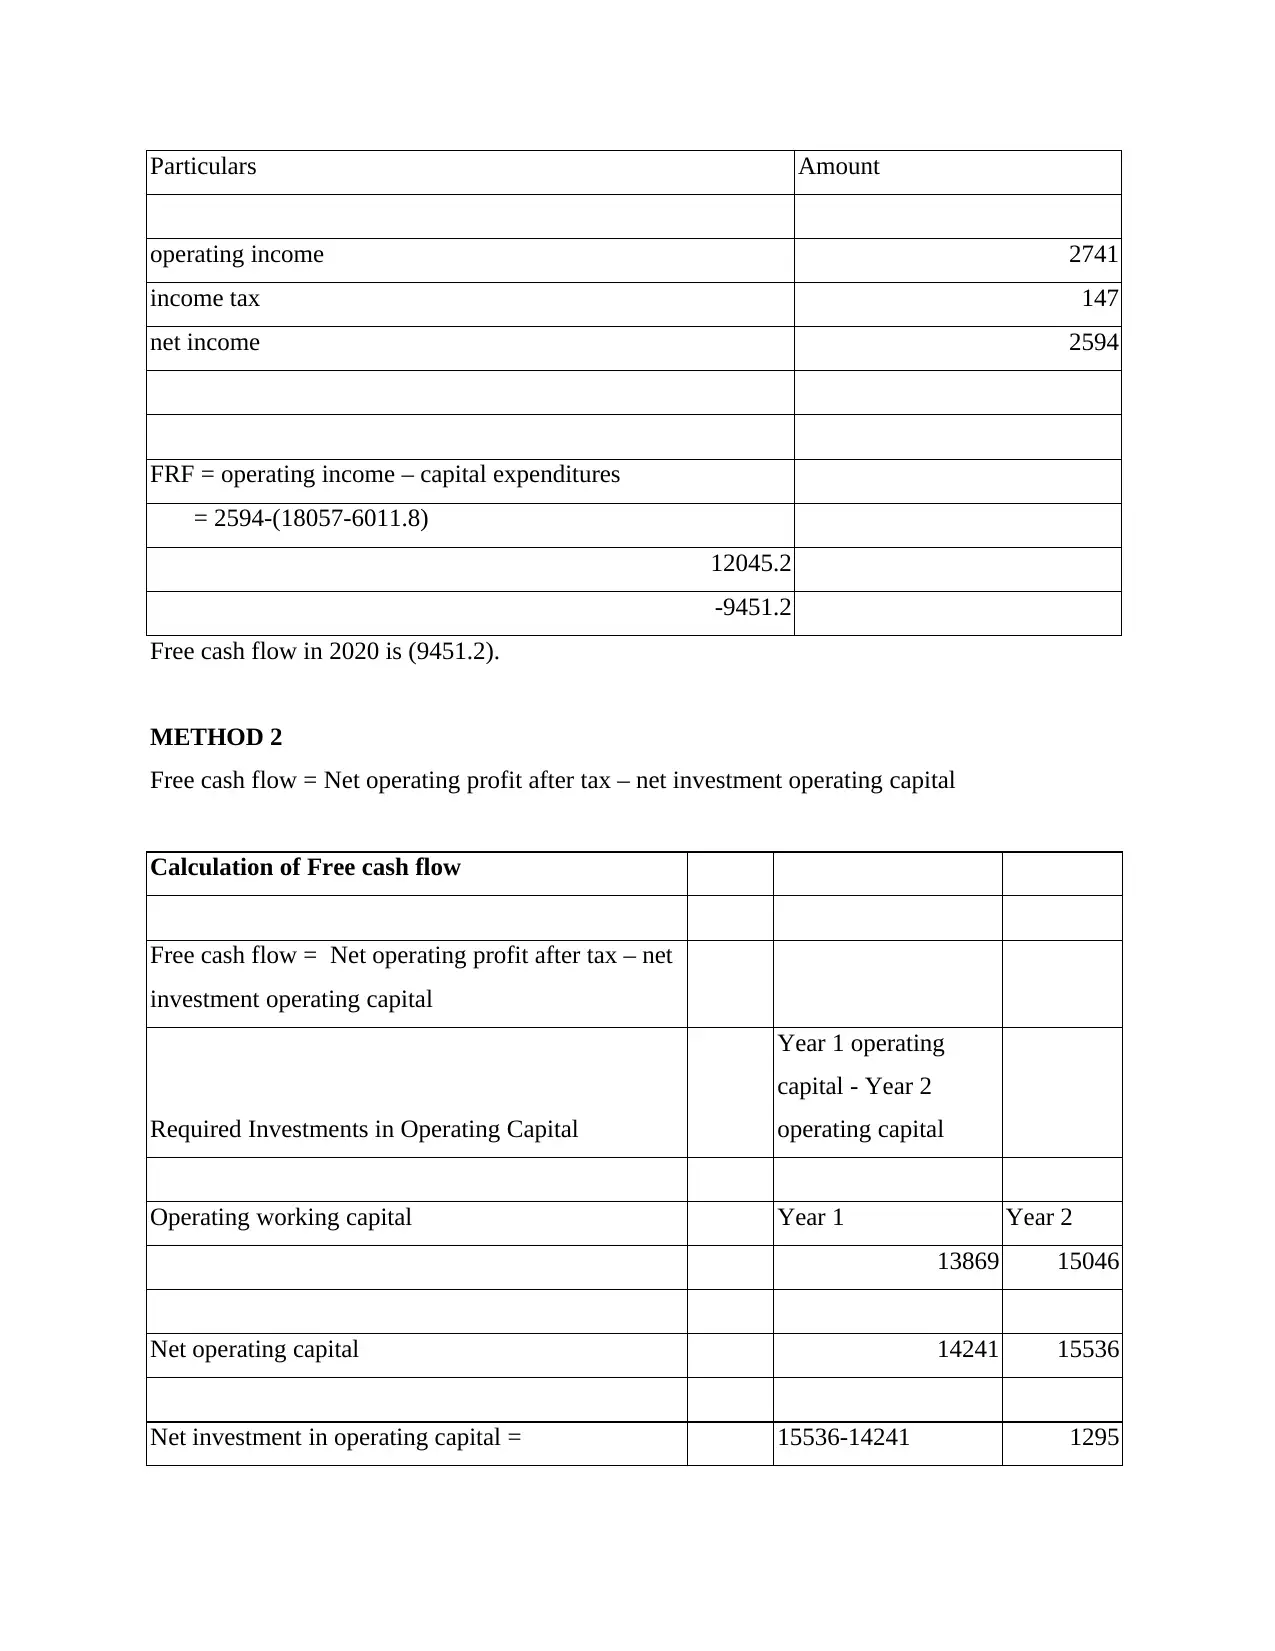
Particulars Amount
operating income 2741
income tax 147
net income 2594
FRF = operating income – capital expenditures
= 2594-(18057-6011.8)
12045.2
-9451.2
Free cash flow in 2020 is (9451.2).
METHOD 2
Free cash flow = Net operating profit after tax – net investment operating capital
Calculation of Free cash flow
Free cash flow = Net operating profit after tax – net
investment operating capital
Required Investments in Operating Capital
Year 1 operating
capital - Year 2
operating capital
Operating working capital Year 1 Year 2
13869 15046
Net operating capital 14241 15536
Net investment in operating capital = 15536-14241 1295
⊘ This is a preview!⊘
Do you want full access?
Subscribe today to unlock all pages.
Trusted by 1+ million students worldwide
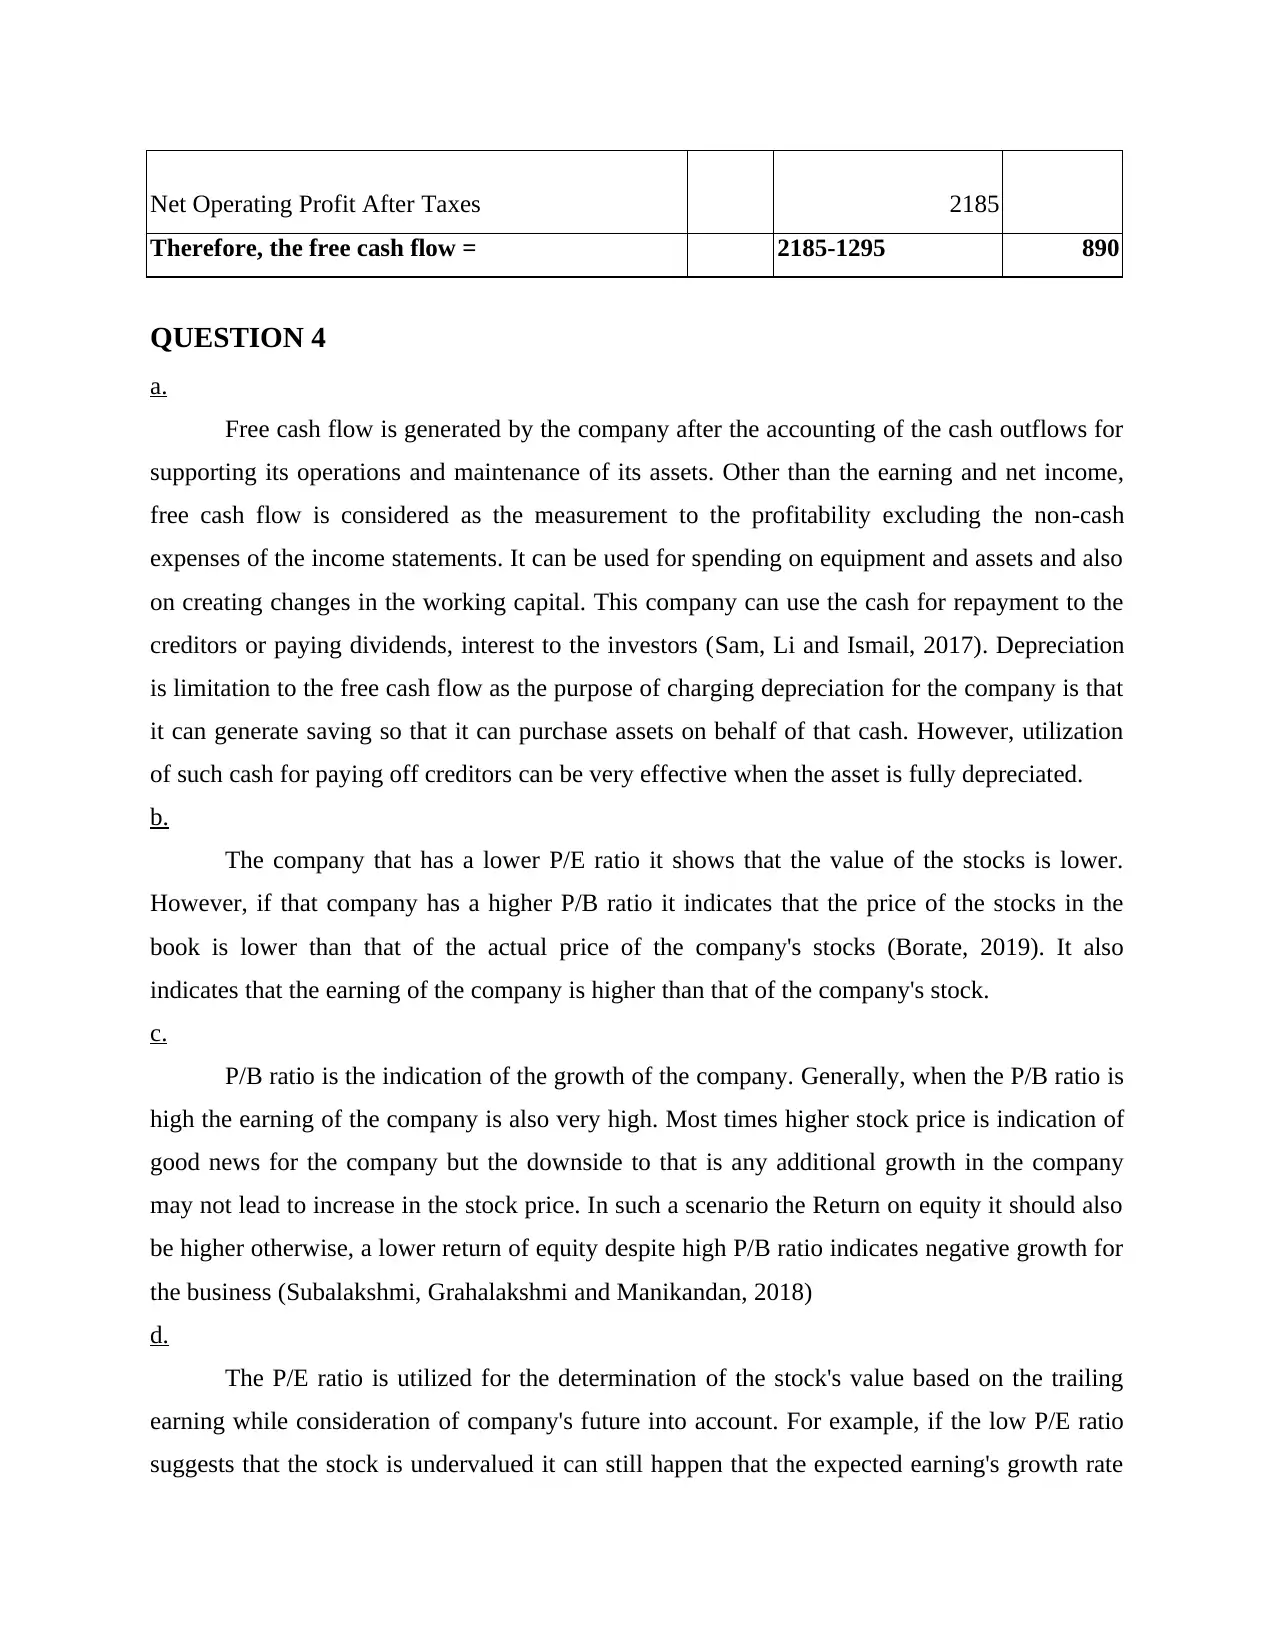
Net Operating Profit After Taxes 2185
Therefore, the free cash flow = 2185-1295 890
QUESTION 4
a.
Free cash flow is generated by the company after the accounting of the cash outflows for
supporting its operations and maintenance of its assets. Other than the earning and net income,
free cash flow is considered as the measurement to the profitability excluding the non-cash
expenses of the income statements. It can be used for spending on equipment and assets and also
on creating changes in the working capital. This company can use the cash for repayment to the
creditors or paying dividends, interest to the investors (Sam, Li and Ismail, 2017). Depreciation
is limitation to the free cash flow as the purpose of charging depreciation for the company is that
it can generate saving so that it can purchase assets on behalf of that cash. However, utilization
of such cash for paying off creditors can be very effective when the asset is fully depreciated.
b.
The company that has a lower P/E ratio it shows that the value of the stocks is lower.
However, if that company has a higher P/B ratio it indicates that the price of the stocks in the
book is lower than that of the actual price of the company's stocks (Borate, 2019). It also
indicates that the earning of the company is higher than that of the company's stock.
c.
P/B ratio is the indication of the growth of the company. Generally, when the P/B ratio is
high the earning of the company is also very high. Most times higher stock price is indication of
good news for the company but the downside to that is any additional growth in the company
may not lead to increase in the stock price. In such a scenario the Return on equity it should also
be higher otherwise, a lower return of equity despite high P/B ratio indicates negative growth for
the business (Subalakshmi, Grahalakshmi and Manikandan, 2018)
d.
The P/E ratio is utilized for the determination of the stock's value based on the trailing
earning while consideration of company's future into account. For example, if the low P/E ratio
suggests that the stock is undervalued it can still happen that the expected earning's growth rate
Paraphrase This Document
Need a fresh take? Get an instant paraphrase of this document with our AI Paraphraser
in the future increases. This happens as PEG ratio is considered to be good when it is at 1 or
lower which suggests that the stock is fairly priced or is undervalued.
e.
Return on equity is the measurement of the financial performance of the company which
is calculated by the division of net income with the shareholder's equity (Haralayya, 2021). It
measures the corporation's profitability in relation to stockholder's equity. Increasing the debt, a
company increases its total assets which can be cash, or any kind of asset. The equity in ROE, is
equal to the assets minus the total debt. The company as a result decreases its equity by
increasing its debt or in other words increasing the borrowing effects the return on equity. In the
increase in debt shrinks the equity and as the formula of ROE has equity as the denominator, the
Return on equity increases.
QUESTION 5
A
The return on capital employed is the return which company is providing to its
shareholders. With the analysis of the data provided by Everest Ltd, it is clear that return on
capital equity has increased in comparison to last year (Murtala and et.al., 2018). This is
particularly due to the changes within the financing and operating activities. with respect to the
operating activity the sales of company have increased by 23.25 % and as a result of this profits
also increased. On the basis of operating income after tax it is evident that there is 18.60 %
increase in profit after tax. With this it can be implied that due to increase in profits the return on
capital employed has increased. Further with reference to financing activity both financial
obligation and average common shareholder equity has increased. With this it can be assumed
that with increase in shareholders and debt obligation the company will invest money in
operations and as a result of this profitability will be increased and will be provided to the
shareholders as return.
B
The return on net asset is a measure which assist the company in evaluating the financial
performance of the company based on the fixed assets. With the evaluation of Everest Ltd, data it
is clearly visible that return on net asset has reduced from 13.87 % to 12.86 %. With respect to
profit margin it is clear that profit has increased in comparison to last year and this will be
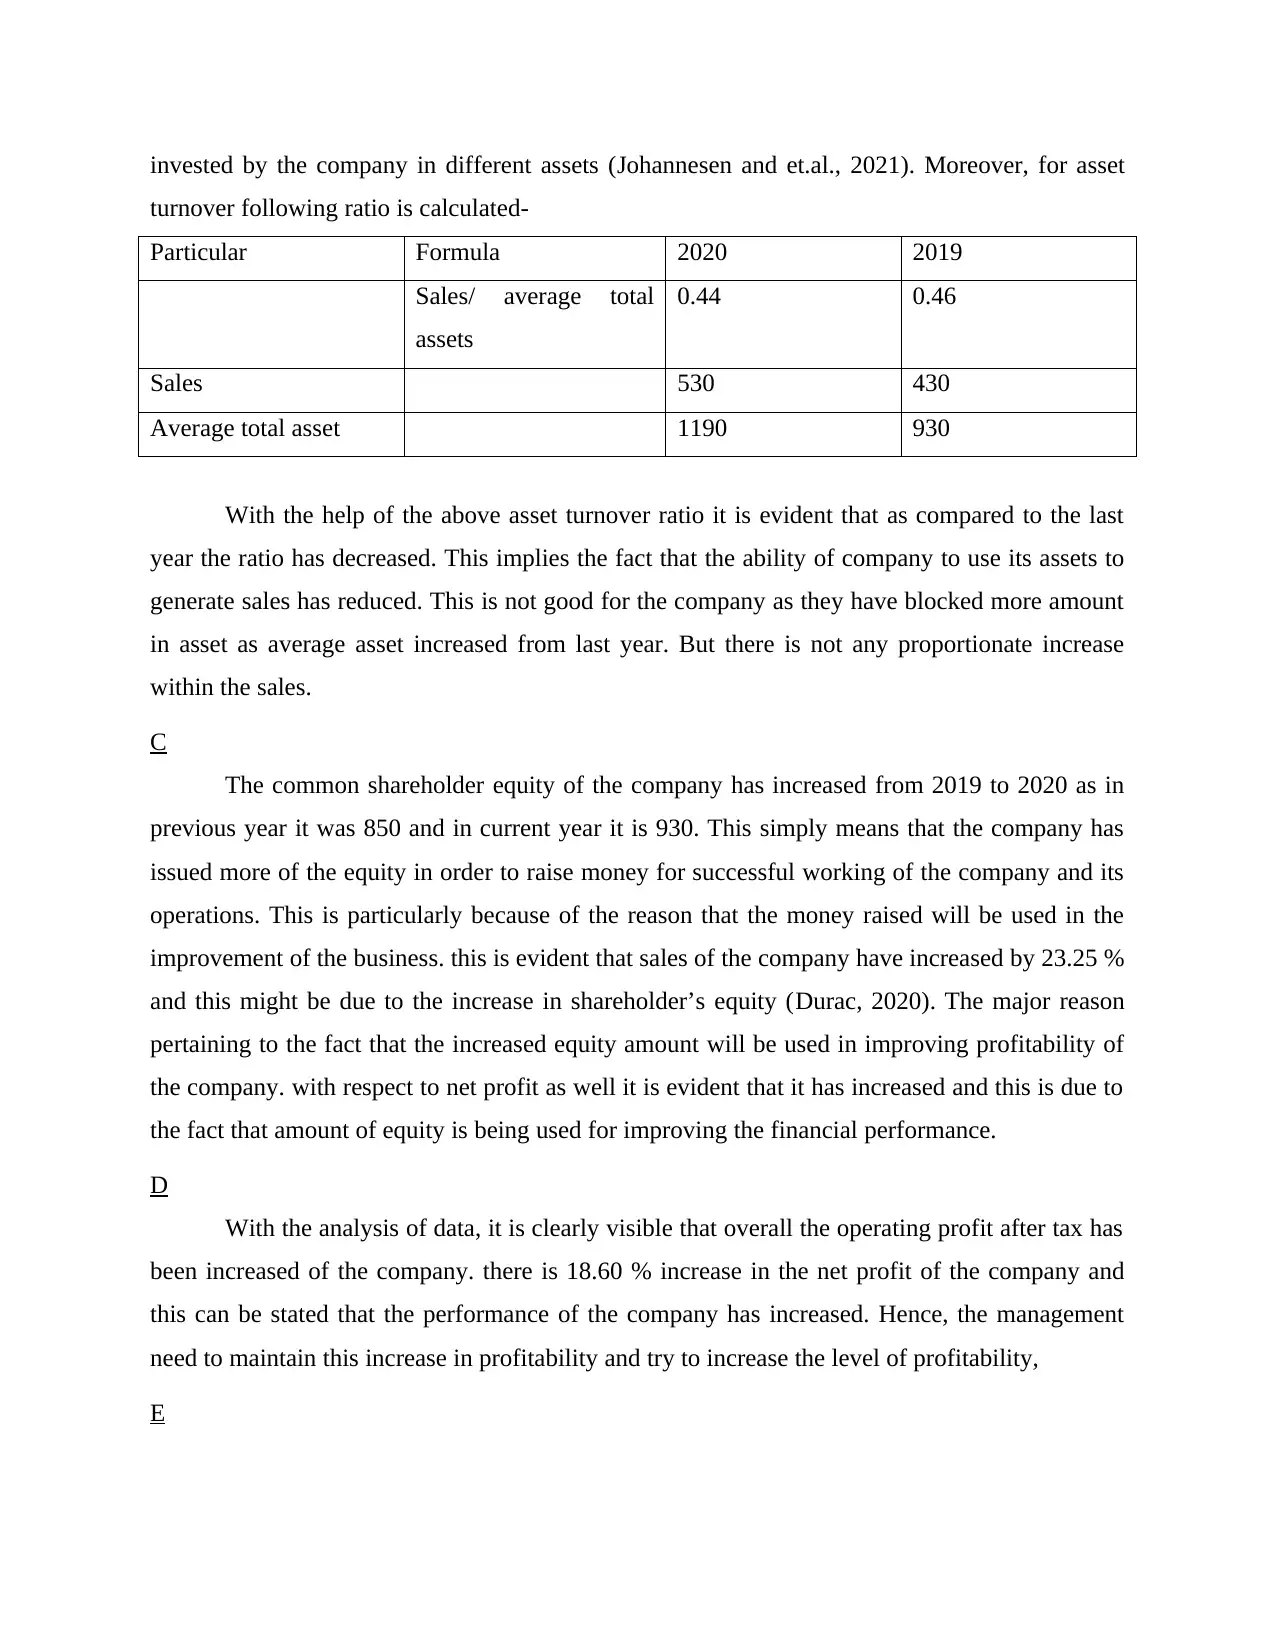
invested by the company in different assets (Johannesen and et.al., 2021). Moreover, for asset
turnover following ratio is calculated-
Particular Formula 2020 2019
Sales/ average total
assets
0.44 0.46
Sales 530 430
Average total asset 1190 930
With the help of the above asset turnover ratio it is evident that as compared to the last
year the ratio has decreased. This implies the fact that the ability of company to use its assets to
generate sales has reduced. This is not good for the company as they have blocked more amount
in asset as average asset increased from last year. But there is not any proportionate increase
within the sales.
C
The common shareholder equity of the company has increased from 2019 to 2020 as in
previous year it was 850 and in current year it is 930. This simply means that the company has
issued more of the equity in order to raise money for successful working of the company and its
operations. This is particularly because of the reason that the money raised will be used in the
improvement of the business. this is evident that sales of the company have increased by 23.25 %
and this might be due to the increase in shareholder’s equity (Durac, 2020). The major reason
pertaining to the fact that the increased equity amount will be used in improving profitability of
the company. with respect to net profit as well it is evident that it has increased and this is due to
the fact that amount of equity is being used for improving the financial performance.
D
With the analysis of data, it is clearly visible that overall the operating profit after tax has
been increased of the company. there is 18.60 % increase in the net profit of the company and
this can be stated that the performance of the company has increased. Hence, the management
need to maintain this increase in profitability and try to increase the level of profitability,
E
⊘ This is a preview!⊘
Do you want full access?
Subscribe today to unlock all pages.
Trusted by 1+ million students worldwide
With help of the above calculation it is clear that the company is having a competitive
advantage. This is particularly because of the reason that the net profit of company has increased
and this implies that company is performing in proper manner (Tondok, Pahlevi and Aswan,
2019). In addition to this, ROCE of company is also good which implies that company is
providing good returns to the shareholders. Hence, this will attract more of the people to invest in
equity of company which will provide a competitive advantage to the company.
Paraphrase This Document
Need a fresh take? Get an instant paraphrase of this document with our AI Paraphraser
REFERENCES
Books and Journals
Durac, C., 2020. Study of the Dynamics of the Net Asset Value of Voluntary Private Pension
Funds under the Influence of the Annualized Rate of Return. Ovidius University Annals,
Economic Sciences Series. 20(1). pp.919-929.
Haralayya, B., 2021. Financial Statement Analysis of Shri Ram City Union Finance. Iconic
Research And Engineering Journals, 4(12), pp.183-196.
Johannesen, S., and et.al., 2021, March. Probability-Derived Risk-Model: Lowers Costs through
Reduction in Backup Tool Requirements, Improves Return on Capital Employed for the
Contractor, and Reduces Scope 1 CO2 Emissions. In SPE/IADC International Drilling
Conference and Exhibition. OnePetro.
Murtala, S., and et.al., 2018. Capital structure and return on capital employed of construction
companies in Nigeria. African Journal of Accounting, Auditing and Finance. 6(1). pp.1-20.
Sam, M.F.M., Li, B.L.X. and Ismail, A.F., 2017. Analyzing the Financial Performance of
Telecommunication Companies in Malaysia by Using Financial Statements. Advanced
Science Letters, 23(8), pp.7641-7644.
Subalakshmi, S., Grahalakshmi, S. and Manikandan, M., 2018. Financial Ratio Analysis of SBI
[2009-2016]. ICTACT Journal on Management studies, 4(01), pp.2395-1664.
Tondok, B. S., Pahlevi, C. and Aswan, A., 2019. The Influence of Capital Structure, Growth,
Company Size to Profitability and Company Value of Manufacture Firms Listed in
Indonesia Stock Exchange. Hasanuddin Journal of Business Strategy. 1(3). pp.66-78.
Online
Borate, N., 2019. PE versus PB ratio: which one to used to assess a company's health.[Online].
Available through: <https://www.livemint.com/money/personal-finance/pe-versus-pb-
ratio-which-one-to-use-to-assess-a-company-s-health-1568132592441.html>
1 out of 11
Related Documents


Your All-in-One AI-Powered Toolkit for Academic Success.
+13062052269
info@desklib.com
Available 24*7 on WhatsApp / Email
![[object Object]](/_next/static/media/star-bottom.7253800d.svg)
Unlock your academic potential
Copyright © 2020–2026 A2Z Services. All Rights Reserved. Developed and managed by ZUCOL.